Free Statistics

of Irreproducible Research!

Author's title

Author*The author of this computation has been verified*
R Software Modulerwasp_autocorrelation.wasp
Title produced by software(Partial) Autocorrelation Function
Date of computationMon, 08 Dec 2008 10:16:45 -0700
Cite this page as followsStatistical Computations at FreeStatistics.org, Office for Research Development and Education, URL https://freestatistics.org/blog/index.php?v=date/2008/Dec/08/t1228756670197iq8yiasi5n8z.htm/, Retrieved Thu, 16 May 2024 15:03:31 +0000
Statistical Computations at FreeStatistics.org, Office for Research Development and Education, URL https://freestatistics.org/blog/index.php?pk=30605, Retrieved Thu, 16 May 2024 15:03:31 +0000
QR Codes:

Original text written by user:
IsPrivate?No (this computation is public)
User-defined keywords
Estimated Impact160
Family? (F = Feedback message, R = changed R code, M = changed R Module, P = changed Parameters, D = changed Data)
-     [Univariate Data Series] [data set] [2008-12-01 19:54:57] [b98453cac15ba1066b407e146608df68]
F RMPD    [(Partial) Autocorrelation Function] [Workshop 8] [2008-12-08 17:16:45] [d300b7a0882cee7d84584ad37a3d4ede] [Current]
Feedback Forum
2008-12-13 10:59:13 [Sofie Sergoynne] [reply
Correct antwoord vind ik.

Post a new message
Dataseries X:
103.68
103.64
103.37
104.3
104.15
104.09
104.21
104.27
104
103.36
104.2
104.12
103.79
104.65
103.84
103.98
103.83
104.34
103.76
103.57
103.06
103.06
102.6
103.41
103.15
103.33
103.96
104.91
104.23
103.68
104.16
104.49
104.23
104.21
103.74
103.96
104.02
104.15
103.74
103.23
103.69
103.46
102.14
102.39
102.19
102.02
102.64
103.52
103.32
103.65
104.25
101.74
102.08
101.35
102.79
102.21
101.78
101.25
101.8
103
104.17
104.08
105.24
104.72
104.77
104.39
104.14
105.15
105.07
104.54
106.03
107.24
108.2
109.15
110.1
109.48
109.96
110.13
110.53
110.82
110.06
110.05
109.49
109.95


Summary of computational transaction
Raw Inputview raw input (R code)
Raw Outputview raw output of R engine
Computing time1 seconds
R Server'George Udny Yule' @ 72.249.76.132

\begin{tabular}{lllllllll}
\hline
Summary of computational transaction \tabularnewline
Raw Input & view raw input (R code)  \tabularnewline
Raw Output & view raw output of R engine  \tabularnewline
Computing time & 1 seconds \tabularnewline
R Server & 'George Udny Yule' @ 72.249.76.132 \tabularnewline
\hline
\end{tabular}
%Source: https://freestatistics.org/blog/index.php?pk=30605&T=0

[TABLE]
[ROW][C]Summary of computational transaction[/C][/ROW]
[ROW][C]Raw Input[/C][C]view raw input (R code) [/C][/ROW]
[ROW][C]Raw Output[/C][C]view raw output of R engine [/C][/ROW]
[ROW][C]Computing time[/C][C]1 seconds[/C][/ROW]
[ROW][C]R Server[/C][C]'George Udny Yule' @ 72.249.76.132[/C][/ROW]
[/TABLE]
Source: https://freestatistics.org/blog/index.php?pk=30605&T=0

Globally Unique Identifier (entire table): ba.freestatistics.org/blog/index.php?pk=30605&T=0

As an alternative you can also use a QR Code:  

The GUIDs for individual cells are displayed in the table below:

Summary of computational transaction
Raw Inputview raw input (R code)
Raw Outputview raw output of R engine
Computing time1 seconds
R Server'George Udny Yule' @ 72.249.76.132


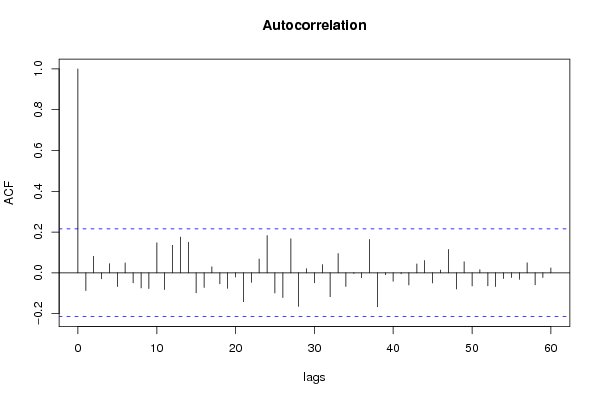
Autocorrelation Function
Time lag kACF(k)T-STATP-value
1-0.087326-0.79560.214275
20.0807750.73590.231935
3-0.029519-0.26890.394327
40.0446410.40670.342638
5-0.067774-0.61740.269314
60.0486710.44340.329309
7-0.049386-0.44990.326969
8-0.074345-0.67730.250045
9-0.077441-0.70550.24123
100.1472121.34120.091762
11-0.08229-0.74970.227779
120.1347781.22790.11148
130.1753951.59790.05693
140.1500041.36660.087721
15-0.098202-0.89470.186778
16-0.0716-0.65230.258001
170.0293890.26770.39478
18-0.053823-0.49030.312591
19-0.076271-0.69490.244543
20-0.020523-0.1870.42607
21-0.141886-1.29260.099861
22-0.046892-0.42720.335168
230.0675860.61570.269877
240.1827781.66520.049823
25-0.098881-0.90080.185138
26-0.121255-1.10470.136244
270.1666841.51860.066336
28-0.164875-1.50210.068436
290.0199110.18140.42825
30-0.049138-0.44770.327779
310.0404710.36870.356641
32-0.116908-1.06510.144963
330.0944770.86070.195934
34-0.067025-0.61060.271558
35-0.003178-0.0290.488484
36-0.023839-0.21720.414298
370.1634331.48890.070146
38-0.166759-1.51920.06625
39-0.009085-0.08280.467116
40-0.041915-0.38190.35177
41-0.004758-0.04330.482766
42-0.059824-0.5450.293598
430.0434880.39620.34649
440.0600610.54720.292861
45-0.049816-0.45380.325562
460.0133970.12210.451577
470.1148061.04590.149314
48-0.079468-0.7240.235554
490.0536330.48860.3132
50-0.064442-0.58710.279368
510.0154610.14090.444161
52-0.063627-0.57970.281855
53-0.067347-0.61360.27059
54-0.028383-0.25860.3983
55-0.023664-0.21560.414918
56-0.031817-0.28990.386322
570.0489520.4460.32839
58-0.058949-0.53710.296335
59-0.022597-0.20590.418698
600.0238520.21730.414255

\begin{tabular}{lllllllll}
\hline
Autocorrelation Function \tabularnewline
Time lag k & ACF(k) & T-STAT & P-value \tabularnewline
1 & -0.087326 & -0.7956 & 0.214275 \tabularnewline
2 & 0.080775 & 0.7359 & 0.231935 \tabularnewline
3 & -0.029519 & -0.2689 & 0.394327 \tabularnewline
4 & 0.044641 & 0.4067 & 0.342638 \tabularnewline
5 & -0.067774 & -0.6174 & 0.269314 \tabularnewline
6 & 0.048671 & 0.4434 & 0.329309 \tabularnewline
7 & -0.049386 & -0.4499 & 0.326969 \tabularnewline
8 & -0.074345 & -0.6773 & 0.250045 \tabularnewline
9 & -0.077441 & -0.7055 & 0.24123 \tabularnewline
10 & 0.147212 & 1.3412 & 0.091762 \tabularnewline
11 & -0.08229 & -0.7497 & 0.227779 \tabularnewline
12 & 0.134778 & 1.2279 & 0.11148 \tabularnewline
13 & 0.175395 & 1.5979 & 0.05693 \tabularnewline
14 & 0.150004 & 1.3666 & 0.087721 \tabularnewline
15 & -0.098202 & -0.8947 & 0.186778 \tabularnewline
16 & -0.0716 & -0.6523 & 0.258001 \tabularnewline
17 & 0.029389 & 0.2677 & 0.39478 \tabularnewline
18 & -0.053823 & -0.4903 & 0.312591 \tabularnewline
19 & -0.076271 & -0.6949 & 0.244543 \tabularnewline
20 & -0.020523 & -0.187 & 0.42607 \tabularnewline
21 & -0.141886 & -1.2926 & 0.099861 \tabularnewline
22 & -0.046892 & -0.4272 & 0.335168 \tabularnewline
23 & 0.067586 & 0.6157 & 0.269877 \tabularnewline
24 & 0.182778 & 1.6652 & 0.049823 \tabularnewline
25 & -0.098881 & -0.9008 & 0.185138 \tabularnewline
26 & -0.121255 & -1.1047 & 0.136244 \tabularnewline
27 & 0.166684 & 1.5186 & 0.066336 \tabularnewline
28 & -0.164875 & -1.5021 & 0.068436 \tabularnewline
29 & 0.019911 & 0.1814 & 0.42825 \tabularnewline
30 & -0.049138 & -0.4477 & 0.327779 \tabularnewline
31 & 0.040471 & 0.3687 & 0.356641 \tabularnewline
32 & -0.116908 & -1.0651 & 0.144963 \tabularnewline
33 & 0.094477 & 0.8607 & 0.195934 \tabularnewline
34 & -0.067025 & -0.6106 & 0.271558 \tabularnewline
35 & -0.003178 & -0.029 & 0.488484 \tabularnewline
36 & -0.023839 & -0.2172 & 0.414298 \tabularnewline
37 & 0.163433 & 1.4889 & 0.070146 \tabularnewline
38 & -0.166759 & -1.5192 & 0.06625 \tabularnewline
39 & -0.009085 & -0.0828 & 0.467116 \tabularnewline
40 & -0.041915 & -0.3819 & 0.35177 \tabularnewline
41 & -0.004758 & -0.0433 & 0.482766 \tabularnewline
42 & -0.059824 & -0.545 & 0.293598 \tabularnewline
43 & 0.043488 & 0.3962 & 0.34649 \tabularnewline
44 & 0.060061 & 0.5472 & 0.292861 \tabularnewline
45 & -0.049816 & -0.4538 & 0.325562 \tabularnewline
46 & 0.013397 & 0.1221 & 0.451577 \tabularnewline
47 & 0.114806 & 1.0459 & 0.149314 \tabularnewline
48 & -0.079468 & -0.724 & 0.235554 \tabularnewline
49 & 0.053633 & 0.4886 & 0.3132 \tabularnewline
50 & -0.064442 & -0.5871 & 0.279368 \tabularnewline
51 & 0.015461 & 0.1409 & 0.444161 \tabularnewline
52 & -0.063627 & -0.5797 & 0.281855 \tabularnewline
53 & -0.067347 & -0.6136 & 0.27059 \tabularnewline
54 & -0.028383 & -0.2586 & 0.3983 \tabularnewline
55 & -0.023664 & -0.2156 & 0.414918 \tabularnewline
56 & -0.031817 & -0.2899 & 0.386322 \tabularnewline
57 & 0.048952 & 0.446 & 0.32839 \tabularnewline
58 & -0.058949 & -0.5371 & 0.296335 \tabularnewline
59 & -0.022597 & -0.2059 & 0.418698 \tabularnewline
60 & 0.023852 & 0.2173 & 0.414255 \tabularnewline
\hline
\end{tabular}
%Source: https://freestatistics.org/blog/index.php?pk=30605&T=1

[TABLE]
[ROW][C]Autocorrelation Function[/C][/ROW]
[ROW][C]Time lag k[/C][C]ACF(k)[/C][C]T-STAT[/C][C]P-value[/C][/ROW]
[ROW][C]1[/C][C]-0.087326[/C][C]-0.7956[/C][C]0.214275[/C][/ROW]
[ROW][C]2[/C][C]0.080775[/C][C]0.7359[/C][C]0.231935[/C][/ROW]
[ROW][C]3[/C][C]-0.029519[/C][C]-0.2689[/C][C]0.394327[/C][/ROW]
[ROW][C]4[/C][C]0.044641[/C][C]0.4067[/C][C]0.342638[/C][/ROW]
[ROW][C]5[/C][C]-0.067774[/C][C]-0.6174[/C][C]0.269314[/C][/ROW]
[ROW][C]6[/C][C]0.048671[/C][C]0.4434[/C][C]0.329309[/C][/ROW]
[ROW][C]7[/C][C]-0.049386[/C][C]-0.4499[/C][C]0.326969[/C][/ROW]
[ROW][C]8[/C][C]-0.074345[/C][C]-0.6773[/C][C]0.250045[/C][/ROW]
[ROW][C]9[/C][C]-0.077441[/C][C]-0.7055[/C][C]0.24123[/C][/ROW]
[ROW][C]10[/C][C]0.147212[/C][C]1.3412[/C][C]0.091762[/C][/ROW]
[ROW][C]11[/C][C]-0.08229[/C][C]-0.7497[/C][C]0.227779[/C][/ROW]
[ROW][C]12[/C][C]0.134778[/C][C]1.2279[/C][C]0.11148[/C][/ROW]
[ROW][C]13[/C][C]0.175395[/C][C]1.5979[/C][C]0.05693[/C][/ROW]
[ROW][C]14[/C][C]0.150004[/C][C]1.3666[/C][C]0.087721[/C][/ROW]
[ROW][C]15[/C][C]-0.098202[/C][C]-0.8947[/C][C]0.186778[/C][/ROW]
[ROW][C]16[/C][C]-0.0716[/C][C]-0.6523[/C][C]0.258001[/C][/ROW]
[ROW][C]17[/C][C]0.029389[/C][C]0.2677[/C][C]0.39478[/C][/ROW]
[ROW][C]18[/C][C]-0.053823[/C][C]-0.4903[/C][C]0.312591[/C][/ROW]
[ROW][C]19[/C][C]-0.076271[/C][C]-0.6949[/C][C]0.244543[/C][/ROW]
[ROW][C]20[/C][C]-0.020523[/C][C]-0.187[/C][C]0.42607[/C][/ROW]
[ROW][C]21[/C][C]-0.141886[/C][C]-1.2926[/C][C]0.099861[/C][/ROW]
[ROW][C]22[/C][C]-0.046892[/C][C]-0.4272[/C][C]0.335168[/C][/ROW]
[ROW][C]23[/C][C]0.067586[/C][C]0.6157[/C][C]0.269877[/C][/ROW]
[ROW][C]24[/C][C]0.182778[/C][C]1.6652[/C][C]0.049823[/C][/ROW]
[ROW][C]25[/C][C]-0.098881[/C][C]-0.9008[/C][C]0.185138[/C][/ROW]
[ROW][C]26[/C][C]-0.121255[/C][C]-1.1047[/C][C]0.136244[/C][/ROW]
[ROW][C]27[/C][C]0.166684[/C][C]1.5186[/C][C]0.066336[/C][/ROW]
[ROW][C]28[/C][C]-0.164875[/C][C]-1.5021[/C][C]0.068436[/C][/ROW]
[ROW][C]29[/C][C]0.019911[/C][C]0.1814[/C][C]0.42825[/C][/ROW]
[ROW][C]30[/C][C]-0.049138[/C][C]-0.4477[/C][C]0.327779[/C][/ROW]
[ROW][C]31[/C][C]0.040471[/C][C]0.3687[/C][C]0.356641[/C][/ROW]
[ROW][C]32[/C][C]-0.116908[/C][C]-1.0651[/C][C]0.144963[/C][/ROW]
[ROW][C]33[/C][C]0.094477[/C][C]0.8607[/C][C]0.195934[/C][/ROW]
[ROW][C]34[/C][C]-0.067025[/C][C]-0.6106[/C][C]0.271558[/C][/ROW]
[ROW][C]35[/C][C]-0.003178[/C][C]-0.029[/C][C]0.488484[/C][/ROW]
[ROW][C]36[/C][C]-0.023839[/C][C]-0.2172[/C][C]0.414298[/C][/ROW]
[ROW][C]37[/C][C]0.163433[/C][C]1.4889[/C][C]0.070146[/C][/ROW]
[ROW][C]38[/C][C]-0.166759[/C][C]-1.5192[/C][C]0.06625[/C][/ROW]
[ROW][C]39[/C][C]-0.009085[/C][C]-0.0828[/C][C]0.467116[/C][/ROW]
[ROW][C]40[/C][C]-0.041915[/C][C]-0.3819[/C][C]0.35177[/C][/ROW]
[ROW][C]41[/C][C]-0.004758[/C][C]-0.0433[/C][C]0.482766[/C][/ROW]
[ROW][C]42[/C][C]-0.059824[/C][C]-0.545[/C][C]0.293598[/C][/ROW]
[ROW][C]43[/C][C]0.043488[/C][C]0.3962[/C][C]0.34649[/C][/ROW]
[ROW][C]44[/C][C]0.060061[/C][C]0.5472[/C][C]0.292861[/C][/ROW]
[ROW][C]45[/C][C]-0.049816[/C][C]-0.4538[/C][C]0.325562[/C][/ROW]
[ROW][C]46[/C][C]0.013397[/C][C]0.1221[/C][C]0.451577[/C][/ROW]
[ROW][C]47[/C][C]0.114806[/C][C]1.0459[/C][C]0.149314[/C][/ROW]
[ROW][C]48[/C][C]-0.079468[/C][C]-0.724[/C][C]0.235554[/C][/ROW]
[ROW][C]49[/C][C]0.053633[/C][C]0.4886[/C][C]0.3132[/C][/ROW]
[ROW][C]50[/C][C]-0.064442[/C][C]-0.5871[/C][C]0.279368[/C][/ROW]
[ROW][C]51[/C][C]0.015461[/C][C]0.1409[/C][C]0.444161[/C][/ROW]
[ROW][C]52[/C][C]-0.063627[/C][C]-0.5797[/C][C]0.281855[/C][/ROW]
[ROW][C]53[/C][C]-0.067347[/C][C]-0.6136[/C][C]0.27059[/C][/ROW]
[ROW][C]54[/C][C]-0.028383[/C][C]-0.2586[/C][C]0.3983[/C][/ROW]
[ROW][C]55[/C][C]-0.023664[/C][C]-0.2156[/C][C]0.414918[/C][/ROW]
[ROW][C]56[/C][C]-0.031817[/C][C]-0.2899[/C][C]0.386322[/C][/ROW]
[ROW][C]57[/C][C]0.048952[/C][C]0.446[/C][C]0.32839[/C][/ROW]
[ROW][C]58[/C][C]-0.058949[/C][C]-0.5371[/C][C]0.296335[/C][/ROW]
[ROW][C]59[/C][C]-0.022597[/C][C]-0.2059[/C][C]0.418698[/C][/ROW]
[ROW][C]60[/C][C]0.023852[/C][C]0.2173[/C][C]0.414255[/C][/ROW]
[/TABLE]
Source: https://freestatistics.org/blog/index.php?pk=30605&T=1

Globally Unique Identifier (entire table): ba.freestatistics.org/blog/index.php?pk=30605&T=1

As an alternative you can also use a QR Code:  

The GUIDs for individual cells are displayed in the table below:

Autocorrelation Function
Time lag kACF(k)T-STATP-value
1-0.087326-0.79560.214275
20.0807750.73590.231935
3-0.029519-0.26890.394327
40.0446410.40670.342638
5-0.067774-0.61740.269314
60.0486710.44340.329309
7-0.049386-0.44990.326969
8-0.074345-0.67730.250045
9-0.077441-0.70550.24123
100.1472121.34120.091762
11-0.08229-0.74970.227779
120.1347781.22790.11148
130.1753951.59790.05693
140.1500041.36660.087721
15-0.098202-0.89470.186778
16-0.0716-0.65230.258001
170.0293890.26770.39478
18-0.053823-0.49030.312591
19-0.076271-0.69490.244543
20-0.020523-0.1870.42607
21-0.141886-1.29260.099861
22-0.046892-0.42720.335168
230.0675860.61570.269877
240.1827781.66520.049823
25-0.098881-0.90080.185138
26-0.121255-1.10470.136244
270.1666841.51860.066336
28-0.164875-1.50210.068436
290.0199110.18140.42825
30-0.049138-0.44770.327779
310.0404710.36870.356641
32-0.116908-1.06510.144963
330.0944770.86070.195934
34-0.067025-0.61060.271558
35-0.003178-0.0290.488484
36-0.023839-0.21720.414298
370.1634331.48890.070146
38-0.166759-1.51920.06625
39-0.009085-0.08280.467116
40-0.041915-0.38190.35177
41-0.004758-0.04330.482766
42-0.059824-0.5450.293598
430.0434880.39620.34649
440.0600610.54720.292861
45-0.049816-0.45380.325562
460.0133970.12210.451577
470.1148061.04590.149314
48-0.079468-0.7240.235554
490.0536330.48860.3132
50-0.064442-0.58710.279368
510.0154610.14090.444161
52-0.063627-0.57970.281855
53-0.067347-0.61360.27059
54-0.028383-0.25860.3983
55-0.023664-0.21560.414918
56-0.031817-0.28990.386322
570.0489520.4460.32839
58-0.058949-0.53710.296335
59-0.022597-0.20590.418698
600.0238520.21730.414255


Partial Autocorrelation Function
Time lag kPACF(k)T-STATP-value
1-0.087326-0.79560.214275
20.0737110.67150.251871
3-0.016766-0.15270.439484
40.0354530.3230.373758
5-0.058817-0.53590.296747
60.0330540.30110.382032
7-0.033059-0.30120.382016
8-0.091849-0.83680.202557
9-0.080573-0.73410.232491
100.1434661.3070.097405
11-0.046622-0.42470.336061
120.1065090.97030.167348
130.2177881.98410.025272
140.1660831.51310.067028
15-0.085459-0.77860.219223
16-0.162668-1.4820.071067
170.0266160.24250.404503
18-0.026603-0.24240.404548
19-0.093633-0.8530.198046
20-0.036397-0.33160.370516
21-0.051915-0.4730.318739
22-0.041687-0.37980.352536
230.0316880.28870.386769
240.1778061.61990.054525
25-0.083002-0.75620.225841
26-0.305061-2.77920.003369
270.0878470.80030.212904
28-0.071084-0.64760.259513
290.0164660.150.440559
30-0.040125-0.36560.357813
310.1165391.06170.14572
320.0128120.11670.453681
330.0908860.8280.20502
34-0.039283-0.35790.36067
350.0249810.22760.410262
36-0.114437-1.04260.150088
37-0.052197-0.47550.317827
38-0.06232-0.56780.285864
390.0488110.44470.328851
400.0322340.29370.384872
41-0.09583-0.87310.192577
420.0393490.35850.360446
430.0495540.45150.32642
440.0961740.87620.191729
45-0.09194-0.83760.202327
46-0.04945-0.45050.326758
47-0.00014-0.00130.499493
48-0.059097-0.53840.29587
490.0772060.70340.241892
500.0054280.04950.480338
51-0.049938-0.4550.325164
520.0631970.57580.283169
53-0.069188-0.63030.265105
54-0.089548-0.81580.20847
550.0071950.06560.473946
56-0.129769-1.18230.12024
57-0.072648-0.66190.25495
58-0.0491-0.44730.327903
590.0167840.15290.439419
60-0.012941-0.11790.453218

\begin{tabular}{lllllllll}
\hline
Partial Autocorrelation Function \tabularnewline
Time lag k & PACF(k) & T-STAT & P-value \tabularnewline
1 & -0.087326 & -0.7956 & 0.214275 \tabularnewline
2 & 0.073711 & 0.6715 & 0.251871 \tabularnewline
3 & -0.016766 & -0.1527 & 0.439484 \tabularnewline
4 & 0.035453 & 0.323 & 0.373758 \tabularnewline
5 & -0.058817 & -0.5359 & 0.296747 \tabularnewline
6 & 0.033054 & 0.3011 & 0.382032 \tabularnewline
7 & -0.033059 & -0.3012 & 0.382016 \tabularnewline
8 & -0.091849 & -0.8368 & 0.202557 \tabularnewline
9 & -0.080573 & -0.7341 & 0.232491 \tabularnewline
10 & 0.143466 & 1.307 & 0.097405 \tabularnewline
11 & -0.046622 & -0.4247 & 0.336061 \tabularnewline
12 & 0.106509 & 0.9703 & 0.167348 \tabularnewline
13 & 0.217788 & 1.9841 & 0.025272 \tabularnewline
14 & 0.166083 & 1.5131 & 0.067028 \tabularnewline
15 & -0.085459 & -0.7786 & 0.219223 \tabularnewline
16 & -0.162668 & -1.482 & 0.071067 \tabularnewline
17 & 0.026616 & 0.2425 & 0.404503 \tabularnewline
18 & -0.026603 & -0.2424 & 0.404548 \tabularnewline
19 & -0.093633 & -0.853 & 0.198046 \tabularnewline
20 & -0.036397 & -0.3316 & 0.370516 \tabularnewline
21 & -0.051915 & -0.473 & 0.318739 \tabularnewline
22 & -0.041687 & -0.3798 & 0.352536 \tabularnewline
23 & 0.031688 & 0.2887 & 0.386769 \tabularnewline
24 & 0.177806 & 1.6199 & 0.054525 \tabularnewline
25 & -0.083002 & -0.7562 & 0.225841 \tabularnewline
26 & -0.305061 & -2.7792 & 0.003369 \tabularnewline
27 & 0.087847 & 0.8003 & 0.212904 \tabularnewline
28 & -0.071084 & -0.6476 & 0.259513 \tabularnewline
29 & 0.016466 & 0.15 & 0.440559 \tabularnewline
30 & -0.040125 & -0.3656 & 0.357813 \tabularnewline
31 & 0.116539 & 1.0617 & 0.14572 \tabularnewline
32 & 0.012812 & 0.1167 & 0.453681 \tabularnewline
33 & 0.090886 & 0.828 & 0.20502 \tabularnewline
34 & -0.039283 & -0.3579 & 0.36067 \tabularnewline
35 & 0.024981 & 0.2276 & 0.410262 \tabularnewline
36 & -0.114437 & -1.0426 & 0.150088 \tabularnewline
37 & -0.052197 & -0.4755 & 0.317827 \tabularnewline
38 & -0.06232 & -0.5678 & 0.285864 \tabularnewline
39 & 0.048811 & 0.4447 & 0.328851 \tabularnewline
40 & 0.032234 & 0.2937 & 0.384872 \tabularnewline
41 & -0.09583 & -0.8731 & 0.192577 \tabularnewline
42 & 0.039349 & 0.3585 & 0.360446 \tabularnewline
43 & 0.049554 & 0.4515 & 0.32642 \tabularnewline
44 & 0.096174 & 0.8762 & 0.191729 \tabularnewline
45 & -0.09194 & -0.8376 & 0.202327 \tabularnewline
46 & -0.04945 & -0.4505 & 0.326758 \tabularnewline
47 & -0.00014 & -0.0013 & 0.499493 \tabularnewline
48 & -0.059097 & -0.5384 & 0.29587 \tabularnewline
49 & 0.077206 & 0.7034 & 0.241892 \tabularnewline
50 & 0.005428 & 0.0495 & 0.480338 \tabularnewline
51 & -0.049938 & -0.455 & 0.325164 \tabularnewline
52 & 0.063197 & 0.5758 & 0.283169 \tabularnewline
53 & -0.069188 & -0.6303 & 0.265105 \tabularnewline
54 & -0.089548 & -0.8158 & 0.20847 \tabularnewline
55 & 0.007195 & 0.0656 & 0.473946 \tabularnewline
56 & -0.129769 & -1.1823 & 0.12024 \tabularnewline
57 & -0.072648 & -0.6619 & 0.25495 \tabularnewline
58 & -0.0491 & -0.4473 & 0.327903 \tabularnewline
59 & 0.016784 & 0.1529 & 0.439419 \tabularnewline
60 & -0.012941 & -0.1179 & 0.453218 \tabularnewline
\hline
\end{tabular}
%Source: https://freestatistics.org/blog/index.php?pk=30605&T=2

[TABLE]
[ROW][C]Partial Autocorrelation Function[/C][/ROW]
[ROW][C]Time lag k[/C][C]PACF(k)[/C][C]T-STAT[/C][C]P-value[/C][/ROW]
[ROW][C]1[/C][C]-0.087326[/C][C]-0.7956[/C][C]0.214275[/C][/ROW]
[ROW][C]2[/C][C]0.073711[/C][C]0.6715[/C][C]0.251871[/C][/ROW]
[ROW][C]3[/C][C]-0.016766[/C][C]-0.1527[/C][C]0.439484[/C][/ROW]
[ROW][C]4[/C][C]0.035453[/C][C]0.323[/C][C]0.373758[/C][/ROW]
[ROW][C]5[/C][C]-0.058817[/C][C]-0.5359[/C][C]0.296747[/C][/ROW]
[ROW][C]6[/C][C]0.033054[/C][C]0.3011[/C][C]0.382032[/C][/ROW]
[ROW][C]7[/C][C]-0.033059[/C][C]-0.3012[/C][C]0.382016[/C][/ROW]
[ROW][C]8[/C][C]-0.091849[/C][C]-0.8368[/C][C]0.202557[/C][/ROW]
[ROW][C]9[/C][C]-0.080573[/C][C]-0.7341[/C][C]0.232491[/C][/ROW]
[ROW][C]10[/C][C]0.143466[/C][C]1.307[/C][C]0.097405[/C][/ROW]
[ROW][C]11[/C][C]-0.046622[/C][C]-0.4247[/C][C]0.336061[/C][/ROW]
[ROW][C]12[/C][C]0.106509[/C][C]0.9703[/C][C]0.167348[/C][/ROW]
[ROW][C]13[/C][C]0.217788[/C][C]1.9841[/C][C]0.025272[/C][/ROW]
[ROW][C]14[/C][C]0.166083[/C][C]1.5131[/C][C]0.067028[/C][/ROW]
[ROW][C]15[/C][C]-0.085459[/C][C]-0.7786[/C][C]0.219223[/C][/ROW]
[ROW][C]16[/C][C]-0.162668[/C][C]-1.482[/C][C]0.071067[/C][/ROW]
[ROW][C]17[/C][C]0.026616[/C][C]0.2425[/C][C]0.404503[/C][/ROW]
[ROW][C]18[/C][C]-0.026603[/C][C]-0.2424[/C][C]0.404548[/C][/ROW]
[ROW][C]19[/C][C]-0.093633[/C][C]-0.853[/C][C]0.198046[/C][/ROW]
[ROW][C]20[/C][C]-0.036397[/C][C]-0.3316[/C][C]0.370516[/C][/ROW]
[ROW][C]21[/C][C]-0.051915[/C][C]-0.473[/C][C]0.318739[/C][/ROW]
[ROW][C]22[/C][C]-0.041687[/C][C]-0.3798[/C][C]0.352536[/C][/ROW]
[ROW][C]23[/C][C]0.031688[/C][C]0.2887[/C][C]0.386769[/C][/ROW]
[ROW][C]24[/C][C]0.177806[/C][C]1.6199[/C][C]0.054525[/C][/ROW]
[ROW][C]25[/C][C]-0.083002[/C][C]-0.7562[/C][C]0.225841[/C][/ROW]
[ROW][C]26[/C][C]-0.305061[/C][C]-2.7792[/C][C]0.003369[/C][/ROW]
[ROW][C]27[/C][C]0.087847[/C][C]0.8003[/C][C]0.212904[/C][/ROW]
[ROW][C]28[/C][C]-0.071084[/C][C]-0.6476[/C][C]0.259513[/C][/ROW]
[ROW][C]29[/C][C]0.016466[/C][C]0.15[/C][C]0.440559[/C][/ROW]
[ROW][C]30[/C][C]-0.040125[/C][C]-0.3656[/C][C]0.357813[/C][/ROW]
[ROW][C]31[/C][C]0.116539[/C][C]1.0617[/C][C]0.14572[/C][/ROW]
[ROW][C]32[/C][C]0.012812[/C][C]0.1167[/C][C]0.453681[/C][/ROW]
[ROW][C]33[/C][C]0.090886[/C][C]0.828[/C][C]0.20502[/C][/ROW]
[ROW][C]34[/C][C]-0.039283[/C][C]-0.3579[/C][C]0.36067[/C][/ROW]
[ROW][C]35[/C][C]0.024981[/C][C]0.2276[/C][C]0.410262[/C][/ROW]
[ROW][C]36[/C][C]-0.114437[/C][C]-1.0426[/C][C]0.150088[/C][/ROW]
[ROW][C]37[/C][C]-0.052197[/C][C]-0.4755[/C][C]0.317827[/C][/ROW]
[ROW][C]38[/C][C]-0.06232[/C][C]-0.5678[/C][C]0.285864[/C][/ROW]
[ROW][C]39[/C][C]0.048811[/C][C]0.4447[/C][C]0.328851[/C][/ROW]
[ROW][C]40[/C][C]0.032234[/C][C]0.2937[/C][C]0.384872[/C][/ROW]
[ROW][C]41[/C][C]-0.09583[/C][C]-0.8731[/C][C]0.192577[/C][/ROW]
[ROW][C]42[/C][C]0.039349[/C][C]0.3585[/C][C]0.360446[/C][/ROW]
[ROW][C]43[/C][C]0.049554[/C][C]0.4515[/C][C]0.32642[/C][/ROW]
[ROW][C]44[/C][C]0.096174[/C][C]0.8762[/C][C]0.191729[/C][/ROW]
[ROW][C]45[/C][C]-0.09194[/C][C]-0.8376[/C][C]0.202327[/C][/ROW]
[ROW][C]46[/C][C]-0.04945[/C][C]-0.4505[/C][C]0.326758[/C][/ROW]
[ROW][C]47[/C][C]-0.00014[/C][C]-0.0013[/C][C]0.499493[/C][/ROW]
[ROW][C]48[/C][C]-0.059097[/C][C]-0.5384[/C][C]0.29587[/C][/ROW]
[ROW][C]49[/C][C]0.077206[/C][C]0.7034[/C][C]0.241892[/C][/ROW]
[ROW][C]50[/C][C]0.005428[/C][C]0.0495[/C][C]0.480338[/C][/ROW]
[ROW][C]51[/C][C]-0.049938[/C][C]-0.455[/C][C]0.325164[/C][/ROW]
[ROW][C]52[/C][C]0.063197[/C][C]0.5758[/C][C]0.283169[/C][/ROW]
[ROW][C]53[/C][C]-0.069188[/C][C]-0.6303[/C][C]0.265105[/C][/ROW]
[ROW][C]54[/C][C]-0.089548[/C][C]-0.8158[/C][C]0.20847[/C][/ROW]
[ROW][C]55[/C][C]0.007195[/C][C]0.0656[/C][C]0.473946[/C][/ROW]
[ROW][C]56[/C][C]-0.129769[/C][C]-1.1823[/C][C]0.12024[/C][/ROW]
[ROW][C]57[/C][C]-0.072648[/C][C]-0.6619[/C][C]0.25495[/C][/ROW]
[ROW][C]58[/C][C]-0.0491[/C][C]-0.4473[/C][C]0.327903[/C][/ROW]
[ROW][C]59[/C][C]0.016784[/C][C]0.1529[/C][C]0.439419[/C][/ROW]
[ROW][C]60[/C][C]-0.012941[/C][C]-0.1179[/C][C]0.453218[/C][/ROW]
[/TABLE]
Source: https://freestatistics.org/blog/index.php?pk=30605&T=2

Globally Unique Identifier (entire table): ba.freestatistics.org/blog/index.php?pk=30605&T=2

As an alternative you can also use a QR Code:  

The GUIDs for individual cells are displayed in the table below:

Partial Autocorrelation Function
Time lag kPACF(k)T-STATP-value
1-0.087326-0.79560.214275
20.0737110.67150.251871
3-0.016766-0.15270.439484
40.0354530.3230.373758
5-0.058817-0.53590.296747
60.0330540.30110.382032
7-0.033059-0.30120.382016
8-0.091849-0.83680.202557
9-0.080573-0.73410.232491
100.1434661.3070.097405
11-0.046622-0.42470.336061
120.1065090.97030.167348
130.2177881.98410.025272
140.1660831.51310.067028
15-0.085459-0.77860.219223
16-0.162668-1.4820.071067
170.0266160.24250.404503
18-0.026603-0.24240.404548
19-0.093633-0.8530.198046
20-0.036397-0.33160.370516
21-0.051915-0.4730.318739
22-0.041687-0.37980.352536
230.0316880.28870.386769
240.1778061.61990.054525
25-0.083002-0.75620.225841
26-0.305061-2.77920.003369
270.0878470.80030.212904
28-0.071084-0.64760.259513
290.0164660.150.440559
30-0.040125-0.36560.357813
310.1165391.06170.14572
320.0128120.11670.453681
330.0908860.8280.20502
34-0.039283-0.35790.36067
350.0249810.22760.410262
36-0.114437-1.04260.150088
37-0.052197-0.47550.317827
38-0.06232-0.56780.285864
390.0488110.44470.328851
400.0322340.29370.384872
41-0.09583-0.87310.192577
420.0393490.35850.360446
430.0495540.45150.32642
440.0961740.87620.191729
45-0.09194-0.83760.202327
46-0.04945-0.45050.326758
47-0.00014-0.00130.499493
48-0.059097-0.53840.29587
490.0772060.70340.241892
500.0054280.04950.480338
51-0.049938-0.4550.325164
520.0631970.57580.283169
53-0.069188-0.63030.265105
54-0.089548-0.81580.20847
550.0071950.06560.473946
56-0.129769-1.18230.12024
57-0.072648-0.66190.25495
58-0.0491-0.44730.327903
590.0167840.15290.439419
60-0.012941-0.11790.453218


Parameters (Session):
par1 = 60 ; par2 = 1 ; par3 = 1 ; par4 = 0 ; par5 = 12 ;
Parameters (R input):
par1 = 60 ; par2 = 1 ; par3 = 1 ; par4 = 0 ; par5 = 12 ;
R code (references can be found in the software module):
if (par1 == 'Default') {
par1 = 10*log10(length(x))
} else {
par1 <- as.numeric(par1)
}
par2 <- as.numeric(par2)
par3 <- as.numeric(par3)
par4 <- as.numeric(par4)
par5 <- as.numeric(par5)
if (par2 == 0) {
x <- log(x)
} else {
x <- (x ^ par2 - 1) / par2
}
if (par3 > 0) x <- diff(x,lag=1,difference=par3)
if (par4 > 0) x <- diff(x,lag=par5,difference=par4)
bitmap(file='pic1.png')
racf <- acf(x,par1,main='Autocorrelation',xlab='lags',ylab='ACF')
dev.off()
bitmap(file='pic2.png')
rpacf <- pacf(x,par1,main='Partial Autocorrelation',xlab='lags',ylab='PACF')
dev.off()
(myacf <- c(racf$acf))
(mypacf <- c(rpacf$acf))
lengthx <- length(x)
sqrtn <- sqrt(lengthx)
load(file='createtable')
a<-table.start()
a<-table.row.start(a)
a<-table.element(a,'Autocorrelation Function',4,TRUE)
a<-table.row.end(a)
a<-table.row.start(a)
a<-table.element(a,'Time lag k',header=TRUE)
a<-table.element(a,hyperlink('basics.htm','ACF(k)','click here for more information about the Autocorrelation Function'),header=TRUE)
a<-table.element(a,'T-STAT',header=TRUE)
a<-table.element(a,'P-value',header=TRUE)
a<-table.row.end(a)
for (i in 2:(par1+1)) {
a<-table.row.start(a)
a<-table.element(a,i-1,header=TRUE)
a<-table.element(a,round(myacf[i],6))
mytstat <- myacf[i]*sqrtn
a<-table.element(a,round(mytstat,4))
a<-table.element(a,round(1-pt(abs(mytstat),lengthx),6))
a<-table.row.end(a)
}
a<-table.end(a)
table.save(a,file='mytable.tab')
a<-table.start()
a<-table.row.start(a)
a<-table.element(a,'Partial Autocorrelation Function',4,TRUE)
a<-table.row.end(a)
a<-table.row.start(a)
a<-table.element(a,'Time lag k',header=TRUE)
a<-table.element(a,hyperlink('basics.htm','PACF(k)','click here for more information about the Partial Autocorrelation Function'),header=TRUE)
a<-table.element(a,'T-STAT',header=TRUE)
a<-table.element(a,'P-value',header=TRUE)
a<-table.row.end(a)
for (i in 1:par1) {
a<-table.row.start(a)
a<-table.element(a,i,header=TRUE)
a<-table.element(a,round(mypacf[i],6))
mytstat <- mypacf[i]*sqrtn
a<-table.element(a,round(mytstat,4))
a<-table.element(a,round(1-pt(abs(mytstat),lengthx),6))
a<-table.row.end(a)
}
a<-table.end(a)
table.save(a,file='mytable1.tab')