Free Statistics

of Irreproducible Research!

Author's title

Author*Unverified author*
R Software Modulerwasp_autocorrelation.wasp
Title produced by software(Partial) Autocorrelation Function
Date of computationMon, 08 Dec 2008 10:09:00 -0700
Cite this page as followsStatistical Computations at FreeStatistics.org, Office for Research Development and Education, URL https://freestatistics.org/blog/index.php?v=date/2008/Dec/08/t1228756339n52dfrzu23k5u2i.htm/, Retrieved Thu, 16 May 2024 07:20:05 +0000
Statistical Computations at FreeStatistics.org, Office for Research Development and Education, URL https://freestatistics.org/blog/index.php?pk=30597, Retrieved Thu, 16 May 2024 07:20:05 +0000
QR Codes:

Original text written by user:
IsPrivate?No (this computation is public)
User-defined keywords
Estimated Impact197
Family? (F = Feedback message, R = changed R code, M = changed R Module, P = changed Parameters, D = changed Data)
-     [Univariate Data Series] [data set] [2008-12-01 19:54:57] [b98453cac15ba1066b407e146608df68]
F RMP   [(Partial) Autocorrelation Function] [Taak 10 Stap 4] [2008-12-03 16:24:10] [6fea0e9a9b3b29a63badf2c274e82506]
-   PD    [(Partial) Autocorrelation Function] [Taak 10 Stap 4 Aa...] [2008-12-04 18:42:35] [819b576fab25b35cfda70f80599828ec]
F   P         [(Partial) Autocorrelation Function] [Stap 4] [2008-12-08 17:09:00] [d41d8cd98f00b204e9800998ecf8427e] [Current]
Feedback Forum
2008-12-14 11:25:31 [339a57d8a4d5d113e4804fc423e4a59e] [reply
Student heeft de verkeerde cijfers gebruikt.
2008-12-15 11:25:02 [Lindsay Heyndrickx] [reply
Dit is zeer onvolledig. Hier word niet vermeld waar deze waarden vandaan komen. Hier heeft de student de juiste methode gebruikt maar er staat geen uitleg bij welke waarden hij voor p, q, P en Q gevonden heeft. Het spectrum heeft hij hier niet gebruikt.

Post a new message
Dataseries X:
58.972
59.249
63.955
53.785
52.760
44.795
37.348
32.370
32.717
40.974
33.591
21.124
58.608
46.865
51.378
46.235
47.206
45.382
41.227
33.795
31.295
42.625
33.625
21.538
56.421
53.152
53.536
52.408
41.454
38.271
35.306
26.414
31.917
38.030
27.534
18.387
50.556
43.901
48.572
43.899
37.532
40.357
35.489
29.027
34.485
42.598
30.306
26.451
47.460
50.104
61.465
53.726
39.477
43.895
31.481
29.896
33.842
39.120
33.702
25.094


Summary of computational transaction
Raw Inputview raw input (R code)
Raw Outputview raw output of R engine
Computing time2 seconds
R Server'Sir Ronald Aylmer Fisher' @ 193.190.124.24

\begin{tabular}{lllllllll}
\hline
Summary of computational transaction \tabularnewline
Raw Input & view raw input (R code)  \tabularnewline
Raw Output & view raw output of R engine  \tabularnewline
Computing time & 2 seconds \tabularnewline
R Server & 'Sir Ronald Aylmer Fisher' @ 193.190.124.24 \tabularnewline
\hline
\end{tabular}
%Source: https://freestatistics.org/blog/index.php?pk=30597&T=0

[TABLE]
[ROW][C]Summary of computational transaction[/C][/ROW]
[ROW][C]Raw Input[/C][C]view raw input (R code) [/C][/ROW]
[ROW][C]Raw Output[/C][C]view raw output of R engine [/C][/ROW]
[ROW][C]Computing time[/C][C]2 seconds[/C][/ROW]
[ROW][C]R Server[/C][C]'Sir Ronald Aylmer Fisher' @ 193.190.124.24[/C][/ROW]
[/TABLE]
Source: https://freestatistics.org/blog/index.php?pk=30597&T=0

Globally Unique Identifier (entire table): ba.freestatistics.org/blog/index.php?pk=30597&T=0

As an alternative you can also use a QR Code:  

The GUIDs for individual cells are displayed in the table below:

Summary of computational transaction
Raw Inputview raw input (R code)
Raw Outputview raw output of R engine
Computing time2 seconds
R Server'Sir Ronald Aylmer Fisher' @ 193.190.124.24


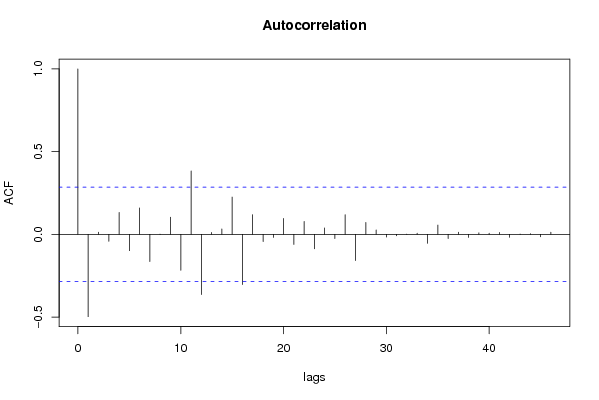
Autocorrelation Function
Time lag kACF(k)T-STATP-value
1-0.497375-3.40980.000672
20.0135550.09290.463178
3-0.041367-0.28360.388982
40.1322070.90640.184683
5-0.098484-0.67520.251437
60.1591881.09130.140344
7-0.163734-1.12250.133675
8-0.001041-0.00710.497167
90.1040570.71340.239569
10-0.216992-1.48760.071765
110.3832082.62710.005795
12-0.364199-2.49680.008047
130.0111320.07630.469745
140.032560.22320.412166
150.2255281.54610.064389
16-0.302837-2.07610.021688
170.1193380.81810.208703
18-0.042936-0.29440.384892
19-0.018365-0.12590.450173
200.0956990.65610.257487
21-0.060518-0.41490.340054
220.0780.53470.297674
23-0.087138-0.59740.276558
240.0384670.26370.396574
25-0.024828-0.17020.432786
260.118440.8120.210448
27-0.158413-1.0860.141504
280.0717780.49210.312475
290.0261110.1790.42935
30-0.015975-0.10950.456628
31-0.008358-0.05730.477275
320.0008020.00550.497817
330.0064970.04450.482331
34-0.053494-0.36670.357731
350.0559360.38350.351548
36-0.024616-0.16880.433355
370.0124440.08530.466189
38-0.018287-0.12540.450382
390.009280.06360.474771
400.0065720.04510.482128
410.0117820.08080.467982
42-0.017338-0.11890.452946
430.0016520.01130.495507
440.0036640.02510.490033
45-0.014616-0.10020.460304
460.0130150.08920.464639
47NANANA
48NANANA
49NANANA
50NANANA
51NANANA
52NANANA
53NANANA
54NANANA
55NANANA
56NANANA
57NANANA
58NANANA
59NANANA
60NANANA

\begin{tabular}{lllllllll}
\hline
Autocorrelation Function \tabularnewline
Time lag k & ACF(k) & T-STAT & P-value \tabularnewline
1 & -0.497375 & -3.4098 & 0.000672 \tabularnewline
2 & 0.013555 & 0.0929 & 0.463178 \tabularnewline
3 & -0.041367 & -0.2836 & 0.388982 \tabularnewline
4 & 0.132207 & 0.9064 & 0.184683 \tabularnewline
5 & -0.098484 & -0.6752 & 0.251437 \tabularnewline
6 & 0.159188 & 1.0913 & 0.140344 \tabularnewline
7 & -0.163734 & -1.1225 & 0.133675 \tabularnewline
8 & -0.001041 & -0.0071 & 0.497167 \tabularnewline
9 & 0.104057 & 0.7134 & 0.239569 \tabularnewline
10 & -0.216992 & -1.4876 & 0.071765 \tabularnewline
11 & 0.383208 & 2.6271 & 0.005795 \tabularnewline
12 & -0.364199 & -2.4968 & 0.008047 \tabularnewline
13 & 0.011132 & 0.0763 & 0.469745 \tabularnewline
14 & 0.03256 & 0.2232 & 0.412166 \tabularnewline
15 & 0.225528 & 1.5461 & 0.064389 \tabularnewline
16 & -0.302837 & -2.0761 & 0.021688 \tabularnewline
17 & 0.119338 & 0.8181 & 0.208703 \tabularnewline
18 & -0.042936 & -0.2944 & 0.384892 \tabularnewline
19 & -0.018365 & -0.1259 & 0.450173 \tabularnewline
20 & 0.095699 & 0.6561 & 0.257487 \tabularnewline
21 & -0.060518 & -0.4149 & 0.340054 \tabularnewline
22 & 0.078 & 0.5347 & 0.297674 \tabularnewline
23 & -0.087138 & -0.5974 & 0.276558 \tabularnewline
24 & 0.038467 & 0.2637 & 0.396574 \tabularnewline
25 & -0.024828 & -0.1702 & 0.432786 \tabularnewline
26 & 0.11844 & 0.812 & 0.210448 \tabularnewline
27 & -0.158413 & -1.086 & 0.141504 \tabularnewline
28 & 0.071778 & 0.4921 & 0.312475 \tabularnewline
29 & 0.026111 & 0.179 & 0.42935 \tabularnewline
30 & -0.015975 & -0.1095 & 0.456628 \tabularnewline
31 & -0.008358 & -0.0573 & 0.477275 \tabularnewline
32 & 0.000802 & 0.0055 & 0.497817 \tabularnewline
33 & 0.006497 & 0.0445 & 0.482331 \tabularnewline
34 & -0.053494 & -0.3667 & 0.357731 \tabularnewline
35 & 0.055936 & 0.3835 & 0.351548 \tabularnewline
36 & -0.024616 & -0.1688 & 0.433355 \tabularnewline
37 & 0.012444 & 0.0853 & 0.466189 \tabularnewline
38 & -0.018287 & -0.1254 & 0.450382 \tabularnewline
39 & 0.00928 & 0.0636 & 0.474771 \tabularnewline
40 & 0.006572 & 0.0451 & 0.482128 \tabularnewline
41 & 0.011782 & 0.0808 & 0.467982 \tabularnewline
42 & -0.017338 & -0.1189 & 0.452946 \tabularnewline
43 & 0.001652 & 0.0113 & 0.495507 \tabularnewline
44 & 0.003664 & 0.0251 & 0.490033 \tabularnewline
45 & -0.014616 & -0.1002 & 0.460304 \tabularnewline
46 & 0.013015 & 0.0892 & 0.464639 \tabularnewline
47 & NA & NA & NA \tabularnewline
48 & NA & NA & NA \tabularnewline
49 & NA & NA & NA \tabularnewline
50 & NA & NA & NA \tabularnewline
51 & NA & NA & NA \tabularnewline
52 & NA & NA & NA \tabularnewline
53 & NA & NA & NA \tabularnewline
54 & NA & NA & NA \tabularnewline
55 & NA & NA & NA \tabularnewline
56 & NA & NA & NA \tabularnewline
57 & NA & NA & NA \tabularnewline
58 & NA & NA & NA \tabularnewline
59 & NA & NA & NA \tabularnewline
60 & NA & NA & NA \tabularnewline
\hline
\end{tabular}
%Source: https://freestatistics.org/blog/index.php?pk=30597&T=1

[TABLE]
[ROW][C]Autocorrelation Function[/C][/ROW]
[ROW][C]Time lag k[/C][C]ACF(k)[/C][C]T-STAT[/C][C]P-value[/C][/ROW]
[ROW][C]1[/C][C]-0.497375[/C][C]-3.4098[/C][C]0.000672[/C][/ROW]
[ROW][C]2[/C][C]0.013555[/C][C]0.0929[/C][C]0.463178[/C][/ROW]
[ROW][C]3[/C][C]-0.041367[/C][C]-0.2836[/C][C]0.388982[/C][/ROW]
[ROW][C]4[/C][C]0.132207[/C][C]0.9064[/C][C]0.184683[/C][/ROW]
[ROW][C]5[/C][C]-0.098484[/C][C]-0.6752[/C][C]0.251437[/C][/ROW]
[ROW][C]6[/C][C]0.159188[/C][C]1.0913[/C][C]0.140344[/C][/ROW]
[ROW][C]7[/C][C]-0.163734[/C][C]-1.1225[/C][C]0.133675[/C][/ROW]
[ROW][C]8[/C][C]-0.001041[/C][C]-0.0071[/C][C]0.497167[/C][/ROW]
[ROW][C]9[/C][C]0.104057[/C][C]0.7134[/C][C]0.239569[/C][/ROW]
[ROW][C]10[/C][C]-0.216992[/C][C]-1.4876[/C][C]0.071765[/C][/ROW]
[ROW][C]11[/C][C]0.383208[/C][C]2.6271[/C][C]0.005795[/C][/ROW]
[ROW][C]12[/C][C]-0.364199[/C][C]-2.4968[/C][C]0.008047[/C][/ROW]
[ROW][C]13[/C][C]0.011132[/C][C]0.0763[/C][C]0.469745[/C][/ROW]
[ROW][C]14[/C][C]0.03256[/C][C]0.2232[/C][C]0.412166[/C][/ROW]
[ROW][C]15[/C][C]0.225528[/C][C]1.5461[/C][C]0.064389[/C][/ROW]
[ROW][C]16[/C][C]-0.302837[/C][C]-2.0761[/C][C]0.021688[/C][/ROW]
[ROW][C]17[/C][C]0.119338[/C][C]0.8181[/C][C]0.208703[/C][/ROW]
[ROW][C]18[/C][C]-0.042936[/C][C]-0.2944[/C][C]0.384892[/C][/ROW]
[ROW][C]19[/C][C]-0.018365[/C][C]-0.1259[/C][C]0.450173[/C][/ROW]
[ROW][C]20[/C][C]0.095699[/C][C]0.6561[/C][C]0.257487[/C][/ROW]
[ROW][C]21[/C][C]-0.060518[/C][C]-0.4149[/C][C]0.340054[/C][/ROW]
[ROW][C]22[/C][C]0.078[/C][C]0.5347[/C][C]0.297674[/C][/ROW]
[ROW][C]23[/C][C]-0.087138[/C][C]-0.5974[/C][C]0.276558[/C][/ROW]
[ROW][C]24[/C][C]0.038467[/C][C]0.2637[/C][C]0.396574[/C][/ROW]
[ROW][C]25[/C][C]-0.024828[/C][C]-0.1702[/C][C]0.432786[/C][/ROW]
[ROW][C]26[/C][C]0.11844[/C][C]0.812[/C][C]0.210448[/C][/ROW]
[ROW][C]27[/C][C]-0.158413[/C][C]-1.086[/C][C]0.141504[/C][/ROW]
[ROW][C]28[/C][C]0.071778[/C][C]0.4921[/C][C]0.312475[/C][/ROW]
[ROW][C]29[/C][C]0.026111[/C][C]0.179[/C][C]0.42935[/C][/ROW]
[ROW][C]30[/C][C]-0.015975[/C][C]-0.1095[/C][C]0.456628[/C][/ROW]
[ROW][C]31[/C][C]-0.008358[/C][C]-0.0573[/C][C]0.477275[/C][/ROW]
[ROW][C]32[/C][C]0.000802[/C][C]0.0055[/C][C]0.497817[/C][/ROW]
[ROW][C]33[/C][C]0.006497[/C][C]0.0445[/C][C]0.482331[/C][/ROW]
[ROW][C]34[/C][C]-0.053494[/C][C]-0.3667[/C][C]0.357731[/C][/ROW]
[ROW][C]35[/C][C]0.055936[/C][C]0.3835[/C][C]0.351548[/C][/ROW]
[ROW][C]36[/C][C]-0.024616[/C][C]-0.1688[/C][C]0.433355[/C][/ROW]
[ROW][C]37[/C][C]0.012444[/C][C]0.0853[/C][C]0.466189[/C][/ROW]
[ROW][C]38[/C][C]-0.018287[/C][C]-0.1254[/C][C]0.450382[/C][/ROW]
[ROW][C]39[/C][C]0.00928[/C][C]0.0636[/C][C]0.474771[/C][/ROW]
[ROW][C]40[/C][C]0.006572[/C][C]0.0451[/C][C]0.482128[/C][/ROW]
[ROW][C]41[/C][C]0.011782[/C][C]0.0808[/C][C]0.467982[/C][/ROW]
[ROW][C]42[/C][C]-0.017338[/C][C]-0.1189[/C][C]0.452946[/C][/ROW]
[ROW][C]43[/C][C]0.001652[/C][C]0.0113[/C][C]0.495507[/C][/ROW]
[ROW][C]44[/C][C]0.003664[/C][C]0.0251[/C][C]0.490033[/C][/ROW]
[ROW][C]45[/C][C]-0.014616[/C][C]-0.1002[/C][C]0.460304[/C][/ROW]
[ROW][C]46[/C][C]0.013015[/C][C]0.0892[/C][C]0.464639[/C][/ROW]
[ROW][C]47[/C][C]NA[/C][C]NA[/C][C]NA[/C][/ROW]
[ROW][C]48[/C][C]NA[/C][C]NA[/C][C]NA[/C][/ROW]
[ROW][C]49[/C][C]NA[/C][C]NA[/C][C]NA[/C][/ROW]
[ROW][C]50[/C][C]NA[/C][C]NA[/C][C]NA[/C][/ROW]
[ROW][C]51[/C][C]NA[/C][C]NA[/C][C]NA[/C][/ROW]
[ROW][C]52[/C][C]NA[/C][C]NA[/C][C]NA[/C][/ROW]
[ROW][C]53[/C][C]NA[/C][C]NA[/C][C]NA[/C][/ROW]
[ROW][C]54[/C][C]NA[/C][C]NA[/C][C]NA[/C][/ROW]
[ROW][C]55[/C][C]NA[/C][C]NA[/C][C]NA[/C][/ROW]
[ROW][C]56[/C][C]NA[/C][C]NA[/C][C]NA[/C][/ROW]
[ROW][C]57[/C][C]NA[/C][C]NA[/C][C]NA[/C][/ROW]
[ROW][C]58[/C][C]NA[/C][C]NA[/C][C]NA[/C][/ROW]
[ROW][C]59[/C][C]NA[/C][C]NA[/C][C]NA[/C][/ROW]
[ROW][C]60[/C][C]NA[/C][C]NA[/C][C]NA[/C][/ROW]
[/TABLE]
Source: https://freestatistics.org/blog/index.php?pk=30597&T=1

Globally Unique Identifier (entire table): ba.freestatistics.org/blog/index.php?pk=30597&T=1

As an alternative you can also use a QR Code:  

The GUIDs for individual cells are displayed in the table below:

Autocorrelation Function
Time lag kACF(k)T-STATP-value
1-0.497375-3.40980.000672
20.0135550.09290.463178
3-0.041367-0.28360.388982
40.1322070.90640.184683
5-0.098484-0.67520.251437
60.1591881.09130.140344
7-0.163734-1.12250.133675
8-0.001041-0.00710.497167
90.1040570.71340.239569
10-0.216992-1.48760.071765
110.3832082.62710.005795
12-0.364199-2.49680.008047
130.0111320.07630.469745
140.032560.22320.412166
150.2255281.54610.064389
16-0.302837-2.07610.021688
170.1193380.81810.208703
18-0.042936-0.29440.384892
19-0.018365-0.12590.450173
200.0956990.65610.257487
21-0.060518-0.41490.340054
220.0780.53470.297674
23-0.087138-0.59740.276558
240.0384670.26370.396574
25-0.024828-0.17020.432786
260.118440.8120.210448
27-0.158413-1.0860.141504
280.0717780.49210.312475
290.0261110.1790.42935
30-0.015975-0.10950.456628
31-0.008358-0.05730.477275
320.0008020.00550.497817
330.0064970.04450.482331
34-0.053494-0.36670.357731
350.0559360.38350.351548
36-0.024616-0.16880.433355
370.0124440.08530.466189
38-0.018287-0.12540.450382
390.009280.06360.474771
400.0065720.04510.482128
410.0117820.08080.467982
42-0.017338-0.11890.452946
430.0016520.01130.495507
440.0036640.02510.490033
45-0.014616-0.10020.460304
460.0130150.08920.464639
47NANANA
48NANANA
49NANANA
50NANANA
51NANANA
52NANANA
53NANANA
54NANANA
55NANANA
56NANANA
57NANANA
58NANANA
59NANANA
60NANANA


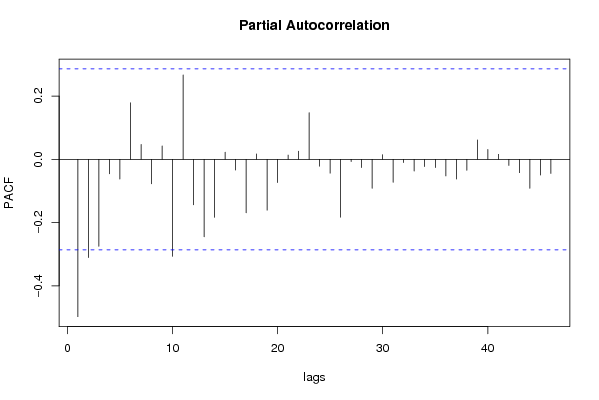
Partial Autocorrelation Function
Time lag kPACF(k)T-STATP-value
1-0.497375-3.40980.000672
2-0.310685-2.12990.019221
3-0.275096-1.8860.032744
4-0.045313-0.31060.378721
5-0.062013-0.42510.336338
60.1786751.22490.113352
70.0472230.32370.373784
8-0.076925-0.52740.300208
90.0421290.28880.386993
10-0.306217-2.09930.020593
110.2668251.82930.036854
12-0.143468-0.98360.165182
13-0.245023-1.67980.049817
14-0.183321-1.25680.107521
150.0223310.15310.43949
16-0.034034-0.23330.408262
17-0.168871-1.15770.126414
180.0168630.11560.454229
19-0.160681-1.10160.138129
20-0.073125-0.50130.309242
210.0133950.09180.46361
220.0256550.17590.430572
230.1474891.01110.158564
24-0.021458-0.14710.441837
25-0.043672-0.29940.382978
26-0.182846-1.25350.108107
27-0.006665-0.04570.481874
28-0.025914-0.17770.429877
29-0.091665-0.62840.266385
300.0145880.10.460381
31-0.072477-0.49690.310796
32-0.009884-0.06780.47313
33-0.036848-0.25260.400832
34-0.022782-0.15620.438277
35-0.025786-0.17680.43022
36-0.052248-0.35820.360901
37-0.061909-0.42440.336596
38-0.034732-0.23810.406416
390.0613480.42060.33799
400.0315240.21610.414917
410.015860.10870.45694
42-0.019029-0.13050.448381
43-0.042098-0.28860.387075
44-0.091213-0.62530.267392
45-0.049252-0.33770.368565
46-0.044373-0.30420.381156
47NANANA
48NANANA
49NANANA
50NANANA
51NANANA
52NANANA
53NANANA
54NANANA
55NANANA
56NANANA
57NANANA
58NANANA
59NANANA
60NANANA

\begin{tabular}{lllllllll}
\hline
Partial Autocorrelation Function \tabularnewline
Time lag k & PACF(k) & T-STAT & P-value \tabularnewline
1 & -0.497375 & -3.4098 & 0.000672 \tabularnewline
2 & -0.310685 & -2.1299 & 0.019221 \tabularnewline
3 & -0.275096 & -1.886 & 0.032744 \tabularnewline
4 & -0.045313 & -0.3106 & 0.378721 \tabularnewline
5 & -0.062013 & -0.4251 & 0.336338 \tabularnewline
6 & 0.178675 & 1.2249 & 0.113352 \tabularnewline
7 & 0.047223 & 0.3237 & 0.373784 \tabularnewline
8 & -0.076925 & -0.5274 & 0.300208 \tabularnewline
9 & 0.042129 & 0.2888 & 0.386993 \tabularnewline
10 & -0.306217 & -2.0993 & 0.020593 \tabularnewline
11 & 0.266825 & 1.8293 & 0.036854 \tabularnewline
12 & -0.143468 & -0.9836 & 0.165182 \tabularnewline
13 & -0.245023 & -1.6798 & 0.049817 \tabularnewline
14 & -0.183321 & -1.2568 & 0.107521 \tabularnewline
15 & 0.022331 & 0.1531 & 0.43949 \tabularnewline
16 & -0.034034 & -0.2333 & 0.408262 \tabularnewline
17 & -0.168871 & -1.1577 & 0.126414 \tabularnewline
18 & 0.016863 & 0.1156 & 0.454229 \tabularnewline
19 & -0.160681 & -1.1016 & 0.138129 \tabularnewline
20 & -0.073125 & -0.5013 & 0.309242 \tabularnewline
21 & 0.013395 & 0.0918 & 0.46361 \tabularnewline
22 & 0.025655 & 0.1759 & 0.430572 \tabularnewline
23 & 0.147489 & 1.0111 & 0.158564 \tabularnewline
24 & -0.021458 & -0.1471 & 0.441837 \tabularnewline
25 & -0.043672 & -0.2994 & 0.382978 \tabularnewline
26 & -0.182846 & -1.2535 & 0.108107 \tabularnewline
27 & -0.006665 & -0.0457 & 0.481874 \tabularnewline
28 & -0.025914 & -0.1777 & 0.429877 \tabularnewline
29 & -0.091665 & -0.6284 & 0.266385 \tabularnewline
30 & 0.014588 & 0.1 & 0.460381 \tabularnewline
31 & -0.072477 & -0.4969 & 0.310796 \tabularnewline
32 & -0.009884 & -0.0678 & 0.47313 \tabularnewline
33 & -0.036848 & -0.2526 & 0.400832 \tabularnewline
34 & -0.022782 & -0.1562 & 0.438277 \tabularnewline
35 & -0.025786 & -0.1768 & 0.43022 \tabularnewline
36 & -0.052248 & -0.3582 & 0.360901 \tabularnewline
37 & -0.061909 & -0.4244 & 0.336596 \tabularnewline
38 & -0.034732 & -0.2381 & 0.406416 \tabularnewline
39 & 0.061348 & 0.4206 & 0.33799 \tabularnewline
40 & 0.031524 & 0.2161 & 0.414917 \tabularnewline
41 & 0.01586 & 0.1087 & 0.45694 \tabularnewline
42 & -0.019029 & -0.1305 & 0.448381 \tabularnewline
43 & -0.042098 & -0.2886 & 0.387075 \tabularnewline
44 & -0.091213 & -0.6253 & 0.267392 \tabularnewline
45 & -0.049252 & -0.3377 & 0.368565 \tabularnewline
46 & -0.044373 & -0.3042 & 0.381156 \tabularnewline
47 & NA & NA & NA \tabularnewline
48 & NA & NA & NA \tabularnewline
49 & NA & NA & NA \tabularnewline
50 & NA & NA & NA \tabularnewline
51 & NA & NA & NA \tabularnewline
52 & NA & NA & NA \tabularnewline
53 & NA & NA & NA \tabularnewline
54 & NA & NA & NA \tabularnewline
55 & NA & NA & NA \tabularnewline
56 & NA & NA & NA \tabularnewline
57 & NA & NA & NA \tabularnewline
58 & NA & NA & NA \tabularnewline
59 & NA & NA & NA \tabularnewline
60 & NA & NA & NA \tabularnewline
\hline
\end{tabular}
%Source: https://freestatistics.org/blog/index.php?pk=30597&T=2

[TABLE]
[ROW][C]Partial Autocorrelation Function[/C][/ROW]
[ROW][C]Time lag k[/C][C]PACF(k)[/C][C]T-STAT[/C][C]P-value[/C][/ROW]
[ROW][C]1[/C][C]-0.497375[/C][C]-3.4098[/C][C]0.000672[/C][/ROW]
[ROW][C]2[/C][C]-0.310685[/C][C]-2.1299[/C][C]0.019221[/C][/ROW]
[ROW][C]3[/C][C]-0.275096[/C][C]-1.886[/C][C]0.032744[/C][/ROW]
[ROW][C]4[/C][C]-0.045313[/C][C]-0.3106[/C][C]0.378721[/C][/ROW]
[ROW][C]5[/C][C]-0.062013[/C][C]-0.4251[/C][C]0.336338[/C][/ROW]
[ROW][C]6[/C][C]0.178675[/C][C]1.2249[/C][C]0.113352[/C][/ROW]
[ROW][C]7[/C][C]0.047223[/C][C]0.3237[/C][C]0.373784[/C][/ROW]
[ROW][C]8[/C][C]-0.076925[/C][C]-0.5274[/C][C]0.300208[/C][/ROW]
[ROW][C]9[/C][C]0.042129[/C][C]0.2888[/C][C]0.386993[/C][/ROW]
[ROW][C]10[/C][C]-0.306217[/C][C]-2.0993[/C][C]0.020593[/C][/ROW]
[ROW][C]11[/C][C]0.266825[/C][C]1.8293[/C][C]0.036854[/C][/ROW]
[ROW][C]12[/C][C]-0.143468[/C][C]-0.9836[/C][C]0.165182[/C][/ROW]
[ROW][C]13[/C][C]-0.245023[/C][C]-1.6798[/C][C]0.049817[/C][/ROW]
[ROW][C]14[/C][C]-0.183321[/C][C]-1.2568[/C][C]0.107521[/C][/ROW]
[ROW][C]15[/C][C]0.022331[/C][C]0.1531[/C][C]0.43949[/C][/ROW]
[ROW][C]16[/C][C]-0.034034[/C][C]-0.2333[/C][C]0.408262[/C][/ROW]
[ROW][C]17[/C][C]-0.168871[/C][C]-1.1577[/C][C]0.126414[/C][/ROW]
[ROW][C]18[/C][C]0.016863[/C][C]0.1156[/C][C]0.454229[/C][/ROW]
[ROW][C]19[/C][C]-0.160681[/C][C]-1.1016[/C][C]0.138129[/C][/ROW]
[ROW][C]20[/C][C]-0.073125[/C][C]-0.5013[/C][C]0.309242[/C][/ROW]
[ROW][C]21[/C][C]0.013395[/C][C]0.0918[/C][C]0.46361[/C][/ROW]
[ROW][C]22[/C][C]0.025655[/C][C]0.1759[/C][C]0.430572[/C][/ROW]
[ROW][C]23[/C][C]0.147489[/C][C]1.0111[/C][C]0.158564[/C][/ROW]
[ROW][C]24[/C][C]-0.021458[/C][C]-0.1471[/C][C]0.441837[/C][/ROW]
[ROW][C]25[/C][C]-0.043672[/C][C]-0.2994[/C][C]0.382978[/C][/ROW]
[ROW][C]26[/C][C]-0.182846[/C][C]-1.2535[/C][C]0.108107[/C][/ROW]
[ROW][C]27[/C][C]-0.006665[/C][C]-0.0457[/C][C]0.481874[/C][/ROW]
[ROW][C]28[/C][C]-0.025914[/C][C]-0.1777[/C][C]0.429877[/C][/ROW]
[ROW][C]29[/C][C]-0.091665[/C][C]-0.6284[/C][C]0.266385[/C][/ROW]
[ROW][C]30[/C][C]0.014588[/C][C]0.1[/C][C]0.460381[/C][/ROW]
[ROW][C]31[/C][C]-0.072477[/C][C]-0.4969[/C][C]0.310796[/C][/ROW]
[ROW][C]32[/C][C]-0.009884[/C][C]-0.0678[/C][C]0.47313[/C][/ROW]
[ROW][C]33[/C][C]-0.036848[/C][C]-0.2526[/C][C]0.400832[/C][/ROW]
[ROW][C]34[/C][C]-0.022782[/C][C]-0.1562[/C][C]0.438277[/C][/ROW]
[ROW][C]35[/C][C]-0.025786[/C][C]-0.1768[/C][C]0.43022[/C][/ROW]
[ROW][C]36[/C][C]-0.052248[/C][C]-0.3582[/C][C]0.360901[/C][/ROW]
[ROW][C]37[/C][C]-0.061909[/C][C]-0.4244[/C][C]0.336596[/C][/ROW]
[ROW][C]38[/C][C]-0.034732[/C][C]-0.2381[/C][C]0.406416[/C][/ROW]
[ROW][C]39[/C][C]0.061348[/C][C]0.4206[/C][C]0.33799[/C][/ROW]
[ROW][C]40[/C][C]0.031524[/C][C]0.2161[/C][C]0.414917[/C][/ROW]
[ROW][C]41[/C][C]0.01586[/C][C]0.1087[/C][C]0.45694[/C][/ROW]
[ROW][C]42[/C][C]-0.019029[/C][C]-0.1305[/C][C]0.448381[/C][/ROW]
[ROW][C]43[/C][C]-0.042098[/C][C]-0.2886[/C][C]0.387075[/C][/ROW]
[ROW][C]44[/C][C]-0.091213[/C][C]-0.6253[/C][C]0.267392[/C][/ROW]
[ROW][C]45[/C][C]-0.049252[/C][C]-0.3377[/C][C]0.368565[/C][/ROW]
[ROW][C]46[/C][C]-0.044373[/C][C]-0.3042[/C][C]0.381156[/C][/ROW]
[ROW][C]47[/C][C]NA[/C][C]NA[/C][C]NA[/C][/ROW]
[ROW][C]48[/C][C]NA[/C][C]NA[/C][C]NA[/C][/ROW]
[ROW][C]49[/C][C]NA[/C][C]NA[/C][C]NA[/C][/ROW]
[ROW][C]50[/C][C]NA[/C][C]NA[/C][C]NA[/C][/ROW]
[ROW][C]51[/C][C]NA[/C][C]NA[/C][C]NA[/C][/ROW]
[ROW][C]52[/C][C]NA[/C][C]NA[/C][C]NA[/C][/ROW]
[ROW][C]53[/C][C]NA[/C][C]NA[/C][C]NA[/C][/ROW]
[ROW][C]54[/C][C]NA[/C][C]NA[/C][C]NA[/C][/ROW]
[ROW][C]55[/C][C]NA[/C][C]NA[/C][C]NA[/C][/ROW]
[ROW][C]56[/C][C]NA[/C][C]NA[/C][C]NA[/C][/ROW]
[ROW][C]57[/C][C]NA[/C][C]NA[/C][C]NA[/C][/ROW]
[ROW][C]58[/C][C]NA[/C][C]NA[/C][C]NA[/C][/ROW]
[ROW][C]59[/C][C]NA[/C][C]NA[/C][C]NA[/C][/ROW]
[ROW][C]60[/C][C]NA[/C][C]NA[/C][C]NA[/C][/ROW]
[/TABLE]
Source: https://freestatistics.org/blog/index.php?pk=30597&T=2

Globally Unique Identifier (entire table): ba.freestatistics.org/blog/index.php?pk=30597&T=2

As an alternative you can also use a QR Code:  

The GUIDs for individual cells are displayed in the table below:

Partial Autocorrelation Function
Time lag kPACF(k)T-STATP-value
1-0.497375-3.40980.000672
2-0.310685-2.12990.019221
3-0.275096-1.8860.032744
4-0.045313-0.31060.378721
5-0.062013-0.42510.336338
60.1786751.22490.113352
70.0472230.32370.373784
8-0.076925-0.52740.300208
90.0421290.28880.386993
10-0.306217-2.09930.020593
110.2668251.82930.036854
12-0.143468-0.98360.165182
13-0.245023-1.67980.049817
14-0.183321-1.25680.107521
150.0223310.15310.43949
16-0.034034-0.23330.408262
17-0.168871-1.15770.126414
180.0168630.11560.454229
19-0.160681-1.10160.138129
20-0.073125-0.50130.309242
210.0133950.09180.46361
220.0256550.17590.430572
230.1474891.01110.158564
24-0.021458-0.14710.441837
25-0.043672-0.29940.382978
26-0.182846-1.25350.108107
27-0.006665-0.04570.481874
28-0.025914-0.17770.429877
29-0.091665-0.62840.266385
300.0145880.10.460381
31-0.072477-0.49690.310796
32-0.009884-0.06780.47313
33-0.036848-0.25260.400832
34-0.022782-0.15620.438277
35-0.025786-0.17680.43022
36-0.052248-0.35820.360901
37-0.061909-0.42440.336596
38-0.034732-0.23810.406416
390.0613480.42060.33799
400.0315240.21610.414917
410.015860.10870.45694
42-0.019029-0.13050.448381
43-0.042098-0.28860.387075
44-0.091213-0.62530.267392
45-0.049252-0.33770.368565
46-0.044373-0.30420.381156
47NANANA
48NANANA
49NANANA
50NANANA
51NANANA
52NANANA
53NANANA
54NANANA
55NANANA
56NANANA
57NANANA
58NANANA
59NANANA
60NANANA


Parameters (Session):
par1 = 60 ; par2 = -1.7 ; par3 = 1 ; par4 = 1 ; par5 = 12 ;
Parameters (R input):
par1 = 60 ; par2 = -1.7 ; par3 = 1 ; par4 = 1 ; par5 = 12 ;
R code (references can be found in the software module):
if (par1 == 'Default') {
par1 = 10*log10(length(x))
} else {
par1 <- as.numeric(par1)
}
par2 <- as.numeric(par2)
par3 <- as.numeric(par3)
par4 <- as.numeric(par4)
par5 <- as.numeric(par5)
if (par2 == 0) {
x <- log(x)
} else {
x <- (x ^ par2 - 1) / par2
}
if (par3 > 0) x <- diff(x,lag=1,difference=par3)
if (par4 > 0) x <- diff(x,lag=par5,difference=par4)
bitmap(file='pic1.png')
racf <- acf(x,par1,main='Autocorrelation',xlab='lags',ylab='ACF')
dev.off()
bitmap(file='pic2.png')
rpacf <- pacf(x,par1,main='Partial Autocorrelation',xlab='lags',ylab='PACF')
dev.off()
(myacf <- c(racf$acf))
(mypacf <- c(rpacf$acf))
lengthx <- length(x)
sqrtn <- sqrt(lengthx)
load(file='createtable')
a<-table.start()
a<-table.row.start(a)
a<-table.element(a,'Autocorrelation Function',4,TRUE)
a<-table.row.end(a)
a<-table.row.start(a)
a<-table.element(a,'Time lag k',header=TRUE)
a<-table.element(a,hyperlink('basics.htm','ACF(k)','click here for more information about the Autocorrelation Function'),header=TRUE)
a<-table.element(a,'T-STAT',header=TRUE)
a<-table.element(a,'P-value',header=TRUE)
a<-table.row.end(a)
for (i in 2:(par1+1)) {
a<-table.row.start(a)
a<-table.element(a,i-1,header=TRUE)
a<-table.element(a,round(myacf[i],6))
mytstat <- myacf[i]*sqrtn
a<-table.element(a,round(mytstat,4))
a<-table.element(a,round(1-pt(abs(mytstat),lengthx),6))
a<-table.row.end(a)
}
a<-table.end(a)
table.save(a,file='mytable.tab')
a<-table.start()
a<-table.row.start(a)
a<-table.element(a,'Partial Autocorrelation Function',4,TRUE)
a<-table.row.end(a)
a<-table.row.start(a)
a<-table.element(a,'Time lag k',header=TRUE)
a<-table.element(a,hyperlink('basics.htm','PACF(k)','click here for more information about the Partial Autocorrelation Function'),header=TRUE)
a<-table.element(a,'T-STAT',header=TRUE)
a<-table.element(a,'P-value',header=TRUE)
a<-table.row.end(a)
for (i in 1:par1) {
a<-table.row.start(a)
a<-table.element(a,i,header=TRUE)
a<-table.element(a,round(mypacf[i],6))
mytstat <- mypacf[i]*sqrtn
a<-table.element(a,round(mytstat,4))
a<-table.element(a,round(1-pt(abs(mytstat),lengthx),6))
a<-table.row.end(a)
}
a<-table.end(a)
table.save(a,file='mytable1.tab')