Free Statistics

of Irreproducible Research!

Author's title

Author*Unverified author*
R Software Modulerwasp_autocorrelation.wasp
Title produced by software(Partial) Autocorrelation Function
Date of computationMon, 08 Dec 2008 10:05:27 -0700
Cite this page as followsStatistical Computations at FreeStatistics.org, Office for Research Development and Education, URL https://freestatistics.org/blog/index.php?v=date/2008/Dec/08/t1228755970xtdv3uaut4q9xjy.htm/, Retrieved Thu, 16 May 2024 06:59:54 +0000
Statistical Computations at FreeStatistics.org, Office for Research Development and Education, URL https://freestatistics.org/blog/index.php?pk=30593, Retrieved Thu, 16 May 2024 06:59:54 +0000
QR Codes:

Original text written by user:
IsPrivate?No (this computation is public)
User-defined keywords
Estimated Impact139
Family? (F = Feedback message, R = changed R code, M = changed R Module, P = changed Parameters, D = changed Data)
-       [(Partial) Autocorrelation Function] [Opdracht 6 bis_Oe...] [2008-12-08 17:05:27] [6d98ada03a80a9e76b95c3980f5f0dfc] [Current]
Feedback Forum

Post a new message
Dataseries X:
0.60773
0.58933
0.60039
0.61342
0.6348
0.634
0.62915
0.62168
0.61328
0.6089
0.60857
0.62672
0.62291
0.62393
0.61838
0.62012
0.61659
0.6116
0.61573
0.61407
0.62823
0.64405
0.6387
0.63633
0.63059
0.62994
0.63709
0.64217
0.65711
0.66977
0.68255
0.68902
0.71322
0.70224
0.70045
0.69919
0.69693
0.69763
0.69278
0.70196
0.69215
0.6769
0.67124
0.66532
0.67157
0.66428
0.66576
0.66942
0.6813
0.69144
0.69862
0.695
0.69867
0.68968
0.69233
0.68293
0.68399
0.66895
0.68756
0.68527
0.6776
0.68137
0.67933
0.67922
0.68598
0.68297
0.68935
0.69463
0.6833
0.68666
0.68782
0.67669
0.67511
0.67254
0.67397
0.67286
0.66341
0.668
0.68021
0.67934
0.68136
0.67562
0.6744
0.67766
0.68887
0.69614
0.70896
0.72064


Summary of computational transaction
Raw Inputview raw input (R code)
Raw Outputview raw output of R engine
Computing time1 seconds
R Server'George Udny Yule' @ 72.249.76.132

\begin{tabular}{lllllllll}
\hline
Summary of computational transaction \tabularnewline
Raw Input & view raw input (R code)  \tabularnewline
Raw Output & view raw output of R engine  \tabularnewline
Computing time & 1 seconds \tabularnewline
R Server & 'George Udny Yule' @ 72.249.76.132 \tabularnewline
\hline
\end{tabular}
%Source: https://freestatistics.org/blog/index.php?pk=30593&T=0

[TABLE]
[ROW][C]Summary of computational transaction[/C][/ROW]
[ROW][C]Raw Input[/C][C]view raw input (R code) [/C][/ROW]
[ROW][C]Raw Output[/C][C]view raw output of R engine [/C][/ROW]
[ROW][C]Computing time[/C][C]1 seconds[/C][/ROW]
[ROW][C]R Server[/C][C]'George Udny Yule' @ 72.249.76.132[/C][/ROW]
[/TABLE]
Source: https://freestatistics.org/blog/index.php?pk=30593&T=0

Globally Unique Identifier (entire table): ba.freestatistics.org/blog/index.php?pk=30593&T=0

As an alternative you can also use a QR Code:  

The GUIDs for individual cells are displayed in the table below:

Summary of computational transaction
Raw Inputview raw input (R code)
Raw Outputview raw output of R engine
Computing time1 seconds
R Server'George Udny Yule' @ 72.249.76.132


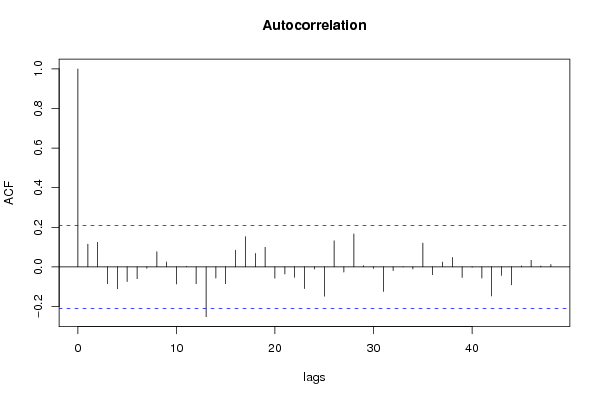
Autocorrelation Function
Time lag kACF(k)T-STATP-value
10.114811.07090.143594
20.1238061.15480.12567
3-0.085988-0.8020.212357
4-0.111271-1.03790.151103
5-0.074638-0.69620.244087
6-0.0598-0.55780.289215
7-0.006615-0.06170.47547
80.0765440.7140.238584
90.0250690.23380.407834
10-0.086647-0.80820.210592
110.0019770.01840.492664
12-0.085058-0.79340.214862
13-0.251698-2.34770.01058
14-0.056459-0.52660.299899
15-0.085033-0.79310.214929
160.08390.78260.218002
170.152461.4220.079294
180.0680420.63460.263661
190.0987280.92090.179833
20-0.057499-0.53630.296555
21-0.035882-0.33470.369334
22-0.053098-0.49530.310832
23-0.109671-1.02290.154585
24-0.011424-0.10660.457695
25-0.148284-1.38310.085087
260.1315231.22680.111611
27-0.026656-0.24860.402117
280.1664291.55230.062105
290.0058750.05480.478213
30-0.008349-0.07790.469052
31-0.124036-1.15690.125234
32-0.018784-0.17520.430662
330.0007040.00660.497389
34-0.010347-0.09650.461668
350.1198971.11830.133253
36-0.039775-0.3710.35577
370.0240470.22430.411528
380.0473520.44170.329911
39-0.053722-0.50110.308789
40-0.001939-0.01810.492805
41-0.056953-0.53120.298308
42-0.147147-1.37250.086719
43-0.043369-0.40450.343412
44-0.091116-0.84990.198865
450.0042880.040.484093
460.0333130.31070.378375
470.0040580.03790.484947
480.0114920.10720.457442

\begin{tabular}{lllllllll}
\hline
Autocorrelation Function \tabularnewline
Time lag k & ACF(k) & T-STAT & P-value \tabularnewline
1 & 0.11481 & 1.0709 & 0.143594 \tabularnewline
2 & 0.123806 & 1.1548 & 0.12567 \tabularnewline
3 & -0.085988 & -0.802 & 0.212357 \tabularnewline
4 & -0.111271 & -1.0379 & 0.151103 \tabularnewline
5 & -0.074638 & -0.6962 & 0.244087 \tabularnewline
6 & -0.0598 & -0.5578 & 0.289215 \tabularnewline
7 & -0.006615 & -0.0617 & 0.47547 \tabularnewline
8 & 0.076544 & 0.714 & 0.238584 \tabularnewline
9 & 0.025069 & 0.2338 & 0.407834 \tabularnewline
10 & -0.086647 & -0.8082 & 0.210592 \tabularnewline
11 & 0.001977 & 0.0184 & 0.492664 \tabularnewline
12 & -0.085058 & -0.7934 & 0.214862 \tabularnewline
13 & -0.251698 & -2.3477 & 0.01058 \tabularnewline
14 & -0.056459 & -0.5266 & 0.299899 \tabularnewline
15 & -0.085033 & -0.7931 & 0.214929 \tabularnewline
16 & 0.0839 & 0.7826 & 0.218002 \tabularnewline
17 & 0.15246 & 1.422 & 0.079294 \tabularnewline
18 & 0.068042 & 0.6346 & 0.263661 \tabularnewline
19 & 0.098728 & 0.9209 & 0.179833 \tabularnewline
20 & -0.057499 & -0.5363 & 0.296555 \tabularnewline
21 & -0.035882 & -0.3347 & 0.369334 \tabularnewline
22 & -0.053098 & -0.4953 & 0.310832 \tabularnewline
23 & -0.109671 & -1.0229 & 0.154585 \tabularnewline
24 & -0.011424 & -0.1066 & 0.457695 \tabularnewline
25 & -0.148284 & -1.3831 & 0.085087 \tabularnewline
26 & 0.131523 & 1.2268 & 0.111611 \tabularnewline
27 & -0.026656 & -0.2486 & 0.402117 \tabularnewline
28 & 0.166429 & 1.5523 & 0.062105 \tabularnewline
29 & 0.005875 & 0.0548 & 0.478213 \tabularnewline
30 & -0.008349 & -0.0779 & 0.469052 \tabularnewline
31 & -0.124036 & -1.1569 & 0.125234 \tabularnewline
32 & -0.018784 & -0.1752 & 0.430662 \tabularnewline
33 & 0.000704 & 0.0066 & 0.497389 \tabularnewline
34 & -0.010347 & -0.0965 & 0.461668 \tabularnewline
35 & 0.119897 & 1.1183 & 0.133253 \tabularnewline
36 & -0.039775 & -0.371 & 0.35577 \tabularnewline
37 & 0.024047 & 0.2243 & 0.411528 \tabularnewline
38 & 0.047352 & 0.4417 & 0.329911 \tabularnewline
39 & -0.053722 & -0.5011 & 0.308789 \tabularnewline
40 & -0.001939 & -0.0181 & 0.492805 \tabularnewline
41 & -0.056953 & -0.5312 & 0.298308 \tabularnewline
42 & -0.147147 & -1.3725 & 0.086719 \tabularnewline
43 & -0.043369 & -0.4045 & 0.343412 \tabularnewline
44 & -0.091116 & -0.8499 & 0.198865 \tabularnewline
45 & 0.004288 & 0.04 & 0.484093 \tabularnewline
46 & 0.033313 & 0.3107 & 0.378375 \tabularnewline
47 & 0.004058 & 0.0379 & 0.484947 \tabularnewline
48 & 0.011492 & 0.1072 & 0.457442 \tabularnewline
\hline
\end{tabular}
%Source: https://freestatistics.org/blog/index.php?pk=30593&T=1

[TABLE]
[ROW][C]Autocorrelation Function[/C][/ROW]
[ROW][C]Time lag k[/C][C]ACF(k)[/C][C]T-STAT[/C][C]P-value[/C][/ROW]
[ROW][C]1[/C][C]0.11481[/C][C]1.0709[/C][C]0.143594[/C][/ROW]
[ROW][C]2[/C][C]0.123806[/C][C]1.1548[/C][C]0.12567[/C][/ROW]
[ROW][C]3[/C][C]-0.085988[/C][C]-0.802[/C][C]0.212357[/C][/ROW]
[ROW][C]4[/C][C]-0.111271[/C][C]-1.0379[/C][C]0.151103[/C][/ROW]
[ROW][C]5[/C][C]-0.074638[/C][C]-0.6962[/C][C]0.244087[/C][/ROW]
[ROW][C]6[/C][C]-0.0598[/C][C]-0.5578[/C][C]0.289215[/C][/ROW]
[ROW][C]7[/C][C]-0.006615[/C][C]-0.0617[/C][C]0.47547[/C][/ROW]
[ROW][C]8[/C][C]0.076544[/C][C]0.714[/C][C]0.238584[/C][/ROW]
[ROW][C]9[/C][C]0.025069[/C][C]0.2338[/C][C]0.407834[/C][/ROW]
[ROW][C]10[/C][C]-0.086647[/C][C]-0.8082[/C][C]0.210592[/C][/ROW]
[ROW][C]11[/C][C]0.001977[/C][C]0.0184[/C][C]0.492664[/C][/ROW]
[ROW][C]12[/C][C]-0.085058[/C][C]-0.7934[/C][C]0.214862[/C][/ROW]
[ROW][C]13[/C][C]-0.251698[/C][C]-2.3477[/C][C]0.01058[/C][/ROW]
[ROW][C]14[/C][C]-0.056459[/C][C]-0.5266[/C][C]0.299899[/C][/ROW]
[ROW][C]15[/C][C]-0.085033[/C][C]-0.7931[/C][C]0.214929[/C][/ROW]
[ROW][C]16[/C][C]0.0839[/C][C]0.7826[/C][C]0.218002[/C][/ROW]
[ROW][C]17[/C][C]0.15246[/C][C]1.422[/C][C]0.079294[/C][/ROW]
[ROW][C]18[/C][C]0.068042[/C][C]0.6346[/C][C]0.263661[/C][/ROW]
[ROW][C]19[/C][C]0.098728[/C][C]0.9209[/C][C]0.179833[/C][/ROW]
[ROW][C]20[/C][C]-0.057499[/C][C]-0.5363[/C][C]0.296555[/C][/ROW]
[ROW][C]21[/C][C]-0.035882[/C][C]-0.3347[/C][C]0.369334[/C][/ROW]
[ROW][C]22[/C][C]-0.053098[/C][C]-0.4953[/C][C]0.310832[/C][/ROW]
[ROW][C]23[/C][C]-0.109671[/C][C]-1.0229[/C][C]0.154585[/C][/ROW]
[ROW][C]24[/C][C]-0.011424[/C][C]-0.1066[/C][C]0.457695[/C][/ROW]
[ROW][C]25[/C][C]-0.148284[/C][C]-1.3831[/C][C]0.085087[/C][/ROW]
[ROW][C]26[/C][C]0.131523[/C][C]1.2268[/C][C]0.111611[/C][/ROW]
[ROW][C]27[/C][C]-0.026656[/C][C]-0.2486[/C][C]0.402117[/C][/ROW]
[ROW][C]28[/C][C]0.166429[/C][C]1.5523[/C][C]0.062105[/C][/ROW]
[ROW][C]29[/C][C]0.005875[/C][C]0.0548[/C][C]0.478213[/C][/ROW]
[ROW][C]30[/C][C]-0.008349[/C][C]-0.0779[/C][C]0.469052[/C][/ROW]
[ROW][C]31[/C][C]-0.124036[/C][C]-1.1569[/C][C]0.125234[/C][/ROW]
[ROW][C]32[/C][C]-0.018784[/C][C]-0.1752[/C][C]0.430662[/C][/ROW]
[ROW][C]33[/C][C]0.000704[/C][C]0.0066[/C][C]0.497389[/C][/ROW]
[ROW][C]34[/C][C]-0.010347[/C][C]-0.0965[/C][C]0.461668[/C][/ROW]
[ROW][C]35[/C][C]0.119897[/C][C]1.1183[/C][C]0.133253[/C][/ROW]
[ROW][C]36[/C][C]-0.039775[/C][C]-0.371[/C][C]0.35577[/C][/ROW]
[ROW][C]37[/C][C]0.024047[/C][C]0.2243[/C][C]0.411528[/C][/ROW]
[ROW][C]38[/C][C]0.047352[/C][C]0.4417[/C][C]0.329911[/C][/ROW]
[ROW][C]39[/C][C]-0.053722[/C][C]-0.5011[/C][C]0.308789[/C][/ROW]
[ROW][C]40[/C][C]-0.001939[/C][C]-0.0181[/C][C]0.492805[/C][/ROW]
[ROW][C]41[/C][C]-0.056953[/C][C]-0.5312[/C][C]0.298308[/C][/ROW]
[ROW][C]42[/C][C]-0.147147[/C][C]-1.3725[/C][C]0.086719[/C][/ROW]
[ROW][C]43[/C][C]-0.043369[/C][C]-0.4045[/C][C]0.343412[/C][/ROW]
[ROW][C]44[/C][C]-0.091116[/C][C]-0.8499[/C][C]0.198865[/C][/ROW]
[ROW][C]45[/C][C]0.004288[/C][C]0.04[/C][C]0.484093[/C][/ROW]
[ROW][C]46[/C][C]0.033313[/C][C]0.3107[/C][C]0.378375[/C][/ROW]
[ROW][C]47[/C][C]0.004058[/C][C]0.0379[/C][C]0.484947[/C][/ROW]
[ROW][C]48[/C][C]0.011492[/C][C]0.1072[/C][C]0.457442[/C][/ROW]
[/TABLE]
Source: https://freestatistics.org/blog/index.php?pk=30593&T=1

Globally Unique Identifier (entire table): ba.freestatistics.org/blog/index.php?pk=30593&T=1

As an alternative you can also use a QR Code:  

The GUIDs for individual cells are displayed in the table below:

Autocorrelation Function
Time lag kACF(k)T-STATP-value
10.114811.07090.143594
20.1238061.15480.12567
3-0.085988-0.8020.212357
4-0.111271-1.03790.151103
5-0.074638-0.69620.244087
6-0.0598-0.55780.289215
7-0.006615-0.06170.47547
80.0765440.7140.238584
90.0250690.23380.407834
10-0.086647-0.80820.210592
110.0019770.01840.492664
12-0.085058-0.79340.214862
13-0.251698-2.34770.01058
14-0.056459-0.52660.299899
15-0.085033-0.79310.214929
160.08390.78260.218002
170.152461.4220.079294
180.0680420.63460.263661
190.0987280.92090.179833
20-0.057499-0.53630.296555
21-0.035882-0.33470.369334
22-0.053098-0.49530.310832
23-0.109671-1.02290.154585
24-0.011424-0.10660.457695
25-0.148284-1.38310.085087
260.1315231.22680.111611
27-0.026656-0.24860.402117
280.1664291.55230.062105
290.0058750.05480.478213
30-0.008349-0.07790.469052
31-0.124036-1.15690.125234
32-0.018784-0.17520.430662
330.0007040.00660.497389
34-0.010347-0.09650.461668
350.1198971.11830.133253
36-0.039775-0.3710.35577
370.0240470.22430.411528
380.0473520.44170.329911
39-0.053722-0.50110.308789
40-0.001939-0.01810.492805
41-0.056953-0.53120.298308
42-0.147147-1.37250.086719
43-0.043369-0.40450.343412
44-0.091116-0.84990.198865
450.0042880.040.484093
460.0333130.31070.378375
470.0040580.03790.484947
480.0114920.10720.457442


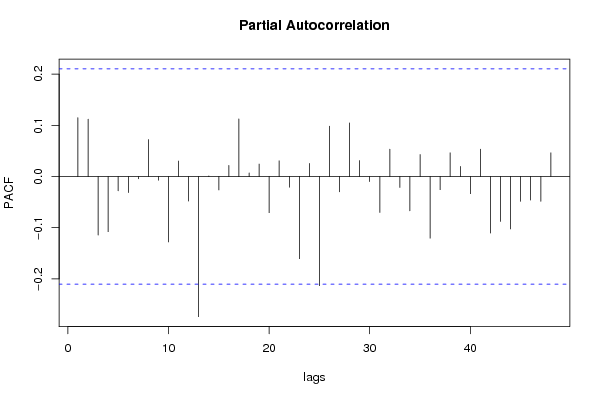
Partial Autocorrelation Function
Time lag kPACF(k)T-STATP-value
10.114811.07090.143594
20.1121021.04560.149316
3-0.114406-1.06710.144438
4-0.107721-1.00480.158902
5-0.027827-0.25960.397911
6-0.031278-0.29170.385589
7-0.00445-0.04150.483494
80.0721190.67270.251465
9-0.007178-0.0670.473385
10-0.127742-1.19150.11835
110.0301870.28160.389474
12-0.047876-0.44660.328152
13-0.273752-2.55340.006205
140.0010220.00950.496207
15-0.026337-0.24570.403265
160.0216470.20190.42023
170.1124861.04920.148497
180.0069590.06490.474197
190.0243880.22750.410292
20-0.070783-0.66020.25543
210.0306140.28550.387953
22-0.020736-0.19340.423542
23-0.160527-1.49730.068968
240.0255430.23830.406123
25-0.213392-1.99040.024844
260.0983210.91710.180818
27-0.029773-0.27770.390948
280.1045540.97520.166079
290.0311680.29070.385982
30-0.009819-0.09160.463619
31-0.070124-0.65410.257396
320.0533110.49720.310134
33-0.021448-0.20010.420953
34-0.066996-0.62490.266836
350.0428720.39990.345113
36-0.120526-1.12420.132012
37-0.025859-0.24120.404985
380.0462510.43140.333624
390.0197690.18440.427068
40-0.033439-0.31190.377933
410.0532750.49690.310252
42-0.110556-1.03120.152652
43-0.087651-0.81760.207922
44-0.102297-0.95420.171321
45-0.048442-0.45180.326255
46-0.045987-0.42890.334516
47-0.048438-0.45180.326268
480.0463420.43230.333314

\begin{tabular}{lllllllll}
\hline
Partial Autocorrelation Function \tabularnewline
Time lag k & PACF(k) & T-STAT & P-value \tabularnewline
1 & 0.11481 & 1.0709 & 0.143594 \tabularnewline
2 & 0.112102 & 1.0456 & 0.149316 \tabularnewline
3 & -0.114406 & -1.0671 & 0.144438 \tabularnewline
4 & -0.107721 & -1.0048 & 0.158902 \tabularnewline
5 & -0.027827 & -0.2596 & 0.397911 \tabularnewline
6 & -0.031278 & -0.2917 & 0.385589 \tabularnewline
7 & -0.00445 & -0.0415 & 0.483494 \tabularnewline
8 & 0.072119 & 0.6727 & 0.251465 \tabularnewline
9 & -0.007178 & -0.067 & 0.473385 \tabularnewline
10 & -0.127742 & -1.1915 & 0.11835 \tabularnewline
11 & 0.030187 & 0.2816 & 0.389474 \tabularnewline
12 & -0.047876 & -0.4466 & 0.328152 \tabularnewline
13 & -0.273752 & -2.5534 & 0.006205 \tabularnewline
14 & 0.001022 & 0.0095 & 0.496207 \tabularnewline
15 & -0.026337 & -0.2457 & 0.403265 \tabularnewline
16 & 0.021647 & 0.2019 & 0.42023 \tabularnewline
17 & 0.112486 & 1.0492 & 0.148497 \tabularnewline
18 & 0.006959 & 0.0649 & 0.474197 \tabularnewline
19 & 0.024388 & 0.2275 & 0.410292 \tabularnewline
20 & -0.070783 & -0.6602 & 0.25543 \tabularnewline
21 & 0.030614 & 0.2855 & 0.387953 \tabularnewline
22 & -0.020736 & -0.1934 & 0.423542 \tabularnewline
23 & -0.160527 & -1.4973 & 0.068968 \tabularnewline
24 & 0.025543 & 0.2383 & 0.406123 \tabularnewline
25 & -0.213392 & -1.9904 & 0.024844 \tabularnewline
26 & 0.098321 & 0.9171 & 0.180818 \tabularnewline
27 & -0.029773 & -0.2777 & 0.390948 \tabularnewline
28 & 0.104554 & 0.9752 & 0.166079 \tabularnewline
29 & 0.031168 & 0.2907 & 0.385982 \tabularnewline
30 & -0.009819 & -0.0916 & 0.463619 \tabularnewline
31 & -0.070124 & -0.6541 & 0.257396 \tabularnewline
32 & 0.053311 & 0.4972 & 0.310134 \tabularnewline
33 & -0.021448 & -0.2001 & 0.420953 \tabularnewline
34 & -0.066996 & -0.6249 & 0.266836 \tabularnewline
35 & 0.042872 & 0.3999 & 0.345113 \tabularnewline
36 & -0.120526 & -1.1242 & 0.132012 \tabularnewline
37 & -0.025859 & -0.2412 & 0.404985 \tabularnewline
38 & 0.046251 & 0.4314 & 0.333624 \tabularnewline
39 & 0.019769 & 0.1844 & 0.427068 \tabularnewline
40 & -0.033439 & -0.3119 & 0.377933 \tabularnewline
41 & 0.053275 & 0.4969 & 0.310252 \tabularnewline
42 & -0.110556 & -1.0312 & 0.152652 \tabularnewline
43 & -0.087651 & -0.8176 & 0.207922 \tabularnewline
44 & -0.102297 & -0.9542 & 0.171321 \tabularnewline
45 & -0.048442 & -0.4518 & 0.326255 \tabularnewline
46 & -0.045987 & -0.4289 & 0.334516 \tabularnewline
47 & -0.048438 & -0.4518 & 0.326268 \tabularnewline
48 & 0.046342 & 0.4323 & 0.333314 \tabularnewline
\hline
\end{tabular}
%Source: https://freestatistics.org/blog/index.php?pk=30593&T=2

[TABLE]
[ROW][C]Partial Autocorrelation Function[/C][/ROW]
[ROW][C]Time lag k[/C][C]PACF(k)[/C][C]T-STAT[/C][C]P-value[/C][/ROW]
[ROW][C]1[/C][C]0.11481[/C][C]1.0709[/C][C]0.143594[/C][/ROW]
[ROW][C]2[/C][C]0.112102[/C][C]1.0456[/C][C]0.149316[/C][/ROW]
[ROW][C]3[/C][C]-0.114406[/C][C]-1.0671[/C][C]0.144438[/C][/ROW]
[ROW][C]4[/C][C]-0.107721[/C][C]-1.0048[/C][C]0.158902[/C][/ROW]
[ROW][C]5[/C][C]-0.027827[/C][C]-0.2596[/C][C]0.397911[/C][/ROW]
[ROW][C]6[/C][C]-0.031278[/C][C]-0.2917[/C][C]0.385589[/C][/ROW]
[ROW][C]7[/C][C]-0.00445[/C][C]-0.0415[/C][C]0.483494[/C][/ROW]
[ROW][C]8[/C][C]0.072119[/C][C]0.6727[/C][C]0.251465[/C][/ROW]
[ROW][C]9[/C][C]-0.007178[/C][C]-0.067[/C][C]0.473385[/C][/ROW]
[ROW][C]10[/C][C]-0.127742[/C][C]-1.1915[/C][C]0.11835[/C][/ROW]
[ROW][C]11[/C][C]0.030187[/C][C]0.2816[/C][C]0.389474[/C][/ROW]
[ROW][C]12[/C][C]-0.047876[/C][C]-0.4466[/C][C]0.328152[/C][/ROW]
[ROW][C]13[/C][C]-0.273752[/C][C]-2.5534[/C][C]0.006205[/C][/ROW]
[ROW][C]14[/C][C]0.001022[/C][C]0.0095[/C][C]0.496207[/C][/ROW]
[ROW][C]15[/C][C]-0.026337[/C][C]-0.2457[/C][C]0.403265[/C][/ROW]
[ROW][C]16[/C][C]0.021647[/C][C]0.2019[/C][C]0.42023[/C][/ROW]
[ROW][C]17[/C][C]0.112486[/C][C]1.0492[/C][C]0.148497[/C][/ROW]
[ROW][C]18[/C][C]0.006959[/C][C]0.0649[/C][C]0.474197[/C][/ROW]
[ROW][C]19[/C][C]0.024388[/C][C]0.2275[/C][C]0.410292[/C][/ROW]
[ROW][C]20[/C][C]-0.070783[/C][C]-0.6602[/C][C]0.25543[/C][/ROW]
[ROW][C]21[/C][C]0.030614[/C][C]0.2855[/C][C]0.387953[/C][/ROW]
[ROW][C]22[/C][C]-0.020736[/C][C]-0.1934[/C][C]0.423542[/C][/ROW]
[ROW][C]23[/C][C]-0.160527[/C][C]-1.4973[/C][C]0.068968[/C][/ROW]
[ROW][C]24[/C][C]0.025543[/C][C]0.2383[/C][C]0.406123[/C][/ROW]
[ROW][C]25[/C][C]-0.213392[/C][C]-1.9904[/C][C]0.024844[/C][/ROW]
[ROW][C]26[/C][C]0.098321[/C][C]0.9171[/C][C]0.180818[/C][/ROW]
[ROW][C]27[/C][C]-0.029773[/C][C]-0.2777[/C][C]0.390948[/C][/ROW]
[ROW][C]28[/C][C]0.104554[/C][C]0.9752[/C][C]0.166079[/C][/ROW]
[ROW][C]29[/C][C]0.031168[/C][C]0.2907[/C][C]0.385982[/C][/ROW]
[ROW][C]30[/C][C]-0.009819[/C][C]-0.0916[/C][C]0.463619[/C][/ROW]
[ROW][C]31[/C][C]-0.070124[/C][C]-0.6541[/C][C]0.257396[/C][/ROW]
[ROW][C]32[/C][C]0.053311[/C][C]0.4972[/C][C]0.310134[/C][/ROW]
[ROW][C]33[/C][C]-0.021448[/C][C]-0.2001[/C][C]0.420953[/C][/ROW]
[ROW][C]34[/C][C]-0.066996[/C][C]-0.6249[/C][C]0.266836[/C][/ROW]
[ROW][C]35[/C][C]0.042872[/C][C]0.3999[/C][C]0.345113[/C][/ROW]
[ROW][C]36[/C][C]-0.120526[/C][C]-1.1242[/C][C]0.132012[/C][/ROW]
[ROW][C]37[/C][C]-0.025859[/C][C]-0.2412[/C][C]0.404985[/C][/ROW]
[ROW][C]38[/C][C]0.046251[/C][C]0.4314[/C][C]0.333624[/C][/ROW]
[ROW][C]39[/C][C]0.019769[/C][C]0.1844[/C][C]0.427068[/C][/ROW]
[ROW][C]40[/C][C]-0.033439[/C][C]-0.3119[/C][C]0.377933[/C][/ROW]
[ROW][C]41[/C][C]0.053275[/C][C]0.4969[/C][C]0.310252[/C][/ROW]
[ROW][C]42[/C][C]-0.110556[/C][C]-1.0312[/C][C]0.152652[/C][/ROW]
[ROW][C]43[/C][C]-0.087651[/C][C]-0.8176[/C][C]0.207922[/C][/ROW]
[ROW][C]44[/C][C]-0.102297[/C][C]-0.9542[/C][C]0.171321[/C][/ROW]
[ROW][C]45[/C][C]-0.048442[/C][C]-0.4518[/C][C]0.326255[/C][/ROW]
[ROW][C]46[/C][C]-0.045987[/C][C]-0.4289[/C][C]0.334516[/C][/ROW]
[ROW][C]47[/C][C]-0.048438[/C][C]-0.4518[/C][C]0.326268[/C][/ROW]
[ROW][C]48[/C][C]0.046342[/C][C]0.4323[/C][C]0.333314[/C][/ROW]
[/TABLE]
Source: https://freestatistics.org/blog/index.php?pk=30593&T=2

Globally Unique Identifier (entire table): ba.freestatistics.org/blog/index.php?pk=30593&T=2

As an alternative you can also use a QR Code:  

The GUIDs for individual cells are displayed in the table below:

Partial Autocorrelation Function
Time lag kPACF(k)T-STATP-value
10.114811.07090.143594
20.1121021.04560.149316
3-0.114406-1.06710.144438
4-0.107721-1.00480.158902
5-0.027827-0.25960.397911
6-0.031278-0.29170.385589
7-0.00445-0.04150.483494
80.0721190.67270.251465
9-0.007178-0.0670.473385
10-0.127742-1.19150.11835
110.0301870.28160.389474
12-0.047876-0.44660.328152
13-0.273752-2.55340.006205
140.0010220.00950.496207
15-0.026337-0.24570.403265
160.0216470.20190.42023
170.1124861.04920.148497
180.0069590.06490.474197
190.0243880.22750.410292
20-0.070783-0.66020.25543
210.0306140.28550.387953
22-0.020736-0.19340.423542
23-0.160527-1.49730.068968
240.0255430.23830.406123
25-0.213392-1.99040.024844
260.0983210.91710.180818
27-0.029773-0.27770.390948
280.1045540.97520.166079
290.0311680.29070.385982
30-0.009819-0.09160.463619
31-0.070124-0.65410.257396
320.0533110.49720.310134
33-0.021448-0.20010.420953
34-0.066996-0.62490.266836
350.0428720.39990.345113
36-0.120526-1.12420.132012
37-0.025859-0.24120.404985
380.0462510.43140.333624
390.0197690.18440.427068
40-0.033439-0.31190.377933
410.0532750.49690.310252
42-0.110556-1.03120.152652
43-0.087651-0.81760.207922
44-0.102297-0.95420.171321
45-0.048442-0.45180.326255
46-0.045987-0.42890.334516
47-0.048438-0.45180.326268
480.0463420.43230.333314


Parameters (Session):
par1 = 48 ; par2 = 1 ; par3 = 1 ; par4 = 0 ; par5 = 12 ;
Parameters (R input):
par1 = 48 ; par2 = 1 ; par3 = 1 ; par4 = 0 ; par5 = 12 ;
R code (references can be found in the software module):
if (par1 == 'Default') {
par1 = 10*log10(length(x))
} else {
par1 <- as.numeric(par1)
}
par2 <- as.numeric(par2)
par3 <- as.numeric(par3)
par4 <- as.numeric(par4)
par5 <- as.numeric(par5)
if (par2 == 0) {
x <- log(x)
} else {
x <- (x ^ par2 - 1) / par2
}
if (par3 > 0) x <- diff(x,lag=1,difference=par3)
if (par4 > 0) x <- diff(x,lag=par5,difference=par4)
bitmap(file='pic1.png')
racf <- acf(x,par1,main='Autocorrelation',xlab='lags',ylab='ACF')
dev.off()
bitmap(file='pic2.png')
rpacf <- pacf(x,par1,main='Partial Autocorrelation',xlab='lags',ylab='PACF')
dev.off()
(myacf <- c(racf$acf))
(mypacf <- c(rpacf$acf))
lengthx <- length(x)
sqrtn <- sqrt(lengthx)
load(file='createtable')
a<-table.start()
a<-table.row.start(a)
a<-table.element(a,'Autocorrelation Function',4,TRUE)
a<-table.row.end(a)
a<-table.row.start(a)
a<-table.element(a,'Time lag k',header=TRUE)
a<-table.element(a,hyperlink('basics.htm','ACF(k)','click here for more information about the Autocorrelation Function'),header=TRUE)
a<-table.element(a,'T-STAT',header=TRUE)
a<-table.element(a,'P-value',header=TRUE)
a<-table.row.end(a)
for (i in 2:(par1+1)) {
a<-table.row.start(a)
a<-table.element(a,i-1,header=TRUE)
a<-table.element(a,round(myacf[i],6))
mytstat <- myacf[i]*sqrtn
a<-table.element(a,round(mytstat,4))
a<-table.element(a,round(1-pt(abs(mytstat),lengthx),6))
a<-table.row.end(a)
}
a<-table.end(a)
table.save(a,file='mytable.tab')
a<-table.start()
a<-table.row.start(a)
a<-table.element(a,'Partial Autocorrelation Function',4,TRUE)
a<-table.row.end(a)
a<-table.row.start(a)
a<-table.element(a,'Time lag k',header=TRUE)
a<-table.element(a,hyperlink('basics.htm','PACF(k)','click here for more information about the Partial Autocorrelation Function'),header=TRUE)
a<-table.element(a,'T-STAT',header=TRUE)
a<-table.element(a,'P-value',header=TRUE)
a<-table.row.end(a)
for (i in 1:par1) {
a<-table.row.start(a)
a<-table.element(a,i,header=TRUE)
a<-table.element(a,round(mypacf[i],6))
mytstat <- mypacf[i]*sqrtn
a<-table.element(a,round(mytstat,4))
a<-table.element(a,round(1-pt(abs(mytstat),lengthx),6))
a<-table.row.end(a)
}
a<-table.end(a)
table.save(a,file='mytable1.tab')