Free Statistics

of Irreproducible Research!

Author's title

Author*Unverified author*
R Software Modulerwasp_autocorrelation.wasp
Title produced by software(Partial) Autocorrelation Function
Date of computationMon, 08 Dec 2008 09:56:32 -0700
Cite this page as followsStatistical Computations at FreeStatistics.org, Office for Research Development and Education, URL https://freestatistics.org/blog/index.php?v=date/2008/Dec/08/t1228755615h29ngv3ebxzsajf.htm/, Retrieved Thu, 16 May 2024 23:10:23 +0000
Statistical Computations at FreeStatistics.org, Office for Research Development and Education, URL https://freestatistics.org/blog/index.php?pk=30590, Retrieved Thu, 16 May 2024 23:10:23 +0000
QR Codes:

Original text written by user:
IsPrivate?No (this computation is public)
User-defined keywords
Estimated Impact151
Family? (F = Feedback message, R = changed R code, M = changed R Module, P = changed Parameters, D = changed Data)
-     [Univariate Data Series] [data set] [2008-12-01 19:54:57] [b98453cac15ba1066b407e146608df68]
- RMPD  [Standard Deviation-Mean Plot] [Standard Deviatio...] [2008-12-08 16:41:53] [74be16979710d4c4e7c6647856088456]
- RMPD      [(Partial) Autocorrelation Function] [(Partial) Autocor...] [2008-12-08 16:56:32] [d41d8cd98f00b204e9800998ecf8427e] [Current]
Feedback Forum

Post a new message
Dataseries X:
67.8
66.9
71.5
75.9
71.9
70.7
73.5
76.1
82.5
87.1
83.2
86.1
85.9
77.4
74.4
69.9
73.8
69.2
69.7
71
71.2
75.8
73
66.4
58.6
55.5
52.6
54.9
54.6
51.2
50.9
49.6
53.4
52
47.5
42.1
44.5
43.2
51.4
59.4
60.3
61.4
68.8
73.6
81.8
79.6
85.8
88.1
89.1
95
96.2
84.2
96.9
103.1
99.3
103.5
112.4
111.1
113.7
92
93
98.4
92.6
94.6
99.5
97.6
91.3
93.6
93.1
78.4
70.2
69.3
71.1
73.5
85.9
91.5
91.8
88.3
91.3
94
99.3
96.7
88
96.7
106.8
114.3
105.7
90.1
91.6
97.7
100.8
104.6
95.9
102.7
104
107.9
113.8
113.8
123.1
125.1
137.6
134
140.3
152.1
150.6
167.3
153.2
142
154.4
158.5
180.9
181.3
172.4
192
199.3
215.4
214.3
201.5
190.5
196
215.7
209.4
214.1
237.8
239
237.8
251.5
248.8
215.4
201.2
203.1
214.2
188.9
203
213.3
228.5
228.2
240.9
258.8
248.5
269.2
289.6
323.4
317.2
322.8
340.9
368.2
388.5
441.2
474.3
483.9
417.9
365.9
263
199.4


Summary of computational transaction
Raw Inputview raw input (R code)
Raw Outputview raw output of R engine
Computing time1 seconds
R Server'George Udny Yule' @ 72.249.76.132

\begin{tabular}{lllllllll}
\hline
Summary of computational transaction \tabularnewline
Raw Input & view raw input (R code)  \tabularnewline
Raw Output & view raw output of R engine  \tabularnewline
Computing time & 1 seconds \tabularnewline
R Server & 'George Udny Yule' @ 72.249.76.132 \tabularnewline
\hline
\end{tabular}
%Source: https://freestatistics.org/blog/index.php?pk=30590&T=0

[TABLE]
[ROW][C]Summary of computational transaction[/C][/ROW]
[ROW][C]Raw Input[/C][C]view raw input (R code) [/C][/ROW]
[ROW][C]Raw Output[/C][C]view raw output of R engine [/C][/ROW]
[ROW][C]Computing time[/C][C]1 seconds[/C][/ROW]
[ROW][C]R Server[/C][C]'George Udny Yule' @ 72.249.76.132[/C][/ROW]
[/TABLE]
Source: https://freestatistics.org/blog/index.php?pk=30590&T=0

Globally Unique Identifier (entire table): ba.freestatistics.org/blog/index.php?pk=30590&T=0

As an alternative you can also use a QR Code:  

The GUIDs for individual cells are displayed in the table below:

Summary of computational transaction
Raw Inputview raw input (R code)
Raw Outputview raw output of R engine
Computing time1 seconds
R Server'George Udny Yule' @ 72.249.76.132


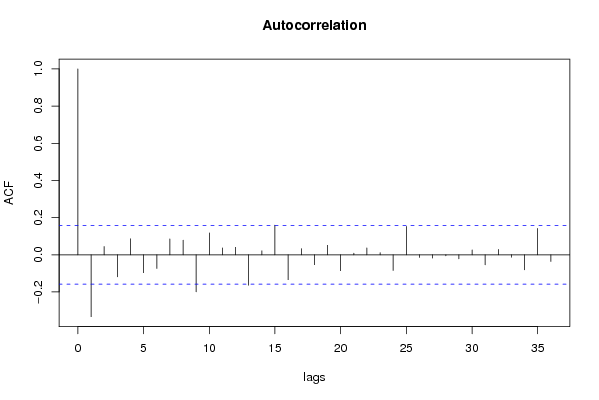
Autocorrelation Function
Time lag kACF(k)T-STATP-value
1-0.333057-4.11973.1e-05
20.0444970.55040.291425
3-0.118669-1.46790.072098
40.085671.05970.145481
5-0.096403-1.19240.117468
6-0.073336-0.90710.182884
70.084951.05080.147509
80.0785550.97170.166374
9-0.199087-2.46260.007452
100.1174271.45250.074206
110.0368640.4560.324526
120.0404040.49980.308975
13-0.163465-2.0220.022462
140.0210240.260.397588
150.1589851.96650.025523
16-0.134399-1.66240.049237
170.0329520.40760.342073
18-0.053263-0.65880.255498
190.050980.63060.264626
20-0.085817-1.06150.145069
210.0084140.10410.458625
220.0366610.45350.325425
230.0113020.13980.444502
24-0.084114-1.04040.149891
250.1522721.88350.030765
26-0.01459-0.18050.428513
27-0.018059-0.22340.411772
28-0.005461-0.06750.473117
29-0.021961-0.27160.393131
300.0261290.32320.373495
31-0.054282-0.67140.251478
320.0284620.35210.36264
33-0.013182-0.16310.435347
34-0.080861-1.00020.159397
350.1415161.75050.041022
36-0.035829-0.44320.32913

\begin{tabular}{lllllllll}
\hline
Autocorrelation Function \tabularnewline
Time lag k & ACF(k) & T-STAT & P-value \tabularnewline
1 & -0.333057 & -4.1197 & 3.1e-05 \tabularnewline
2 & 0.044497 & 0.5504 & 0.291425 \tabularnewline
3 & -0.118669 & -1.4679 & 0.072098 \tabularnewline
4 & 0.08567 & 1.0597 & 0.145481 \tabularnewline
5 & -0.096403 & -1.1924 & 0.117468 \tabularnewline
6 & -0.073336 & -0.9071 & 0.182884 \tabularnewline
7 & 0.08495 & 1.0508 & 0.147509 \tabularnewline
8 & 0.078555 & 0.9717 & 0.166374 \tabularnewline
9 & -0.199087 & -2.4626 & 0.007452 \tabularnewline
10 & 0.117427 & 1.4525 & 0.074206 \tabularnewline
11 & 0.036864 & 0.456 & 0.324526 \tabularnewline
12 & 0.040404 & 0.4998 & 0.308975 \tabularnewline
13 & -0.163465 & -2.022 & 0.022462 \tabularnewline
14 & 0.021024 & 0.26 & 0.397588 \tabularnewline
15 & 0.158985 & 1.9665 & 0.025523 \tabularnewline
16 & -0.134399 & -1.6624 & 0.049237 \tabularnewline
17 & 0.032952 & 0.4076 & 0.342073 \tabularnewline
18 & -0.053263 & -0.6588 & 0.255498 \tabularnewline
19 & 0.05098 & 0.6306 & 0.264626 \tabularnewline
20 & -0.085817 & -1.0615 & 0.145069 \tabularnewline
21 & 0.008414 & 0.1041 & 0.458625 \tabularnewline
22 & 0.036661 & 0.4535 & 0.325425 \tabularnewline
23 & 0.011302 & 0.1398 & 0.444502 \tabularnewline
24 & -0.084114 & -1.0404 & 0.149891 \tabularnewline
25 & 0.152272 & 1.8835 & 0.030765 \tabularnewline
26 & -0.01459 & -0.1805 & 0.428513 \tabularnewline
27 & -0.018059 & -0.2234 & 0.411772 \tabularnewline
28 & -0.005461 & -0.0675 & 0.473117 \tabularnewline
29 & -0.021961 & -0.2716 & 0.393131 \tabularnewline
30 & 0.026129 & 0.3232 & 0.373495 \tabularnewline
31 & -0.054282 & -0.6714 & 0.251478 \tabularnewline
32 & 0.028462 & 0.3521 & 0.36264 \tabularnewline
33 & -0.013182 & -0.1631 & 0.435347 \tabularnewline
34 & -0.080861 & -1.0002 & 0.159397 \tabularnewline
35 & 0.141516 & 1.7505 & 0.041022 \tabularnewline
36 & -0.035829 & -0.4432 & 0.32913 \tabularnewline
\hline
\end{tabular}
%Source: https://freestatistics.org/blog/index.php?pk=30590&T=1

[TABLE]
[ROW][C]Autocorrelation Function[/C][/ROW]
[ROW][C]Time lag k[/C][C]ACF(k)[/C][C]T-STAT[/C][C]P-value[/C][/ROW]
[ROW][C]1[/C][C]-0.333057[/C][C]-4.1197[/C][C]3.1e-05[/C][/ROW]
[ROW][C]2[/C][C]0.044497[/C][C]0.5504[/C][C]0.291425[/C][/ROW]
[ROW][C]3[/C][C]-0.118669[/C][C]-1.4679[/C][C]0.072098[/C][/ROW]
[ROW][C]4[/C][C]0.08567[/C][C]1.0597[/C][C]0.145481[/C][/ROW]
[ROW][C]5[/C][C]-0.096403[/C][C]-1.1924[/C][C]0.117468[/C][/ROW]
[ROW][C]6[/C][C]-0.073336[/C][C]-0.9071[/C][C]0.182884[/C][/ROW]
[ROW][C]7[/C][C]0.08495[/C][C]1.0508[/C][C]0.147509[/C][/ROW]
[ROW][C]8[/C][C]0.078555[/C][C]0.9717[/C][C]0.166374[/C][/ROW]
[ROW][C]9[/C][C]-0.199087[/C][C]-2.4626[/C][C]0.007452[/C][/ROW]
[ROW][C]10[/C][C]0.117427[/C][C]1.4525[/C][C]0.074206[/C][/ROW]
[ROW][C]11[/C][C]0.036864[/C][C]0.456[/C][C]0.324526[/C][/ROW]
[ROW][C]12[/C][C]0.040404[/C][C]0.4998[/C][C]0.308975[/C][/ROW]
[ROW][C]13[/C][C]-0.163465[/C][C]-2.022[/C][C]0.022462[/C][/ROW]
[ROW][C]14[/C][C]0.021024[/C][C]0.26[/C][C]0.397588[/C][/ROW]
[ROW][C]15[/C][C]0.158985[/C][C]1.9665[/C][C]0.025523[/C][/ROW]
[ROW][C]16[/C][C]-0.134399[/C][C]-1.6624[/C][C]0.049237[/C][/ROW]
[ROW][C]17[/C][C]0.032952[/C][C]0.4076[/C][C]0.342073[/C][/ROW]
[ROW][C]18[/C][C]-0.053263[/C][C]-0.6588[/C][C]0.255498[/C][/ROW]
[ROW][C]19[/C][C]0.05098[/C][C]0.6306[/C][C]0.264626[/C][/ROW]
[ROW][C]20[/C][C]-0.085817[/C][C]-1.0615[/C][C]0.145069[/C][/ROW]
[ROW][C]21[/C][C]0.008414[/C][C]0.1041[/C][C]0.458625[/C][/ROW]
[ROW][C]22[/C][C]0.036661[/C][C]0.4535[/C][C]0.325425[/C][/ROW]
[ROW][C]23[/C][C]0.011302[/C][C]0.1398[/C][C]0.444502[/C][/ROW]
[ROW][C]24[/C][C]-0.084114[/C][C]-1.0404[/C][C]0.149891[/C][/ROW]
[ROW][C]25[/C][C]0.152272[/C][C]1.8835[/C][C]0.030765[/C][/ROW]
[ROW][C]26[/C][C]-0.01459[/C][C]-0.1805[/C][C]0.428513[/C][/ROW]
[ROW][C]27[/C][C]-0.018059[/C][C]-0.2234[/C][C]0.411772[/C][/ROW]
[ROW][C]28[/C][C]-0.005461[/C][C]-0.0675[/C][C]0.473117[/C][/ROW]
[ROW][C]29[/C][C]-0.021961[/C][C]-0.2716[/C][C]0.393131[/C][/ROW]
[ROW][C]30[/C][C]0.026129[/C][C]0.3232[/C][C]0.373495[/C][/ROW]
[ROW][C]31[/C][C]-0.054282[/C][C]-0.6714[/C][C]0.251478[/C][/ROW]
[ROW][C]32[/C][C]0.028462[/C][C]0.3521[/C][C]0.36264[/C][/ROW]
[ROW][C]33[/C][C]-0.013182[/C][C]-0.1631[/C][C]0.435347[/C][/ROW]
[ROW][C]34[/C][C]-0.080861[/C][C]-1.0002[/C][C]0.159397[/C][/ROW]
[ROW][C]35[/C][C]0.141516[/C][C]1.7505[/C][C]0.041022[/C][/ROW]
[ROW][C]36[/C][C]-0.035829[/C][C]-0.4432[/C][C]0.32913[/C][/ROW]
[/TABLE]
Source: https://freestatistics.org/blog/index.php?pk=30590&T=1

Globally Unique Identifier (entire table): ba.freestatistics.org/blog/index.php?pk=30590&T=1

As an alternative you can also use a QR Code:  

The GUIDs for individual cells are displayed in the table below:

Autocorrelation Function
Time lag kACF(k)T-STATP-value
1-0.333057-4.11973.1e-05
20.0444970.55040.291425
3-0.118669-1.46790.072098
40.085671.05970.145481
5-0.096403-1.19240.117468
6-0.073336-0.90710.182884
70.084951.05080.147509
80.0785550.97170.166374
9-0.199087-2.46260.007452
100.1174271.45250.074206
110.0368640.4560.324526
120.0404040.49980.308975
13-0.163465-2.0220.022462
140.0210240.260.397588
150.1589851.96650.025523
16-0.134399-1.66240.049237
170.0329520.40760.342073
18-0.053263-0.65880.255498
190.050980.63060.264626
20-0.085817-1.06150.145069
210.0084140.10410.458625
220.0366610.45350.325425
230.0113020.13980.444502
24-0.084114-1.04040.149891
250.1522721.88350.030765
26-0.01459-0.18050.428513
27-0.018059-0.22340.411772
28-0.005461-0.06750.473117
29-0.021961-0.27160.393131
300.0261290.32320.373495
31-0.054282-0.67140.251478
320.0284620.35210.36264
33-0.013182-0.16310.435347
34-0.080861-1.00020.159397
350.1415161.75050.041022
36-0.035829-0.44320.32913


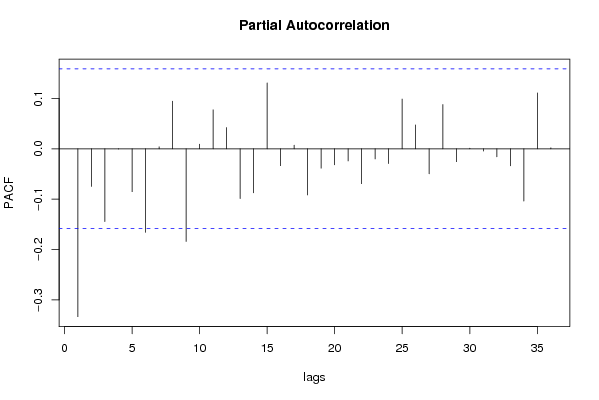
Partial Autocorrelation Function
Time lag kPACF(k)T-STATP-value
1-0.333057-4.11973.1e-05
2-0.074718-0.92420.178416
3-0.144356-1.78560.038073
4-0.000626-0.00770.496917
5-0.085006-1.05150.14735
6-0.165612-2.04850.02111
70.0039620.0490.48049
80.0946031.17020.121875
9-0.183835-2.27390.012181
100.0091560.11330.454988
110.0774420.95790.169811
120.0420510.52010.30186
13-0.098838-1.22260.111688
14-0.087309-1.07990.140932
150.1305961.61540.054144
16-0.033554-0.4150.339346
170.0070910.08770.465108
18-0.091446-1.13110.129885
19-0.038541-0.47670.31712
20-0.031667-0.39170.347914
21-0.024175-0.2990.382663
22-0.06916-0.85550.196816
23-0.020041-0.24790.402277
24-0.029358-0.36310.358499
250.0986361.22010.11216
260.0473810.58610.279347
27-0.049641-0.6140.270056
280.0877911.08590.139613
29-0.0255-0.31540.376436
300.0013390.01660.493402
31-0.004594-0.05680.47738
32-0.015971-0.19760.421828
33-0.033751-0.41750.338458
34-0.103736-1.28310.100692
350.1108431.3710.086184
360.0020490.02530.489907

\begin{tabular}{lllllllll}
\hline
Partial Autocorrelation Function \tabularnewline
Time lag k & PACF(k) & T-STAT & P-value \tabularnewline
1 & -0.333057 & -4.1197 & 3.1e-05 \tabularnewline
2 & -0.074718 & -0.9242 & 0.178416 \tabularnewline
3 & -0.144356 & -1.7856 & 0.038073 \tabularnewline
4 & -0.000626 & -0.0077 & 0.496917 \tabularnewline
5 & -0.085006 & -1.0515 & 0.14735 \tabularnewline
6 & -0.165612 & -2.0485 & 0.02111 \tabularnewline
7 & 0.003962 & 0.049 & 0.48049 \tabularnewline
8 & 0.094603 & 1.1702 & 0.121875 \tabularnewline
9 & -0.183835 & -2.2739 & 0.012181 \tabularnewline
10 & 0.009156 & 0.1133 & 0.454988 \tabularnewline
11 & 0.077442 & 0.9579 & 0.169811 \tabularnewline
12 & 0.042051 & 0.5201 & 0.30186 \tabularnewline
13 & -0.098838 & -1.2226 & 0.111688 \tabularnewline
14 & -0.087309 & -1.0799 & 0.140932 \tabularnewline
15 & 0.130596 & 1.6154 & 0.054144 \tabularnewline
16 & -0.033554 & -0.415 & 0.339346 \tabularnewline
17 & 0.007091 & 0.0877 & 0.465108 \tabularnewline
18 & -0.091446 & -1.1311 & 0.129885 \tabularnewline
19 & -0.038541 & -0.4767 & 0.31712 \tabularnewline
20 & -0.031667 & -0.3917 & 0.347914 \tabularnewline
21 & -0.024175 & -0.299 & 0.382663 \tabularnewline
22 & -0.06916 & -0.8555 & 0.196816 \tabularnewline
23 & -0.020041 & -0.2479 & 0.402277 \tabularnewline
24 & -0.029358 & -0.3631 & 0.358499 \tabularnewline
25 & 0.098636 & 1.2201 & 0.11216 \tabularnewline
26 & 0.047381 & 0.5861 & 0.279347 \tabularnewline
27 & -0.049641 & -0.614 & 0.270056 \tabularnewline
28 & 0.087791 & 1.0859 & 0.139613 \tabularnewline
29 & -0.0255 & -0.3154 & 0.376436 \tabularnewline
30 & 0.001339 & 0.0166 & 0.493402 \tabularnewline
31 & -0.004594 & -0.0568 & 0.47738 \tabularnewline
32 & -0.015971 & -0.1976 & 0.421828 \tabularnewline
33 & -0.033751 & -0.4175 & 0.338458 \tabularnewline
34 & -0.103736 & -1.2831 & 0.100692 \tabularnewline
35 & 0.110843 & 1.371 & 0.086184 \tabularnewline
36 & 0.002049 & 0.0253 & 0.489907 \tabularnewline
\hline
\end{tabular}
%Source: https://freestatistics.org/blog/index.php?pk=30590&T=2

[TABLE]
[ROW][C]Partial Autocorrelation Function[/C][/ROW]
[ROW][C]Time lag k[/C][C]PACF(k)[/C][C]T-STAT[/C][C]P-value[/C][/ROW]
[ROW][C]1[/C][C]-0.333057[/C][C]-4.1197[/C][C]3.1e-05[/C][/ROW]
[ROW][C]2[/C][C]-0.074718[/C][C]-0.9242[/C][C]0.178416[/C][/ROW]
[ROW][C]3[/C][C]-0.144356[/C][C]-1.7856[/C][C]0.038073[/C][/ROW]
[ROW][C]4[/C][C]-0.000626[/C][C]-0.0077[/C][C]0.496917[/C][/ROW]
[ROW][C]5[/C][C]-0.085006[/C][C]-1.0515[/C][C]0.14735[/C][/ROW]
[ROW][C]6[/C][C]-0.165612[/C][C]-2.0485[/C][C]0.02111[/C][/ROW]
[ROW][C]7[/C][C]0.003962[/C][C]0.049[/C][C]0.48049[/C][/ROW]
[ROW][C]8[/C][C]0.094603[/C][C]1.1702[/C][C]0.121875[/C][/ROW]
[ROW][C]9[/C][C]-0.183835[/C][C]-2.2739[/C][C]0.012181[/C][/ROW]
[ROW][C]10[/C][C]0.009156[/C][C]0.1133[/C][C]0.454988[/C][/ROW]
[ROW][C]11[/C][C]0.077442[/C][C]0.9579[/C][C]0.169811[/C][/ROW]
[ROW][C]12[/C][C]0.042051[/C][C]0.5201[/C][C]0.30186[/C][/ROW]
[ROW][C]13[/C][C]-0.098838[/C][C]-1.2226[/C][C]0.111688[/C][/ROW]
[ROW][C]14[/C][C]-0.087309[/C][C]-1.0799[/C][C]0.140932[/C][/ROW]
[ROW][C]15[/C][C]0.130596[/C][C]1.6154[/C][C]0.054144[/C][/ROW]
[ROW][C]16[/C][C]-0.033554[/C][C]-0.415[/C][C]0.339346[/C][/ROW]
[ROW][C]17[/C][C]0.007091[/C][C]0.0877[/C][C]0.465108[/C][/ROW]
[ROW][C]18[/C][C]-0.091446[/C][C]-1.1311[/C][C]0.129885[/C][/ROW]
[ROW][C]19[/C][C]-0.038541[/C][C]-0.4767[/C][C]0.31712[/C][/ROW]
[ROW][C]20[/C][C]-0.031667[/C][C]-0.3917[/C][C]0.347914[/C][/ROW]
[ROW][C]21[/C][C]-0.024175[/C][C]-0.299[/C][C]0.382663[/C][/ROW]
[ROW][C]22[/C][C]-0.06916[/C][C]-0.8555[/C][C]0.196816[/C][/ROW]
[ROW][C]23[/C][C]-0.020041[/C][C]-0.2479[/C][C]0.402277[/C][/ROW]
[ROW][C]24[/C][C]-0.029358[/C][C]-0.3631[/C][C]0.358499[/C][/ROW]
[ROW][C]25[/C][C]0.098636[/C][C]1.2201[/C][C]0.11216[/C][/ROW]
[ROW][C]26[/C][C]0.047381[/C][C]0.5861[/C][C]0.279347[/C][/ROW]
[ROW][C]27[/C][C]-0.049641[/C][C]-0.614[/C][C]0.270056[/C][/ROW]
[ROW][C]28[/C][C]0.087791[/C][C]1.0859[/C][C]0.139613[/C][/ROW]
[ROW][C]29[/C][C]-0.0255[/C][C]-0.3154[/C][C]0.376436[/C][/ROW]
[ROW][C]30[/C][C]0.001339[/C][C]0.0166[/C][C]0.493402[/C][/ROW]
[ROW][C]31[/C][C]-0.004594[/C][C]-0.0568[/C][C]0.47738[/C][/ROW]
[ROW][C]32[/C][C]-0.015971[/C][C]-0.1976[/C][C]0.421828[/C][/ROW]
[ROW][C]33[/C][C]-0.033751[/C][C]-0.4175[/C][C]0.338458[/C][/ROW]
[ROW][C]34[/C][C]-0.103736[/C][C]-1.2831[/C][C]0.100692[/C][/ROW]
[ROW][C]35[/C][C]0.110843[/C][C]1.371[/C][C]0.086184[/C][/ROW]
[ROW][C]36[/C][C]0.002049[/C][C]0.0253[/C][C]0.489907[/C][/ROW]
[/TABLE]
Source: https://freestatistics.org/blog/index.php?pk=30590&T=2

Globally Unique Identifier (entire table): ba.freestatistics.org/blog/index.php?pk=30590&T=2

As an alternative you can also use a QR Code:  

The GUIDs for individual cells are displayed in the table below:

Partial Autocorrelation Function
Time lag kPACF(k)T-STATP-value
1-0.333057-4.11973.1e-05
2-0.074718-0.92420.178416
3-0.144356-1.78560.038073
4-0.000626-0.00770.496917
5-0.085006-1.05150.14735
6-0.165612-2.04850.02111
70.0039620.0490.48049
80.0946031.17020.121875
9-0.183835-2.27390.012181
100.0091560.11330.454988
110.0774420.95790.169811
120.0420510.52010.30186
13-0.098838-1.22260.111688
14-0.087309-1.07990.140932
150.1305961.61540.054144
16-0.033554-0.4150.339346
170.0070910.08770.465108
18-0.091446-1.13110.129885
19-0.038541-0.47670.31712
20-0.031667-0.39170.347914
21-0.024175-0.2990.382663
22-0.06916-0.85550.196816
23-0.020041-0.24790.402277
24-0.029358-0.36310.358499
250.0986361.22010.11216
260.0473810.58610.279347
27-0.049641-0.6140.270056
280.0877911.08590.139613
29-0.0255-0.31540.376436
300.0013390.01660.493402
31-0.004594-0.05680.47738
32-0.015971-0.19760.421828
33-0.033751-0.41750.338458
34-0.103736-1.28310.100692
350.1108431.3710.086184
360.0020490.02530.489907


Parameters (Session):
par1 = 36 ; par2 = 1 ; par3 = 2 ; par4 = 0 ; par5 = 12 ;
Parameters (R input):
par1 = 36 ; par2 = 1 ; par3 = 2 ; par4 = 0 ; par5 = 12 ;
R code (references can be found in the software module):
if (par1 == 'Default') {
par1 = 10*log10(length(x))
} else {
par1 <- as.numeric(par1)
}
par2 <- as.numeric(par2)
par3 <- as.numeric(par3)
par4 <- as.numeric(par4)
par5 <- as.numeric(par5)
if (par2 == 0) {
x <- log(x)
} else {
x <- (x ^ par2 - 1) / par2
}
if (par3 > 0) x <- diff(x,lag=1,difference=par3)
if (par4 > 0) x <- diff(x,lag=par5,difference=par4)
bitmap(file='pic1.png')
racf <- acf(x,par1,main='Autocorrelation',xlab='lags',ylab='ACF')
dev.off()
bitmap(file='pic2.png')
rpacf <- pacf(x,par1,main='Partial Autocorrelation',xlab='lags',ylab='PACF')
dev.off()
(myacf <- c(racf$acf))
(mypacf <- c(rpacf$acf))
lengthx <- length(x)
sqrtn <- sqrt(lengthx)
load(file='createtable')
a<-table.start()
a<-table.row.start(a)
a<-table.element(a,'Autocorrelation Function',4,TRUE)
a<-table.row.end(a)
a<-table.row.start(a)
a<-table.element(a,'Time lag k',header=TRUE)
a<-table.element(a,hyperlink('basics.htm','ACF(k)','click here for more information about the Autocorrelation Function'),header=TRUE)
a<-table.element(a,'T-STAT',header=TRUE)
a<-table.element(a,'P-value',header=TRUE)
a<-table.row.end(a)
for (i in 2:(par1+1)) {
a<-table.row.start(a)
a<-table.element(a,i-1,header=TRUE)
a<-table.element(a,round(myacf[i],6))
mytstat <- myacf[i]*sqrtn
a<-table.element(a,round(mytstat,4))
a<-table.element(a,round(1-pt(abs(mytstat),lengthx),6))
a<-table.row.end(a)
}
a<-table.end(a)
table.save(a,file='mytable.tab')
a<-table.start()
a<-table.row.start(a)
a<-table.element(a,'Partial Autocorrelation Function',4,TRUE)
a<-table.row.end(a)
a<-table.row.start(a)
a<-table.element(a,'Time lag k',header=TRUE)
a<-table.element(a,hyperlink('basics.htm','PACF(k)','click here for more information about the Partial Autocorrelation Function'),header=TRUE)
a<-table.element(a,'T-STAT',header=TRUE)
a<-table.element(a,'P-value',header=TRUE)
a<-table.row.end(a)
for (i in 1:par1) {
a<-table.row.start(a)
a<-table.element(a,i,header=TRUE)
a<-table.element(a,round(mypacf[i],6))
mytstat <- mypacf[i]*sqrtn
a<-table.element(a,round(mytstat,4))
a<-table.element(a,round(1-pt(abs(mytstat),lengthx),6))
a<-table.row.end(a)
}
a<-table.end(a)
table.save(a,file='mytable1.tab')