Free Statistics

of Irreproducible Research!

Author's title

Author*The author of this computation has been verified*
R Software Modulerwasp_centraltendency.wasp
Title produced by softwareCentral Tendency
Date of computationMon, 08 Dec 2008 07:15:18 -0700
Cite this page as followsStatistical Computations at FreeStatistics.org, Office for Research Development and Education, URL https://freestatistics.org/blog/index.php?v=date/2008/Dec/08/t1228745750qug46ld8xx8rcmu.htm/, Retrieved Thu, 16 May 2024 07:15:33 +0000
Statistical Computations at FreeStatistics.org, Office for Research Development and Education, URL https://freestatistics.org/blog/index.php?pk=30509, Retrieved Thu, 16 May 2024 07:15:33 +0000
QR Codes:

Original text written by user:
IsPrivate?No (this computation is public)
User-defined keywords
Estimated Impact151
Family? (F = Feedback message, R = changed R code, M = changed R Module, P = changed Parameters, D = changed Data)
-       [Central Tendency] [] [2008-12-08 14:15:18] [28deb8481dba3cc87d2d53a86e0e0d0b] [Current]
Feedback Forum

Post a new message
Dataseries X:
88.3
88.6
91
91.5
95.4
98.7
99.9
98.6
100.3
100.2
100.4
101.4
103
109.1
111.4
114.1
121.8
127.6
129.9
128
123.5
124
127.4
127.6
128.4
131.4
135.1
134
144.5
147.3
150.9
148.7
141.4
138.9
139.8
145.6
147.9
148.5
151.1
157.5
167.5
172.3
173.5
187.5
205.5
195.1
204.5
204.5
201.7
207
206.6
210.6
211.1
215
223.9
238.2
238.9
229.6
232.2
222.1
221.6
227.3
221
213.6
243.4
253.8
265.3
268.2
268.5
266.9


Summary of computational transaction
Raw Inputview raw input (R code)
Raw Outputview raw output of R engine
Computing time1 seconds
R Server'Gwilym Jenkins' @ 72.249.127.135

\begin{tabular}{lllllllll}
\hline
Summary of computational transaction \tabularnewline
Raw Input & view raw input (R code)  \tabularnewline
Raw Output & view raw output of R engine  \tabularnewline
Computing time & 1 seconds \tabularnewline
R Server & 'Gwilym Jenkins' @ 72.249.127.135 \tabularnewline
\hline
\end{tabular}
%Source: https://freestatistics.org/blog/index.php?pk=30509&T=0

[TABLE]
[ROW][C]Summary of computational transaction[/C][/ROW]
[ROW][C]Raw Input[/C][C]view raw input (R code) [/C][/ROW]
[ROW][C]Raw Output[/C][C]view raw output of R engine [/C][/ROW]
[ROW][C]Computing time[/C][C]1 seconds[/C][/ROW]
[ROW][C]R Server[/C][C]'Gwilym Jenkins' @ 72.249.127.135[/C][/ROW]
[/TABLE]
Source: https://freestatistics.org/blog/index.php?pk=30509&T=0

Globally Unique Identifier (entire table): ba.freestatistics.org/blog/index.php?pk=30509&T=0

As an alternative you can also use a QR Code:  

The GUIDs for individual cells are displayed in the table below:

Summary of computational transaction
Raw Inputview raw input (R code)
Raw Outputview raw output of R engine
Computing time1 seconds
R Server'Gwilym Jenkins' @ 72.249.127.135


Central Tendency - Ungrouped Data
MeasureValueS.E.Value/S.E.
Arithmetic Mean164.1371428571436.4773145048176625.3403077363407
Geometric Mean155.416105949501
Harmonic Mean147.142825463845
Quadratic Mean172.730826101522
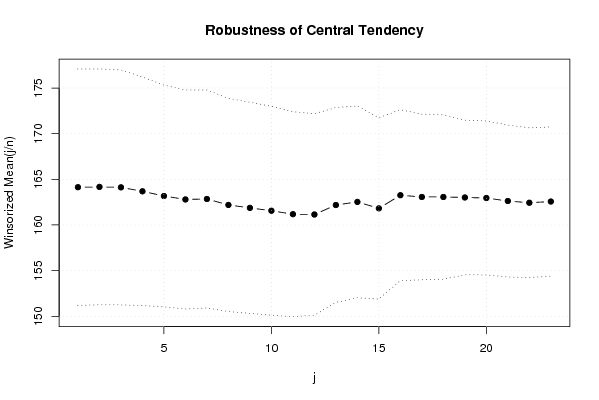
Winsorized Mean ( 1 / 23 )164.1371428571436.4755891908176425.3470592436421
Winsorized Mean ( 2 / 23 )164.1685714285716.4555522968190325.4306004940066
Winsorized Mean ( 3 / 23 )164.1214285714296.436321587769625.4992585956697
Winsorized Mean ( 4 / 23 )163.6871428571436.2569404681903926.1608918431158
Winsorized Mean ( 5 / 23 )163.1728571428576.072503592563126.8707716110193
Winsorized Mean ( 6 / 23 )162.7957142857145.9987843612253227.1381174055840
Winsorized Mean ( 7 / 23 )162.8457142857145.9674800857972127.2888575989206
Winsorized Mean ( 8 / 23 )162.1942857142865.8398771526665927.7735783603299
Winsorized Mean ( 9 / 23 )161.8728571428575.7804725610186728.0033951262855
Winsorized Mean ( 10 / 23 )161.5585714285715.7230139060796228.2296311139391
Winsorized Mean ( 11 / 23 )161.1814285714295.6109495485031228.7262302357412
Winsorized Mean ( 12 / 23 )161.1471428571435.5191399401349929.1978722418844
Winsorized Mean ( 13 / 23 )162.1871428571435.3359773161960630.3950210516944
Winsorized Mean ( 14 / 23 )162.5271428571435.2509878480774130.9517270958169
Winsorized Mean ( 15 / 23 )161.824.9662403140749132.5840051560500
Winsorized Mean ( 16 / 23 )163.264.6806745103281434.879588324238
Winsorized Mean ( 17 / 23 )163.0657142857144.5341249852468435.9640977732855
Winsorized Mean ( 18 / 23 )163.0657142857144.4981877582586336.2514245845624
Winsorized Mean ( 19 / 23 )163.0114285714294.2354227133174238.4876409287018
Winsorized Mean ( 20 / 23 )162.9542857142864.2112806635243738.6947104061953
Winsorized Mean ( 21 / 23 )162.6242857142864.1618609648002839.0748963239549
Winsorized Mean ( 22 / 23 )162.4357142857144.0997126777647239.6212434999905
Winsorized Mean ( 23 / 23 )162.5671428571434.0837448416106139.8083497285857
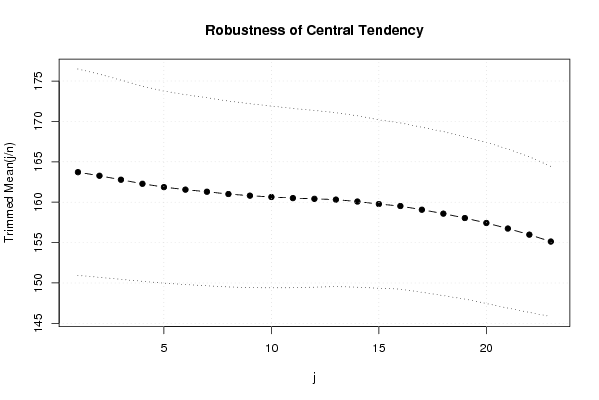
Trimmed Mean ( 1 / 23 )163.7176470588246.3893073337678825.6236926017889
Trimmed Mean ( 2 / 23 )163.2727272727276.2842243543960825.981365092179
Trimmed Mean ( 3 / 23 )162.78281256.1689408430006826.3874815211909
Trimmed Mean ( 4 / 23 )162.2790322580656.036955701880426.8809380541781
Trimmed Mean ( 5 / 23 )161.8683333333335.941697664755427.2427751235971
Trimmed Mean ( 6 / 23 )161.5534482758625.8804202142921727.4731128709495
Trimmed Mean ( 7 / 23 )161.2946428571435.8215483166315527.7064852998542
Trimmed Mean ( 8 / 23 )161.0074074074075.7521094795798527.9910192910946
Trimmed Mean ( 9 / 23 )160.8076923076925.6921500324666828.2507824618963
Trimmed Mean ( 10 / 23 )160.6425.6254299354968128.5563951274798
Trimmed Mean ( 11 / 23 )160.5083333333335.5487098632539928.9271447397692
Trimmed Mean ( 12 / 23 )160.4152173913045.4704051969002729.3241929285607
Trimmed Mean ( 13 / 23 )160.3181818181825.3839626320127729.7769863529398
Trimmed Mean ( 14 / 23 )160.0785714285715.3050022804224930.1750240559412
Trimmed Mean ( 15 / 23 )159.77255.2120151960490430.6546496873446
Trimmed Mean ( 16 / 23 )159.5210526315795.1464403832845330.9963859971444
Trimmed Mean ( 17 / 23 )159.0666666666675.1086807541300831.1365447015006
Trimmed Mean ( 18 / 23 )158.5823529411765.0755284237741131.2445010057211
Trimmed Mean ( 19 / 23 )158.03755.0193732539932931.4855046642067
Trimmed Mean ( 20 / 23 )157.4266666666674.9879600633795931.5613326222188
Trimmed Mean ( 21 / 23 )156.7357142857144.9232689442590531.8357002349996
Trimmed Mean ( 22 / 23 )155.9807692307694.8170690713202232.3808454729132
Trimmed Mean ( 23 / 23 )155.1254.6485319873785133.3707502543144
Median148.2
Midrange178.4
Midmean - Weighted Average at Xnp157.58
Midmean - Weighted Average at X(n+1)p159.066666666667
Midmean - Empirical Distribution Function159.066666666667
Midmean - Empirical Distribution Function - Averaging159.066666666667
Midmean - Empirical Distribution Function - Interpolation158.582352941177
Midmean - Closest Observation159.066666666667
Midmean - True Basic - Statistics Graphics Toolkit159.066666666667
Midmean - MS Excel (old versions)159.066666666667
Number of observations70

\begin{tabular}{lllllllll}
\hline
Central Tendency - Ungrouped Data \tabularnewline
Measure & Value & S.E. & Value/S.E. \tabularnewline
Arithmetic Mean & 164.137142857143 & 6.47731450481766 & 25.3403077363407 \tabularnewline
Geometric Mean & 155.416105949501 &  &  \tabularnewline
Harmonic Mean & 147.142825463845 &  &  \tabularnewline
Quadratic Mean & 172.730826101522 &  &  \tabularnewline
Winsorized Mean ( 1 / 23 ) & 164.137142857143 & 6.47558919081764 & 25.3470592436421 \tabularnewline
Winsorized Mean ( 2 / 23 ) & 164.168571428571 & 6.45555229681903 & 25.4306004940066 \tabularnewline
Winsorized Mean ( 3 / 23 ) & 164.121428571429 & 6.4363215877696 & 25.4992585956697 \tabularnewline
Winsorized Mean ( 4 / 23 ) & 163.687142857143 & 6.25694046819039 & 26.1608918431158 \tabularnewline
Winsorized Mean ( 5 / 23 ) & 163.172857142857 & 6.0725035925631 & 26.8707716110193 \tabularnewline
Winsorized Mean ( 6 / 23 ) & 162.795714285714 & 5.99878436122532 & 27.1381174055840 \tabularnewline
Winsorized Mean ( 7 / 23 ) & 162.845714285714 & 5.96748008579721 & 27.2888575989206 \tabularnewline
Winsorized Mean ( 8 / 23 ) & 162.194285714286 & 5.83987715266659 & 27.7735783603299 \tabularnewline
Winsorized Mean ( 9 / 23 ) & 161.872857142857 & 5.78047256101867 & 28.0033951262855 \tabularnewline
Winsorized Mean ( 10 / 23 ) & 161.558571428571 & 5.72301390607962 & 28.2296311139391 \tabularnewline
Winsorized Mean ( 11 / 23 ) & 161.181428571429 & 5.61094954850312 & 28.7262302357412 \tabularnewline
Winsorized Mean ( 12 / 23 ) & 161.147142857143 & 5.51913994013499 & 29.1978722418844 \tabularnewline
Winsorized Mean ( 13 / 23 ) & 162.187142857143 & 5.33597731619606 & 30.3950210516944 \tabularnewline
Winsorized Mean ( 14 / 23 ) & 162.527142857143 & 5.25098784807741 & 30.9517270958169 \tabularnewline
Winsorized Mean ( 15 / 23 ) & 161.82 & 4.96624031407491 & 32.5840051560500 \tabularnewline
Winsorized Mean ( 16 / 23 ) & 163.26 & 4.68067451032814 & 34.879588324238 \tabularnewline
Winsorized Mean ( 17 / 23 ) & 163.065714285714 & 4.53412498524684 & 35.9640977732855 \tabularnewline
Winsorized Mean ( 18 / 23 ) & 163.065714285714 & 4.49818775825863 & 36.2514245845624 \tabularnewline
Winsorized Mean ( 19 / 23 ) & 163.011428571429 & 4.23542271331742 & 38.4876409287018 \tabularnewline
Winsorized Mean ( 20 / 23 ) & 162.954285714286 & 4.21128066352437 & 38.6947104061953 \tabularnewline
Winsorized Mean ( 21 / 23 ) & 162.624285714286 & 4.16186096480028 & 39.0748963239549 \tabularnewline
Winsorized Mean ( 22 / 23 ) & 162.435714285714 & 4.09971267776472 & 39.6212434999905 \tabularnewline
Winsorized Mean ( 23 / 23 ) & 162.567142857143 & 4.08374484161061 & 39.8083497285857 \tabularnewline
Trimmed Mean ( 1 / 23 ) & 163.717647058824 & 6.38930733376788 & 25.6236926017889 \tabularnewline
Trimmed Mean ( 2 / 23 ) & 163.272727272727 & 6.28422435439608 & 25.981365092179 \tabularnewline
Trimmed Mean ( 3 / 23 ) & 162.7828125 & 6.16894084300068 & 26.3874815211909 \tabularnewline
Trimmed Mean ( 4 / 23 ) & 162.279032258065 & 6.0369557018804 & 26.8809380541781 \tabularnewline
Trimmed Mean ( 5 / 23 ) & 161.868333333333 & 5.9416976647554 & 27.2427751235971 \tabularnewline
Trimmed Mean ( 6 / 23 ) & 161.553448275862 & 5.88042021429217 & 27.4731128709495 \tabularnewline
Trimmed Mean ( 7 / 23 ) & 161.294642857143 & 5.82154831663155 & 27.7064852998542 \tabularnewline
Trimmed Mean ( 8 / 23 ) & 161.007407407407 & 5.75210947957985 & 27.9910192910946 \tabularnewline
Trimmed Mean ( 9 / 23 ) & 160.807692307692 & 5.69215003246668 & 28.2507824618963 \tabularnewline
Trimmed Mean ( 10 / 23 ) & 160.642 & 5.62542993549681 & 28.5563951274798 \tabularnewline
Trimmed Mean ( 11 / 23 ) & 160.508333333333 & 5.54870986325399 & 28.9271447397692 \tabularnewline
Trimmed Mean ( 12 / 23 ) & 160.415217391304 & 5.47040519690027 & 29.3241929285607 \tabularnewline
Trimmed Mean ( 13 / 23 ) & 160.318181818182 & 5.38396263201277 & 29.7769863529398 \tabularnewline
Trimmed Mean ( 14 / 23 ) & 160.078571428571 & 5.30500228042249 & 30.1750240559412 \tabularnewline
Trimmed Mean ( 15 / 23 ) & 159.7725 & 5.21201519604904 & 30.6546496873446 \tabularnewline
Trimmed Mean ( 16 / 23 ) & 159.521052631579 & 5.14644038328453 & 30.9963859971444 \tabularnewline
Trimmed Mean ( 17 / 23 ) & 159.066666666667 & 5.10868075413008 & 31.1365447015006 \tabularnewline
Trimmed Mean ( 18 / 23 ) & 158.582352941176 & 5.07552842377411 & 31.2445010057211 \tabularnewline
Trimmed Mean ( 19 / 23 ) & 158.0375 & 5.01937325399329 & 31.4855046642067 \tabularnewline
Trimmed Mean ( 20 / 23 ) & 157.426666666667 & 4.98796006337959 & 31.5613326222188 \tabularnewline
Trimmed Mean ( 21 / 23 ) & 156.735714285714 & 4.92326894425905 & 31.8357002349996 \tabularnewline
Trimmed Mean ( 22 / 23 ) & 155.980769230769 & 4.81706907132022 & 32.3808454729132 \tabularnewline
Trimmed Mean ( 23 / 23 ) & 155.125 & 4.64853198737851 & 33.3707502543144 \tabularnewline
Median & 148.2 &  &  \tabularnewline
Midrange & 178.4 &  &  \tabularnewline
Midmean - Weighted Average at Xnp & 157.58 &  &  \tabularnewline
Midmean - Weighted Average at X(n+1)p & 159.066666666667 &  &  \tabularnewline
Midmean - Empirical Distribution Function & 159.066666666667 &  &  \tabularnewline
Midmean - Empirical Distribution Function - Averaging & 159.066666666667 &  &  \tabularnewline
Midmean - Empirical Distribution Function - Interpolation & 158.582352941177 &  &  \tabularnewline
Midmean - Closest Observation & 159.066666666667 &  &  \tabularnewline
Midmean - True Basic - Statistics Graphics Toolkit & 159.066666666667 &  &  \tabularnewline
Midmean - MS Excel (old versions) & 159.066666666667 &  &  \tabularnewline
Number of observations & 70 &  &  \tabularnewline
\hline
\end{tabular}
%Source: https://freestatistics.org/blog/index.php?pk=30509&T=1

[TABLE]
[ROW][C]Central Tendency - Ungrouped Data[/C][/ROW]
[ROW][C]Measure[/C][C]Value[/C][C]S.E.[/C][C]Value/S.E.[/C][/ROW]
[ROW][C]Arithmetic Mean[/C][C]164.137142857143[/C][C]6.47731450481766[/C][C]25.3403077363407[/C][/ROW]
[ROW][C]Geometric Mean[/C][C]155.416105949501[/C][C][/C][C][/C][/ROW]
[ROW][C]Harmonic Mean[/C][C]147.142825463845[/C][C][/C][C][/C][/ROW]
[ROW][C]Quadratic Mean[/C][C]172.730826101522[/C][C][/C][C][/C][/ROW]
[ROW][C]Winsorized Mean ( 1 / 23 )[/C][C]164.137142857143[/C][C]6.47558919081764[/C][C]25.3470592436421[/C][/ROW]
[ROW][C]Winsorized Mean ( 2 / 23 )[/C][C]164.168571428571[/C][C]6.45555229681903[/C][C]25.4306004940066[/C][/ROW]
[ROW][C]Winsorized Mean ( 3 / 23 )[/C][C]164.121428571429[/C][C]6.4363215877696[/C][C]25.4992585956697[/C][/ROW]
[ROW][C]Winsorized Mean ( 4 / 23 )[/C][C]163.687142857143[/C][C]6.25694046819039[/C][C]26.1608918431158[/C][/ROW]
[ROW][C]Winsorized Mean ( 5 / 23 )[/C][C]163.172857142857[/C][C]6.0725035925631[/C][C]26.8707716110193[/C][/ROW]
[ROW][C]Winsorized Mean ( 6 / 23 )[/C][C]162.795714285714[/C][C]5.99878436122532[/C][C]27.1381174055840[/C][/ROW]
[ROW][C]Winsorized Mean ( 7 / 23 )[/C][C]162.845714285714[/C][C]5.96748008579721[/C][C]27.2888575989206[/C][/ROW]
[ROW][C]Winsorized Mean ( 8 / 23 )[/C][C]162.194285714286[/C][C]5.83987715266659[/C][C]27.7735783603299[/C][/ROW]
[ROW][C]Winsorized Mean ( 9 / 23 )[/C][C]161.872857142857[/C][C]5.78047256101867[/C][C]28.0033951262855[/C][/ROW]
[ROW][C]Winsorized Mean ( 10 / 23 )[/C][C]161.558571428571[/C][C]5.72301390607962[/C][C]28.2296311139391[/C][/ROW]
[ROW][C]Winsorized Mean ( 11 / 23 )[/C][C]161.181428571429[/C][C]5.61094954850312[/C][C]28.7262302357412[/C][/ROW]
[ROW][C]Winsorized Mean ( 12 / 23 )[/C][C]161.147142857143[/C][C]5.51913994013499[/C][C]29.1978722418844[/C][/ROW]
[ROW][C]Winsorized Mean ( 13 / 23 )[/C][C]162.187142857143[/C][C]5.33597731619606[/C][C]30.3950210516944[/C][/ROW]
[ROW][C]Winsorized Mean ( 14 / 23 )[/C][C]162.527142857143[/C][C]5.25098784807741[/C][C]30.9517270958169[/C][/ROW]
[ROW][C]Winsorized Mean ( 15 / 23 )[/C][C]161.82[/C][C]4.96624031407491[/C][C]32.5840051560500[/C][/ROW]
[ROW][C]Winsorized Mean ( 16 / 23 )[/C][C]163.26[/C][C]4.68067451032814[/C][C]34.879588324238[/C][/ROW]
[ROW][C]Winsorized Mean ( 17 / 23 )[/C][C]163.065714285714[/C][C]4.53412498524684[/C][C]35.9640977732855[/C][/ROW]
[ROW][C]Winsorized Mean ( 18 / 23 )[/C][C]163.065714285714[/C][C]4.49818775825863[/C][C]36.2514245845624[/C][/ROW]
[ROW][C]Winsorized Mean ( 19 / 23 )[/C][C]163.011428571429[/C][C]4.23542271331742[/C][C]38.4876409287018[/C][/ROW]
[ROW][C]Winsorized Mean ( 20 / 23 )[/C][C]162.954285714286[/C][C]4.21128066352437[/C][C]38.6947104061953[/C][/ROW]
[ROW][C]Winsorized Mean ( 21 / 23 )[/C][C]162.624285714286[/C][C]4.16186096480028[/C][C]39.0748963239549[/C][/ROW]
[ROW][C]Winsorized Mean ( 22 / 23 )[/C][C]162.435714285714[/C][C]4.09971267776472[/C][C]39.6212434999905[/C][/ROW]
[ROW][C]Winsorized Mean ( 23 / 23 )[/C][C]162.567142857143[/C][C]4.08374484161061[/C][C]39.8083497285857[/C][/ROW]
[ROW][C]Trimmed Mean ( 1 / 23 )[/C][C]163.717647058824[/C][C]6.38930733376788[/C][C]25.6236926017889[/C][/ROW]
[ROW][C]Trimmed Mean ( 2 / 23 )[/C][C]163.272727272727[/C][C]6.28422435439608[/C][C]25.981365092179[/C][/ROW]
[ROW][C]Trimmed Mean ( 3 / 23 )[/C][C]162.7828125[/C][C]6.16894084300068[/C][C]26.3874815211909[/C][/ROW]
[ROW][C]Trimmed Mean ( 4 / 23 )[/C][C]162.279032258065[/C][C]6.0369557018804[/C][C]26.8809380541781[/C][/ROW]
[ROW][C]Trimmed Mean ( 5 / 23 )[/C][C]161.868333333333[/C][C]5.9416976647554[/C][C]27.2427751235971[/C][/ROW]
[ROW][C]Trimmed Mean ( 6 / 23 )[/C][C]161.553448275862[/C][C]5.88042021429217[/C][C]27.4731128709495[/C][/ROW]
[ROW][C]Trimmed Mean ( 7 / 23 )[/C][C]161.294642857143[/C][C]5.82154831663155[/C][C]27.7064852998542[/C][/ROW]
[ROW][C]Trimmed Mean ( 8 / 23 )[/C][C]161.007407407407[/C][C]5.75210947957985[/C][C]27.9910192910946[/C][/ROW]
[ROW][C]Trimmed Mean ( 9 / 23 )[/C][C]160.807692307692[/C][C]5.69215003246668[/C][C]28.2507824618963[/C][/ROW]
[ROW][C]Trimmed Mean ( 10 / 23 )[/C][C]160.642[/C][C]5.62542993549681[/C][C]28.5563951274798[/C][/ROW]
[ROW][C]Trimmed Mean ( 11 / 23 )[/C][C]160.508333333333[/C][C]5.54870986325399[/C][C]28.9271447397692[/C][/ROW]
[ROW][C]Trimmed Mean ( 12 / 23 )[/C][C]160.415217391304[/C][C]5.47040519690027[/C][C]29.3241929285607[/C][/ROW]
[ROW][C]Trimmed Mean ( 13 / 23 )[/C][C]160.318181818182[/C][C]5.38396263201277[/C][C]29.7769863529398[/C][/ROW]
[ROW][C]Trimmed Mean ( 14 / 23 )[/C][C]160.078571428571[/C][C]5.30500228042249[/C][C]30.1750240559412[/C][/ROW]
[ROW][C]Trimmed Mean ( 15 / 23 )[/C][C]159.7725[/C][C]5.21201519604904[/C][C]30.6546496873446[/C][/ROW]
[ROW][C]Trimmed Mean ( 16 / 23 )[/C][C]159.521052631579[/C][C]5.14644038328453[/C][C]30.9963859971444[/C][/ROW]
[ROW][C]Trimmed Mean ( 17 / 23 )[/C][C]159.066666666667[/C][C]5.10868075413008[/C][C]31.1365447015006[/C][/ROW]
[ROW][C]Trimmed Mean ( 18 / 23 )[/C][C]158.582352941176[/C][C]5.07552842377411[/C][C]31.2445010057211[/C][/ROW]
[ROW][C]Trimmed Mean ( 19 / 23 )[/C][C]158.0375[/C][C]5.01937325399329[/C][C]31.4855046642067[/C][/ROW]
[ROW][C]Trimmed Mean ( 20 / 23 )[/C][C]157.426666666667[/C][C]4.98796006337959[/C][C]31.5613326222188[/C][/ROW]
[ROW][C]Trimmed Mean ( 21 / 23 )[/C][C]156.735714285714[/C][C]4.92326894425905[/C][C]31.8357002349996[/C][/ROW]
[ROW][C]Trimmed Mean ( 22 / 23 )[/C][C]155.980769230769[/C][C]4.81706907132022[/C][C]32.3808454729132[/C][/ROW]
[ROW][C]Trimmed Mean ( 23 / 23 )[/C][C]155.125[/C][C]4.64853198737851[/C][C]33.3707502543144[/C][/ROW]
[ROW][C]Median[/C][C]148.2[/C][C][/C][C][/C][/ROW]
[ROW][C]Midrange[/C][C]178.4[/C][C][/C][C][/C][/ROW]
[ROW][C]Midmean - Weighted Average at Xnp[/C][C]157.58[/C][C][/C][C][/C][/ROW]
[ROW][C]Midmean - Weighted Average at X(n+1)p[/C][C]159.066666666667[/C][C][/C][C][/C][/ROW]
[ROW][C]Midmean - Empirical Distribution Function[/C][C]159.066666666667[/C][C][/C][C][/C][/ROW]
[ROW][C]Midmean - Empirical Distribution Function - Averaging[/C][C]159.066666666667[/C][C][/C][C][/C][/ROW]
[ROW][C]Midmean - Empirical Distribution Function - Interpolation[/C][C]158.582352941177[/C][C][/C][C][/C][/ROW]
[ROW][C]Midmean - Closest Observation[/C][C]159.066666666667[/C][C][/C][C][/C][/ROW]
[ROW][C]Midmean - True Basic - Statistics Graphics Toolkit[/C][C]159.066666666667[/C][C][/C][C][/C][/ROW]
[ROW][C]Midmean - MS Excel (old versions)[/C][C]159.066666666667[/C][C][/C][C][/C][/ROW]
[ROW][C]Number of observations[/C][C]70[/C][C][/C][C][/C][/ROW]
[/TABLE]
Source: https://freestatistics.org/blog/index.php?pk=30509&T=1

Globally Unique Identifier (entire table): ba.freestatistics.org/blog/index.php?pk=30509&T=1

As an alternative you can also use a QR Code:  

The GUIDs for individual cells are displayed in the table below:

Central Tendency - Ungrouped Data
MeasureValueS.E.Value/S.E.
Arithmetic Mean164.1371428571436.4773145048176625.3403077363407
Geometric Mean155.416105949501
Harmonic Mean147.142825463845
Quadratic Mean172.730826101522
Winsorized Mean ( 1 / 23 )164.1371428571436.4755891908176425.3470592436421
Winsorized Mean ( 2 / 23 )164.1685714285716.4555522968190325.4306004940066
Winsorized Mean ( 3 / 23 )164.1214285714296.436321587769625.4992585956697
Winsorized Mean ( 4 / 23 )163.6871428571436.2569404681903926.1608918431158
Winsorized Mean ( 5 / 23 )163.1728571428576.072503592563126.8707716110193
Winsorized Mean ( 6 / 23 )162.7957142857145.9987843612253227.1381174055840
Winsorized Mean ( 7 / 23 )162.8457142857145.9674800857972127.2888575989206
Winsorized Mean ( 8 / 23 )162.1942857142865.8398771526665927.7735783603299
Winsorized Mean ( 9 / 23 )161.8728571428575.7804725610186728.0033951262855
Winsorized Mean ( 10 / 23 )161.5585714285715.7230139060796228.2296311139391
Winsorized Mean ( 11 / 23 )161.1814285714295.6109495485031228.7262302357412
Winsorized Mean ( 12 / 23 )161.1471428571435.5191399401349929.1978722418844
Winsorized Mean ( 13 / 23 )162.1871428571435.3359773161960630.3950210516944
Winsorized Mean ( 14 / 23 )162.5271428571435.2509878480774130.9517270958169
Winsorized Mean ( 15 / 23 )161.824.9662403140749132.5840051560500
Winsorized Mean ( 16 / 23 )163.264.6806745103281434.879588324238
Winsorized Mean ( 17 / 23 )163.0657142857144.5341249852468435.9640977732855
Winsorized Mean ( 18 / 23 )163.0657142857144.4981877582586336.2514245845624
Winsorized Mean ( 19 / 23 )163.0114285714294.2354227133174238.4876409287018
Winsorized Mean ( 20 / 23 )162.9542857142864.2112806635243738.6947104061953
Winsorized Mean ( 21 / 23 )162.6242857142864.1618609648002839.0748963239549
Winsorized Mean ( 22 / 23 )162.4357142857144.0997126777647239.6212434999905
Winsorized Mean ( 23 / 23 )162.5671428571434.0837448416106139.8083497285857
Trimmed Mean ( 1 / 23 )163.7176470588246.3893073337678825.6236926017889
Trimmed Mean ( 2 / 23 )163.2727272727276.2842243543960825.981365092179
Trimmed Mean ( 3 / 23 )162.78281256.1689408430006826.3874815211909
Trimmed Mean ( 4 / 23 )162.2790322580656.036955701880426.8809380541781
Trimmed Mean ( 5 / 23 )161.8683333333335.941697664755427.2427751235971
Trimmed Mean ( 6 / 23 )161.5534482758625.8804202142921727.4731128709495
Trimmed Mean ( 7 / 23 )161.2946428571435.8215483166315527.7064852998542
Trimmed Mean ( 8 / 23 )161.0074074074075.7521094795798527.9910192910946
Trimmed Mean ( 9 / 23 )160.8076923076925.6921500324666828.2507824618963
Trimmed Mean ( 10 / 23 )160.6425.6254299354968128.5563951274798
Trimmed Mean ( 11 / 23 )160.5083333333335.5487098632539928.9271447397692
Trimmed Mean ( 12 / 23 )160.4152173913045.4704051969002729.3241929285607
Trimmed Mean ( 13 / 23 )160.3181818181825.3839626320127729.7769863529398
Trimmed Mean ( 14 / 23 )160.0785714285715.3050022804224930.1750240559412
Trimmed Mean ( 15 / 23 )159.77255.2120151960490430.6546496873446
Trimmed Mean ( 16 / 23 )159.5210526315795.1464403832845330.9963859971444
Trimmed Mean ( 17 / 23 )159.0666666666675.1086807541300831.1365447015006
Trimmed Mean ( 18 / 23 )158.5823529411765.0755284237741131.2445010057211
Trimmed Mean ( 19 / 23 )158.03755.0193732539932931.4855046642067
Trimmed Mean ( 20 / 23 )157.4266666666674.9879600633795931.5613326222188
Trimmed Mean ( 21 / 23 )156.7357142857144.9232689442590531.8357002349996
Trimmed Mean ( 22 / 23 )155.9807692307694.8170690713202232.3808454729132
Trimmed Mean ( 23 / 23 )155.1254.6485319873785133.3707502543144
Median148.2
Midrange178.4
Midmean - Weighted Average at Xnp157.58
Midmean - Weighted Average at X(n+1)p159.066666666667
Midmean - Empirical Distribution Function159.066666666667
Midmean - Empirical Distribution Function - Averaging159.066666666667
Midmean - Empirical Distribution Function - Interpolation158.582352941177
Midmean - Closest Observation159.066666666667
Midmean - True Basic - Statistics Graphics Toolkit159.066666666667
Midmean - MS Excel (old versions)159.066666666667
Number of observations70


Parameters (Session):
Parameters (R input):
R code (references can be found in the software module):
geomean <- function(x) {
return(exp(mean(log(x))))
}
harmean <- function(x) {
return(1/mean(1/x))
}
quamean <- function(x) {
return(sqrt(mean(x*x)))
}
winmean <- function(x) {
x <-sort(x[!is.na(x)])
n<-length(x)
denom <- 3
nodenom <- n/denom
if (nodenom>40) denom <- n/40
sqrtn = sqrt(n)
roundnodenom = floor(nodenom)
win <- array(NA,dim=c(roundnodenom,2))
for (j in 1:roundnodenom) {
win[j,1] <- (j*x[j+1]+sum(x[(j+1):(n-j)])+j*x[n-j])/n
win[j,2] <- sd(c(rep(x[j+1],j),x[(j+1):(n-j)],rep(x[n-j],j)))/sqrtn
}
return(win)
}
trimean <- function(x) {
x <-sort(x[!is.na(x)])
n<-length(x)
denom <- 3
nodenom <- n/denom
if (nodenom>40) denom <- n/40
sqrtn = sqrt(n)
roundnodenom = floor(nodenom)
tri <- array(NA,dim=c(roundnodenom,2))
for (j in 1:roundnodenom) {
tri[j,1] <- mean(x,trim=j/n)
tri[j,2] <- sd(x[(j+1):(n-j)]) / sqrt(n-j*2)
}
return(tri)
}
midrange <- function(x) {
return((max(x)+min(x))/2)
}
q1 <- function(data,n,p,i,f) {
np <- n*p;
i <<- floor(np)
f <<- np - i
qvalue <- (1-f)*data[i] + f*data[i+1]
}
q2 <- function(data,n,p,i,f) {
np <- (n+1)*p
i <<- floor(np)
f <<- np - i
qvalue <- (1-f)*data[i] + f*data[i+1]
}
q3 <- function(data,n,p,i,f) {
np <- n*p
i <<- floor(np)
f <<- np - i
if (f==0) {
qvalue <- data[i]
} else {
qvalue <- data[i+1]
}
}
q4 <- function(data,n,p,i,f) {
np <- n*p
i <<- floor(np)
f <<- np - i
if (f==0) {
qvalue <- (data[i]+data[i+1])/2
} else {
qvalue <- data[i+1]
}
}
q5 <- function(data,n,p,i,f) {
np <- (n-1)*p
i <<- floor(np)
f <<- np - i
if (f==0) {
qvalue <- data[i+1]
} else {
qvalue <- data[i+1] + f*(data[i+2]-data[i+1])
}
}
q6 <- function(data,n,p,i,f) {
np <- n*p+0.5
i <<- floor(np)
f <<- np - i
qvalue <- data[i]
}
q7 <- function(data,n,p,i,f) {
np <- (n+1)*p
i <<- floor(np)
f <<- np - i
if (f==0) {
qvalue <- data[i]
} else {
qvalue <- f*data[i] + (1-f)*data[i+1]
}
}
q8 <- function(data,n,p,i,f) {
np <- (n+1)*p
i <<- floor(np)
f <<- np - i
if (f==0) {
qvalue <- data[i]
} else {
if (f == 0.5) {
qvalue <- (data[i]+data[i+1])/2
} else {
if (f < 0.5) {
qvalue <- data[i]
} else {
qvalue <- data[i+1]
}
}
}
}
midmean <- function(x,def) {
x <-sort(x[!is.na(x)])
n<-length(x)
if (def==1) {
qvalue1 <- q1(x,n,0.25,i,f)
qvalue3 <- q1(x,n,0.75,i,f)
}
if (def==2) {
qvalue1 <- q2(x,n,0.25,i,f)
qvalue3 <- q2(x,n,0.75,i,f)
}
if (def==3) {
qvalue1 <- q3(x,n,0.25,i,f)
qvalue3 <- q3(x,n,0.75,i,f)
}
if (def==4) {
qvalue1 <- q4(x,n,0.25,i,f)
qvalue3 <- q4(x,n,0.75,i,f)
}
if (def==5) {
qvalue1 <- q5(x,n,0.25,i,f)
qvalue3 <- q5(x,n,0.75,i,f)
}
if (def==6) {
qvalue1 <- q6(x,n,0.25,i,f)
qvalue3 <- q6(x,n,0.75,i,f)
}
if (def==7) {
qvalue1 <- q7(x,n,0.25,i,f)
qvalue3 <- q7(x,n,0.75,i,f)
}
if (def==8) {
qvalue1 <- q8(x,n,0.25,i,f)
qvalue3 <- q8(x,n,0.75,i,f)
}
midm <- 0
myn <- 0
roundno4 <- round(n/4)
round3no4 <- round(3*n/4)
for (i in 1:n) {
if ((x[i]>=qvalue1) & (x[i]<=qvalue3)){
midm = midm + x[i]
myn = myn + 1
}
}
midm = midm / myn
return(midm)
}
(arm <- mean(x))
sqrtn <- sqrt(length(x))
(armse <- sd(x) / sqrtn)
(armose <- arm / armse)
(geo <- geomean(x))
(har <- harmean(x))
(qua <- quamean(x))
(win <- winmean(x))
(tri <- trimean(x))
(midr <- midrange(x))
midm <- array(NA,dim=8)
for (j in 1:8) midm[j] <- midmean(x,j)
midm
bitmap(file='test1.png')
lb <- win[,1] - 2*win[,2]
ub <- win[,1] + 2*win[,2]
if ((ylimmin == '') | (ylimmax == '')) plot(win[,1],type='b',main=main, xlab='j', pch=19, ylab='Winsorized Mean(j/n)', ylim=c(min(lb),max(ub))) else plot(win[,1],type='l',main=main, xlab='j', pch=19, ylab='Winsorized Mean(j/n)', ylim=c(ylimmin,ylimmax))
lines(ub,lty=3)
lines(lb,lty=3)
grid()
dev.off()
bitmap(file='test2.png')
lb <- tri[,1] - 2*tri[,2]
ub <- tri[,1] + 2*tri[,2]
if ((ylimmin == '') | (ylimmax == '')) plot(tri[,1],type='b',main=main, xlab='j', pch=19, ylab='Trimmed Mean(j/n)', ylim=c(min(lb),max(ub))) else plot(tri[,1],type='l',main=main, xlab='j', pch=19, ylab='Trimmed Mean(j/n)', ylim=c(ylimmin,ylimmax))
lines(ub,lty=3)
lines(lb,lty=3)
grid()
dev.off()
load(file='createtable')
a<-table.start()
a<-table.row.start(a)
a<-table.element(a,'Central Tendency - Ungrouped Data',4,TRUE)
a<-table.row.end(a)
a<-table.row.start(a)
a<-table.element(a,'Measure',header=TRUE)
a<-table.element(a,'Value',header=TRUE)
a<-table.element(a,'S.E.',header=TRUE)
a<-table.element(a,'Value/S.E.',header=TRUE)
a<-table.row.end(a)
a<-table.row.start(a)
a<-table.element(a,hyperlink('arithmetic_mean.htm', 'Arithmetic Mean', 'click to view the definition of the Arithmetic Mean'),header=TRUE)
a<-table.element(a,arm)
a<-table.element(a,hyperlink('arithmetic_mean_standard_error.htm', armse, 'click to view the definition of the Standard Error of the Arithmetic Mean'))
a<-table.element(a,armose)
a<-table.row.end(a)
a<-table.row.start(a)
a<-table.element(a,hyperlink('geometric_mean.htm', 'Geometric Mean', 'click to view the definition of the Geometric Mean'),header=TRUE)
a<-table.element(a,geo)
a<-table.element(a,'')
a<-table.row.end(a)
a<-table.row.start(a)
a<-table.element(a,hyperlink('harmonic_mean.htm', 'Harmonic Mean', 'click to view the definition of the Harmonic Mean'),header=TRUE)
a<-table.element(a,har)
a<-table.element(a,'')
a<-table.row.end(a)
a<-table.row.start(a)
a<-table.element(a,hyperlink('quadratic_mean.htm', 'Quadratic Mean', 'click to view the definition of the Quadratic Mean'),header=TRUE)
a<-table.element(a,qua)
a<-table.element(a,'')
a<-table.row.end(a)
for (j in 1:length(win[,1])) {
a<-table.row.start(a)
mylabel <- paste('Winsorized Mean (',j)
mylabel <- paste(mylabel,'/')
mylabel <- paste(mylabel,length(win[,1]))
mylabel <- paste(mylabel,')')
a<-table.element(a,hyperlink('winsorized_mean.htm', mylabel, 'click to view the definition of the Winsorized Mean'),header=TRUE)
a<-table.element(a,win[j,1])
a<-table.element(a,win[j,2])
a<-table.element(a,win[j,1]/win[j,2])
a<-table.row.end(a)
}
for (j in 1:length(tri[,1])) {
a<-table.row.start(a)
mylabel <- paste('Trimmed Mean (',j)
mylabel <- paste(mylabel,'/')
mylabel <- paste(mylabel,length(tri[,1]))
mylabel <- paste(mylabel,')')
a<-table.element(a,hyperlink('arithmetic_mean.htm', mylabel, 'click to view the definition of the Trimmed Mean'),header=TRUE)
a<-table.element(a,tri[j,1])
a<-table.element(a,tri[j,2])
a<-table.element(a,tri[j,1]/tri[j,2])
a<-table.row.end(a)
}
a<-table.row.start(a)
a<-table.element(a,hyperlink('median_1.htm', 'Median', 'click to view the definition of the Median'),header=TRUE)
a<-table.element(a,median(x))
a<-table.element(a,'')
a<-table.row.end(a)
a<-table.row.start(a)
a<-table.element(a,hyperlink('midrange.htm', 'Midrange', 'click to view the definition of the Midrange'),header=TRUE)
a<-table.element(a,midr)
a<-table.element(a,'')
a<-table.row.end(a)
a<-table.row.start(a)
mymid <- hyperlink('midmean.htm', 'Midmean', 'click to view the definition of the Midmean')
mylabel <- paste(mymid,hyperlink('method_1.htm','Weighted Average at Xnp',''),sep=' - ')
a<-table.element(a,mylabel,header=TRUE)
a<-table.element(a,midm[1])
a<-table.element(a,'')
a<-table.row.end(a)
a<-table.row.start(a)
mymid <- hyperlink('midmean.htm', 'Midmean', 'click to view the definition of the Midmean')
mylabel <- paste(mymid,hyperlink('method_2.htm','Weighted Average at X(n+1)p',''),sep=' - ')
a<-table.element(a,mylabel,header=TRUE)
a<-table.element(a,midm[2])
a<-table.element(a,'')
a<-table.row.end(a)
a<-table.row.start(a)
mymid <- hyperlink('midmean.htm', 'Midmean', 'click to view the definition of the Midmean')
mylabel <- paste(mymid,hyperlink('method_3.htm','Empirical Distribution Function',''),sep=' - ')
a<-table.element(a,mylabel,header=TRUE)
a<-table.element(a,midm[3])
a<-table.element(a,'')
a<-table.row.end(a)
a<-table.row.start(a)
mymid <- hyperlink('midmean.htm', 'Midmean', 'click to view the definition of the Midmean')
mylabel <- paste(mymid,hyperlink('method_4.htm','Empirical Distribution Function - Averaging',''),sep=' - ')
a<-table.element(a,mylabel,header=TRUE)
a<-table.element(a,midm[4])
a<-table.element(a,'')
a<-table.row.end(a)
a<-table.row.start(a)
mymid <- hyperlink('midmean.htm', 'Midmean', 'click to view the definition of the Midmean')
mylabel <- paste(mymid,hyperlink('method_5.htm','Empirical Distribution Function - Interpolation',''),sep=' - ')
a<-table.element(a,mylabel,header=TRUE)
a<-table.element(a,midm[5])
a<-table.element(a,'')
a<-table.row.end(a)
a<-table.row.start(a)
mymid <- hyperlink('midmean.htm', 'Midmean', 'click to view the definition of the Midmean')
mylabel <- paste(mymid,hyperlink('method_6.htm','Closest Observation',''),sep=' - ')
a<-table.element(a,mylabel,header=TRUE)
a<-table.element(a,midm[6])
a<-table.element(a,'')
a<-table.row.end(a)
a<-table.row.start(a)
mymid <- hyperlink('midmean.htm', 'Midmean', 'click to view the definition of the Midmean')
mylabel <- paste(mymid,hyperlink('method_7.htm','True Basic - Statistics Graphics Toolkit',''),sep=' - ')
a<-table.element(a,mylabel,header=TRUE)
a<-table.element(a,midm[7])
a<-table.element(a,'')
a<-table.row.end(a)
a<-table.row.start(a)
mymid <- hyperlink('midmean.htm', 'Midmean', 'click to view the definition of the Midmean')
mylabel <- paste(mymid,hyperlink('method_8.htm','MS Excel (old versions)',''),sep=' - ')
a<-table.element(a,mylabel,header=TRUE)
a<-table.element(a,midm[8])
a<-table.element(a,'')
a<-table.row.end(a)
a<-table.row.start(a)
a<-table.element(a,'Number of observations',header=TRUE)
a<-table.element(a,length(x))
a<-table.element(a,'')
a<-table.row.end(a)
a<-table.end(a)
table.save(a,file='mytable.tab')