Free Statistics

of Irreproducible Research!

Author's title

Author*The author of this computation has been verified*
R Software Modulerwasp_centraltendency.wasp
Title produced by softwareCentral Tendency
Date of computationMon, 08 Dec 2008 07:13:32 -0700
Cite this page as followsStatistical Computations at FreeStatistics.org, Office for Research Development and Education, URL https://freestatistics.org/blog/index.php?v=date/2008/Dec/08/t1228745648uhbm06bl0x1489t.htm/, Retrieved Thu, 16 May 2024 19:51:42 +0000
Statistical Computations at FreeStatistics.org, Office for Research Development and Education, URL https://freestatistics.org/blog/index.php?pk=30507, Retrieved Thu, 16 May 2024 19:51:42 +0000
QR Codes:

Original text written by user:
IsPrivate?No (this computation is public)
User-defined keywords
Estimated Impact147
Family? (F = Feedback message, R = changed R code, M = changed R Module, P = changed Parameters, D = changed Data)
-       [Central Tendency] [] [2008-12-08 14:13:32] [28deb8481dba3cc87d2d53a86e0e0d0b] [Current]
Feedback Forum

Post a new message
Dataseries X:
2187
1852
1570
1851
1954
1828
2251
2277
2085
2282
2266
1878
2267
2069
1746
2299
2360
2214
2825
2355
2333
3016
2155
2172
2150
2533
2058
2160
2259
2498
2695
2799
2945
2930
2318
2540
2570
2669
2450
2842
3439
2677
2979
2257
2842
2546
2455
2293
2379
2478
2054
2272
2351
2271
2542
2304
2194
2722
2395
2146
1894
2548
2087
2063
2481
2476
2212
2834
2148
2598


Summary of computational transaction
Raw Inputview raw input (R code)
Raw Outputview raw output of R engine
Computing time1 seconds
R Server'Gwilym Jenkins' @ 72.249.127.135

\begin{tabular}{lllllllll}
\hline
Summary of computational transaction \tabularnewline
Raw Input & view raw input (R code)  \tabularnewline
Raw Output & view raw output of R engine  \tabularnewline
Computing time & 1 seconds \tabularnewline
R Server & 'Gwilym Jenkins' @ 72.249.127.135 \tabularnewline
\hline
\end{tabular}
%Source: https://freestatistics.org/blog/index.php?pk=30507&T=0

[TABLE]
[ROW][C]Summary of computational transaction[/C][/ROW]
[ROW][C]Raw Input[/C][C]view raw input (R code) [/C][/ROW]
[ROW][C]Raw Output[/C][C]view raw output of R engine [/C][/ROW]
[ROW][C]Computing time[/C][C]1 seconds[/C][/ROW]
[ROW][C]R Server[/C][C]'Gwilym Jenkins' @ 72.249.127.135[/C][/ROW]
[/TABLE]
Source: https://freestatistics.org/blog/index.php?pk=30507&T=0

Globally Unique Identifier (entire table): ba.freestatistics.org/blog/index.php?pk=30507&T=0

As an alternative you can also use a QR Code:  

The GUIDs for individual cells are displayed in the table below:

Summary of computational transaction
Raw Inputview raw input (R code)
Raw Outputview raw output of R engine
Computing time1 seconds
R Server'Gwilym Jenkins' @ 72.249.127.135


Central Tendency - Ungrouped Data
MeasureValueS.E.Value/S.E.
Arithmetic Mean2363.540.433892830656258.4534368209048
Geometric Mean2339.95493093928
Harmonic Mean2316.54361189767
Quadratic Mean2387.24534318771
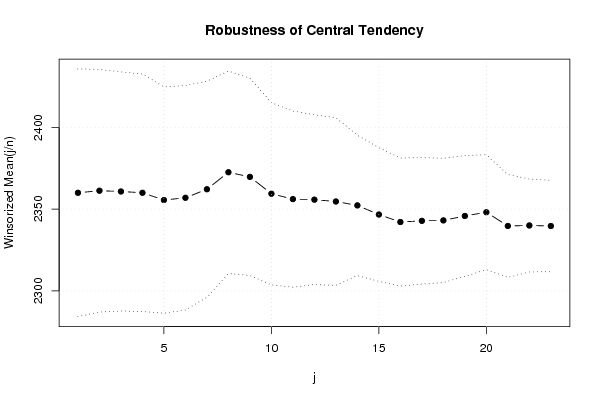
Winsorized Mean ( 1 / 23 )2359.9714285714337.841376301951762.3648413244873
Winsorized Mean ( 2 / 23 )2361.2571428571437.060773130868163.713110747019
Winsorized Mean ( 3 / 23 )2360.7857142857136.513248923353564.655591707036
Winsorized Mean ( 4 / 23 )2359.9857142857136.304768680248565.0048409637618
Winsorized Mean ( 5 / 23 )2355.5571428571434.572674592127268.1334947511854
Winsorized Mean ( 6 / 23 )2356.9285714285734.301267391904368.7125797568881
Winsorized Mean ( 7 / 23 )2362.1285714285733.011177738214771.5554164762228
Winsorized Mean ( 8 / 23 )2372.5285714285730.912805452825176.7490538847793
Winsorized Mean ( 9 / 23 )2369.730.136104990800778.6332540560026
Winsorized Mean ( 10 / 23 )2359.4142857142927.850439762630484.7173080864648
Winsorized Mean ( 11 / 23 )2356.1142857142926.917268717690387.531699832748
Winsorized Mean ( 12 / 23 )2355.7714285714325.939196073338290.8189838232043
Winsorized Mean ( 13 / 23 )2354.6571428571425.61753965098791.9158191979776
Winsorized Mean ( 14 / 23 )2352.2571428571421.4464008641688109.68074120013
Winsorized Mean ( 15 / 23 )2346.6857142857120.4118925962571114.966591325099
Winsorized Mean ( 16 / 23 )2342.1142857142919.5646885070979119.711299511085
Winsorized Mean ( 17 / 23 )2342.8428571428619.3186704843081121.273503735460
Winsorized Mean ( 18 / 23 )2343.118.9817188940810123.439821918901
Winsorized Mean ( 19 / 23 )2345.8142857142918.4489816677920127.151423745494
Winsorized Mean ( 20 / 23 )2348.117.566297370608133.670741788127
Winsorized Mean ( 21 / 23 )2339.715.7165939392656148.868133199943
Winsorized Mean ( 22 / 23 )2340.0142857142914.1913934909933164.889676774828
Winsorized Mean ( 23 / 23 )2339.6857142857113.9638626010147167.552902884886
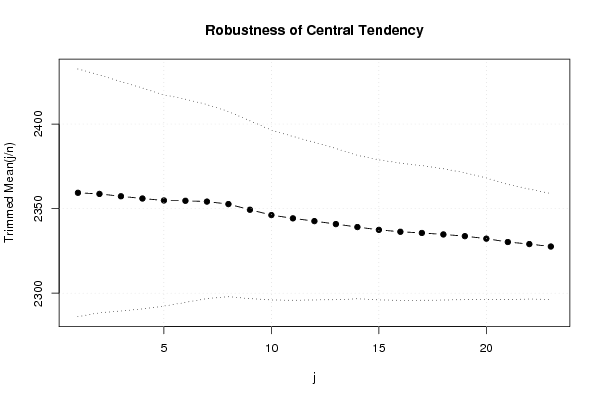
Trimmed Mean ( 1 / 23 )2359.3529411764736.618041082323264.4314352008145
Trimmed Mean ( 2 / 23 )2358.6969696969735.154132608923367.0958659665023
Trimmed Mean ( 3 / 23 )2357.29687533.905423136999269.5256586380014
Trimmed Mean ( 4 / 23 )2355.9838709677432.656323730730772.1447977547663
Trimmed Mean ( 5 / 23 )2354.8166666666731.216769827381975.4343476178989
Trimmed Mean ( 6 / 23 )2354.6379310344830.048254177476878.3618880859787
Trimmed Mean ( 7 / 23 )2354.1607142857128.690339303350482.0541259339794
Trimmed Mean ( 8 / 23 )2352.6851851851927.375061772348385.9426438833335
Trimmed Mean ( 9 / 23 )2349.3461538461526.282286538328389.3889559578473
Trimmed Mean ( 10 / 23 )2346.1825.106462132612993.4492477517311
Trimmed Mean ( 11 / 23 )2344.2524.213780804555696.8147031197604
Trimmed Mean ( 12 / 23 )2342.6086956521723.3001519403905100.540490106903
Trimmed Mean ( 13 / 23 )2340.8636363636422.3545709036083104.715212224708
Trimmed Mean ( 14 / 23 )2339.0952380952421.1903548261542110.384901870931
Trimmed Mean ( 15 / 23 )2337.4520.7055966050059112.889768142923
Trimmed Mean ( 16 / 23 )2336.3157894736820.2892702747856115.150311363200
Trimmed Mean ( 17 / 23 )2335.6111111111119.9054223201243117.335421150538
Trimmed Mean ( 18 / 23 )2334.7352941176519.4013482828760120.338816667619
Trimmed Mean ( 19 / 23 )2333.7187518.751625433578124.454211090473
Trimmed Mean ( 20 / 23 )2332.2333333333317.9411351230048129.993632919182
Trimmed Mean ( 21 / 23 )2330.2517.0017603352522137.059337036316
Trimmed Mean ( 22 / 23 )2329.0384615384616.2569256975633143.264384968405
Trimmed Mean ( 23 / 23 )2327.5833333333315.6354433698562148.865835030986
Median2301.5
Midrange2504.5
Midmean - Weighted Average at Xnp2329.6
Midmean - Weighted Average at X(n+1)p2335.61111111111
Midmean - Empirical Distribution Function2335.61111111111
Midmean - Empirical Distribution Function - Averaging2335.61111111111
Midmean - Empirical Distribution Function - Interpolation2334.73529411765
Midmean - Closest Observation2335.61111111111
Midmean - True Basic - Statistics Graphics Toolkit2335.61111111111
Midmean - MS Excel (old versions)2335.61111111111
Number of observations70

\begin{tabular}{lllllllll}
\hline
Central Tendency - Ungrouped Data \tabularnewline
Measure & Value & S.E. & Value/S.E. \tabularnewline
Arithmetic Mean & 2363.5 & 40.4338928306562 & 58.4534368209048 \tabularnewline
Geometric Mean & 2339.95493093928 &  &  \tabularnewline
Harmonic Mean & 2316.54361189767 &  &  \tabularnewline
Quadratic Mean & 2387.24534318771 &  &  \tabularnewline
Winsorized Mean ( 1 / 23 ) & 2359.97142857143 & 37.8413763019517 & 62.3648413244873 \tabularnewline
Winsorized Mean ( 2 / 23 ) & 2361.25714285714 & 37.0607731308681 & 63.713110747019 \tabularnewline
Winsorized Mean ( 3 / 23 ) & 2360.78571428571 & 36.5132489233535 & 64.655591707036 \tabularnewline
Winsorized Mean ( 4 / 23 ) & 2359.98571428571 & 36.3047686802485 & 65.0048409637618 \tabularnewline
Winsorized Mean ( 5 / 23 ) & 2355.55714285714 & 34.5726745921272 & 68.1334947511854 \tabularnewline
Winsorized Mean ( 6 / 23 ) & 2356.92857142857 & 34.3012673919043 & 68.7125797568881 \tabularnewline
Winsorized Mean ( 7 / 23 ) & 2362.12857142857 & 33.0111777382147 & 71.5554164762228 \tabularnewline
Winsorized Mean ( 8 / 23 ) & 2372.52857142857 & 30.9128054528251 & 76.7490538847793 \tabularnewline
Winsorized Mean ( 9 / 23 ) & 2369.7 & 30.1361049908007 & 78.6332540560026 \tabularnewline
Winsorized Mean ( 10 / 23 ) & 2359.41428571429 & 27.8504397626304 & 84.7173080864648 \tabularnewline
Winsorized Mean ( 11 / 23 ) & 2356.11428571429 & 26.9172687176903 & 87.531699832748 \tabularnewline
Winsorized Mean ( 12 / 23 ) & 2355.77142857143 & 25.9391960733382 & 90.8189838232043 \tabularnewline
Winsorized Mean ( 13 / 23 ) & 2354.65714285714 & 25.617539650987 & 91.9158191979776 \tabularnewline
Winsorized Mean ( 14 / 23 ) & 2352.25714285714 & 21.4464008641688 & 109.68074120013 \tabularnewline
Winsorized Mean ( 15 / 23 ) & 2346.68571428571 & 20.4118925962571 & 114.966591325099 \tabularnewline
Winsorized Mean ( 16 / 23 ) & 2342.11428571429 & 19.5646885070979 & 119.711299511085 \tabularnewline
Winsorized Mean ( 17 / 23 ) & 2342.84285714286 & 19.3186704843081 & 121.273503735460 \tabularnewline
Winsorized Mean ( 18 / 23 ) & 2343.1 & 18.9817188940810 & 123.439821918901 \tabularnewline
Winsorized Mean ( 19 / 23 ) & 2345.81428571429 & 18.4489816677920 & 127.151423745494 \tabularnewline
Winsorized Mean ( 20 / 23 ) & 2348.1 & 17.566297370608 & 133.670741788127 \tabularnewline
Winsorized Mean ( 21 / 23 ) & 2339.7 & 15.7165939392656 & 148.868133199943 \tabularnewline
Winsorized Mean ( 22 / 23 ) & 2340.01428571429 & 14.1913934909933 & 164.889676774828 \tabularnewline
Winsorized Mean ( 23 / 23 ) & 2339.68571428571 & 13.9638626010147 & 167.552902884886 \tabularnewline
Trimmed Mean ( 1 / 23 ) & 2359.35294117647 & 36.6180410823232 & 64.4314352008145 \tabularnewline
Trimmed Mean ( 2 / 23 ) & 2358.69696969697 & 35.1541326089233 & 67.0958659665023 \tabularnewline
Trimmed Mean ( 3 / 23 ) & 2357.296875 & 33.9054231369992 & 69.5256586380014 \tabularnewline
Trimmed Mean ( 4 / 23 ) & 2355.98387096774 & 32.6563237307307 & 72.1447977547663 \tabularnewline
Trimmed Mean ( 5 / 23 ) & 2354.81666666667 & 31.2167698273819 & 75.4343476178989 \tabularnewline
Trimmed Mean ( 6 / 23 ) & 2354.63793103448 & 30.0482541774768 & 78.3618880859787 \tabularnewline
Trimmed Mean ( 7 / 23 ) & 2354.16071428571 & 28.6903393033504 & 82.0541259339794 \tabularnewline
Trimmed Mean ( 8 / 23 ) & 2352.68518518519 & 27.3750617723483 & 85.9426438833335 \tabularnewline
Trimmed Mean ( 9 / 23 ) & 2349.34615384615 & 26.2822865383283 & 89.3889559578473 \tabularnewline
Trimmed Mean ( 10 / 23 ) & 2346.18 & 25.1064621326129 & 93.4492477517311 \tabularnewline
Trimmed Mean ( 11 / 23 ) & 2344.25 & 24.2137808045556 & 96.8147031197604 \tabularnewline
Trimmed Mean ( 12 / 23 ) & 2342.60869565217 & 23.3001519403905 & 100.540490106903 \tabularnewline
Trimmed Mean ( 13 / 23 ) & 2340.86363636364 & 22.3545709036083 & 104.715212224708 \tabularnewline
Trimmed Mean ( 14 / 23 ) & 2339.09523809524 & 21.1903548261542 & 110.384901870931 \tabularnewline
Trimmed Mean ( 15 / 23 ) & 2337.45 & 20.7055966050059 & 112.889768142923 \tabularnewline
Trimmed Mean ( 16 / 23 ) & 2336.31578947368 & 20.2892702747856 & 115.150311363200 \tabularnewline
Trimmed Mean ( 17 / 23 ) & 2335.61111111111 & 19.9054223201243 & 117.335421150538 \tabularnewline
Trimmed Mean ( 18 / 23 ) & 2334.73529411765 & 19.4013482828760 & 120.338816667619 \tabularnewline
Trimmed Mean ( 19 / 23 ) & 2333.71875 & 18.751625433578 & 124.454211090473 \tabularnewline
Trimmed Mean ( 20 / 23 ) & 2332.23333333333 & 17.9411351230048 & 129.993632919182 \tabularnewline
Trimmed Mean ( 21 / 23 ) & 2330.25 & 17.0017603352522 & 137.059337036316 \tabularnewline
Trimmed Mean ( 22 / 23 ) & 2329.03846153846 & 16.2569256975633 & 143.264384968405 \tabularnewline
Trimmed Mean ( 23 / 23 ) & 2327.58333333333 & 15.6354433698562 & 148.865835030986 \tabularnewline
Median & 2301.5 &  &  \tabularnewline
Midrange & 2504.5 &  &  \tabularnewline
Midmean - Weighted Average at Xnp & 2329.6 &  &  \tabularnewline
Midmean - Weighted Average at X(n+1)p & 2335.61111111111 &  &  \tabularnewline
Midmean - Empirical Distribution Function & 2335.61111111111 &  &  \tabularnewline
Midmean - Empirical Distribution Function - Averaging & 2335.61111111111 &  &  \tabularnewline
Midmean - Empirical Distribution Function - Interpolation & 2334.73529411765 &  &  \tabularnewline
Midmean - Closest Observation & 2335.61111111111 &  &  \tabularnewline
Midmean - True Basic - Statistics Graphics Toolkit & 2335.61111111111 &  &  \tabularnewline
Midmean - MS Excel (old versions) & 2335.61111111111 &  &  \tabularnewline
Number of observations & 70 &  &  \tabularnewline
\hline
\end{tabular}
%Source: https://freestatistics.org/blog/index.php?pk=30507&T=1

[TABLE]
[ROW][C]Central Tendency - Ungrouped Data[/C][/ROW]
[ROW][C]Measure[/C][C]Value[/C][C]S.E.[/C][C]Value/S.E.[/C][/ROW]
[ROW][C]Arithmetic Mean[/C][C]2363.5[/C][C]40.4338928306562[/C][C]58.4534368209048[/C][/ROW]
[ROW][C]Geometric Mean[/C][C]2339.95493093928[/C][C][/C][C][/C][/ROW]
[ROW][C]Harmonic Mean[/C][C]2316.54361189767[/C][C][/C][C][/C][/ROW]
[ROW][C]Quadratic Mean[/C][C]2387.24534318771[/C][C][/C][C][/C][/ROW]
[ROW][C]Winsorized Mean ( 1 / 23 )[/C][C]2359.97142857143[/C][C]37.8413763019517[/C][C]62.3648413244873[/C][/ROW]
[ROW][C]Winsorized Mean ( 2 / 23 )[/C][C]2361.25714285714[/C][C]37.0607731308681[/C][C]63.713110747019[/C][/ROW]
[ROW][C]Winsorized Mean ( 3 / 23 )[/C][C]2360.78571428571[/C][C]36.5132489233535[/C][C]64.655591707036[/C][/ROW]
[ROW][C]Winsorized Mean ( 4 / 23 )[/C][C]2359.98571428571[/C][C]36.3047686802485[/C][C]65.0048409637618[/C][/ROW]
[ROW][C]Winsorized Mean ( 5 / 23 )[/C][C]2355.55714285714[/C][C]34.5726745921272[/C][C]68.1334947511854[/C][/ROW]
[ROW][C]Winsorized Mean ( 6 / 23 )[/C][C]2356.92857142857[/C][C]34.3012673919043[/C][C]68.7125797568881[/C][/ROW]
[ROW][C]Winsorized Mean ( 7 / 23 )[/C][C]2362.12857142857[/C][C]33.0111777382147[/C][C]71.5554164762228[/C][/ROW]
[ROW][C]Winsorized Mean ( 8 / 23 )[/C][C]2372.52857142857[/C][C]30.9128054528251[/C][C]76.7490538847793[/C][/ROW]
[ROW][C]Winsorized Mean ( 9 / 23 )[/C][C]2369.7[/C][C]30.1361049908007[/C][C]78.6332540560026[/C][/ROW]
[ROW][C]Winsorized Mean ( 10 / 23 )[/C][C]2359.41428571429[/C][C]27.8504397626304[/C][C]84.7173080864648[/C][/ROW]
[ROW][C]Winsorized Mean ( 11 / 23 )[/C][C]2356.11428571429[/C][C]26.9172687176903[/C][C]87.531699832748[/C][/ROW]
[ROW][C]Winsorized Mean ( 12 / 23 )[/C][C]2355.77142857143[/C][C]25.9391960733382[/C][C]90.8189838232043[/C][/ROW]
[ROW][C]Winsorized Mean ( 13 / 23 )[/C][C]2354.65714285714[/C][C]25.617539650987[/C][C]91.9158191979776[/C][/ROW]
[ROW][C]Winsorized Mean ( 14 / 23 )[/C][C]2352.25714285714[/C][C]21.4464008641688[/C][C]109.68074120013[/C][/ROW]
[ROW][C]Winsorized Mean ( 15 / 23 )[/C][C]2346.68571428571[/C][C]20.4118925962571[/C][C]114.966591325099[/C][/ROW]
[ROW][C]Winsorized Mean ( 16 / 23 )[/C][C]2342.11428571429[/C][C]19.5646885070979[/C][C]119.711299511085[/C][/ROW]
[ROW][C]Winsorized Mean ( 17 / 23 )[/C][C]2342.84285714286[/C][C]19.3186704843081[/C][C]121.273503735460[/C][/ROW]
[ROW][C]Winsorized Mean ( 18 / 23 )[/C][C]2343.1[/C][C]18.9817188940810[/C][C]123.439821918901[/C][/ROW]
[ROW][C]Winsorized Mean ( 19 / 23 )[/C][C]2345.81428571429[/C][C]18.4489816677920[/C][C]127.151423745494[/C][/ROW]
[ROW][C]Winsorized Mean ( 20 / 23 )[/C][C]2348.1[/C][C]17.566297370608[/C][C]133.670741788127[/C][/ROW]
[ROW][C]Winsorized Mean ( 21 / 23 )[/C][C]2339.7[/C][C]15.7165939392656[/C][C]148.868133199943[/C][/ROW]
[ROW][C]Winsorized Mean ( 22 / 23 )[/C][C]2340.01428571429[/C][C]14.1913934909933[/C][C]164.889676774828[/C][/ROW]
[ROW][C]Winsorized Mean ( 23 / 23 )[/C][C]2339.68571428571[/C][C]13.9638626010147[/C][C]167.552902884886[/C][/ROW]
[ROW][C]Trimmed Mean ( 1 / 23 )[/C][C]2359.35294117647[/C][C]36.6180410823232[/C][C]64.4314352008145[/C][/ROW]
[ROW][C]Trimmed Mean ( 2 / 23 )[/C][C]2358.69696969697[/C][C]35.1541326089233[/C][C]67.0958659665023[/C][/ROW]
[ROW][C]Trimmed Mean ( 3 / 23 )[/C][C]2357.296875[/C][C]33.9054231369992[/C][C]69.5256586380014[/C][/ROW]
[ROW][C]Trimmed Mean ( 4 / 23 )[/C][C]2355.98387096774[/C][C]32.6563237307307[/C][C]72.1447977547663[/C][/ROW]
[ROW][C]Trimmed Mean ( 5 / 23 )[/C][C]2354.81666666667[/C][C]31.2167698273819[/C][C]75.4343476178989[/C][/ROW]
[ROW][C]Trimmed Mean ( 6 / 23 )[/C][C]2354.63793103448[/C][C]30.0482541774768[/C][C]78.3618880859787[/C][/ROW]
[ROW][C]Trimmed Mean ( 7 / 23 )[/C][C]2354.16071428571[/C][C]28.6903393033504[/C][C]82.0541259339794[/C][/ROW]
[ROW][C]Trimmed Mean ( 8 / 23 )[/C][C]2352.68518518519[/C][C]27.3750617723483[/C][C]85.9426438833335[/C][/ROW]
[ROW][C]Trimmed Mean ( 9 / 23 )[/C][C]2349.34615384615[/C][C]26.2822865383283[/C][C]89.3889559578473[/C][/ROW]
[ROW][C]Trimmed Mean ( 10 / 23 )[/C][C]2346.18[/C][C]25.1064621326129[/C][C]93.4492477517311[/C][/ROW]
[ROW][C]Trimmed Mean ( 11 / 23 )[/C][C]2344.25[/C][C]24.2137808045556[/C][C]96.8147031197604[/C][/ROW]
[ROW][C]Trimmed Mean ( 12 / 23 )[/C][C]2342.60869565217[/C][C]23.3001519403905[/C][C]100.540490106903[/C][/ROW]
[ROW][C]Trimmed Mean ( 13 / 23 )[/C][C]2340.86363636364[/C][C]22.3545709036083[/C][C]104.715212224708[/C][/ROW]
[ROW][C]Trimmed Mean ( 14 / 23 )[/C][C]2339.09523809524[/C][C]21.1903548261542[/C][C]110.384901870931[/C][/ROW]
[ROW][C]Trimmed Mean ( 15 / 23 )[/C][C]2337.45[/C][C]20.7055966050059[/C][C]112.889768142923[/C][/ROW]
[ROW][C]Trimmed Mean ( 16 / 23 )[/C][C]2336.31578947368[/C][C]20.2892702747856[/C][C]115.150311363200[/C][/ROW]
[ROW][C]Trimmed Mean ( 17 / 23 )[/C][C]2335.61111111111[/C][C]19.9054223201243[/C][C]117.335421150538[/C][/ROW]
[ROW][C]Trimmed Mean ( 18 / 23 )[/C][C]2334.73529411765[/C][C]19.4013482828760[/C][C]120.338816667619[/C][/ROW]
[ROW][C]Trimmed Mean ( 19 / 23 )[/C][C]2333.71875[/C][C]18.751625433578[/C][C]124.454211090473[/C][/ROW]
[ROW][C]Trimmed Mean ( 20 / 23 )[/C][C]2332.23333333333[/C][C]17.9411351230048[/C][C]129.993632919182[/C][/ROW]
[ROW][C]Trimmed Mean ( 21 / 23 )[/C][C]2330.25[/C][C]17.0017603352522[/C][C]137.059337036316[/C][/ROW]
[ROW][C]Trimmed Mean ( 22 / 23 )[/C][C]2329.03846153846[/C][C]16.2569256975633[/C][C]143.264384968405[/C][/ROW]
[ROW][C]Trimmed Mean ( 23 / 23 )[/C][C]2327.58333333333[/C][C]15.6354433698562[/C][C]148.865835030986[/C][/ROW]
[ROW][C]Median[/C][C]2301.5[/C][C][/C][C][/C][/ROW]
[ROW][C]Midrange[/C][C]2504.5[/C][C][/C][C][/C][/ROW]
[ROW][C]Midmean - Weighted Average at Xnp[/C][C]2329.6[/C][C][/C][C][/C][/ROW]
[ROW][C]Midmean - Weighted Average at X(n+1)p[/C][C]2335.61111111111[/C][C][/C][C][/C][/ROW]
[ROW][C]Midmean - Empirical Distribution Function[/C][C]2335.61111111111[/C][C][/C][C][/C][/ROW]
[ROW][C]Midmean - Empirical Distribution Function - Averaging[/C][C]2335.61111111111[/C][C][/C][C][/C][/ROW]
[ROW][C]Midmean - Empirical Distribution Function - Interpolation[/C][C]2334.73529411765[/C][C][/C][C][/C][/ROW]
[ROW][C]Midmean - Closest Observation[/C][C]2335.61111111111[/C][C][/C][C][/C][/ROW]
[ROW][C]Midmean - True Basic - Statistics Graphics Toolkit[/C][C]2335.61111111111[/C][C][/C][C][/C][/ROW]
[ROW][C]Midmean - MS Excel (old versions)[/C][C]2335.61111111111[/C][C][/C][C][/C][/ROW]
[ROW][C]Number of observations[/C][C]70[/C][C][/C][C][/C][/ROW]
[/TABLE]
Source: https://freestatistics.org/blog/index.php?pk=30507&T=1

Globally Unique Identifier (entire table): ba.freestatistics.org/blog/index.php?pk=30507&T=1

As an alternative you can also use a QR Code:  

The GUIDs for individual cells are displayed in the table below:

Central Tendency - Ungrouped Data
MeasureValueS.E.Value/S.E.
Arithmetic Mean2363.540.433892830656258.4534368209048
Geometric Mean2339.95493093928
Harmonic Mean2316.54361189767
Quadratic Mean2387.24534318771
Winsorized Mean ( 1 / 23 )2359.9714285714337.841376301951762.3648413244873
Winsorized Mean ( 2 / 23 )2361.2571428571437.060773130868163.713110747019
Winsorized Mean ( 3 / 23 )2360.7857142857136.513248923353564.655591707036
Winsorized Mean ( 4 / 23 )2359.9857142857136.304768680248565.0048409637618
Winsorized Mean ( 5 / 23 )2355.5571428571434.572674592127268.1334947511854
Winsorized Mean ( 6 / 23 )2356.9285714285734.301267391904368.7125797568881
Winsorized Mean ( 7 / 23 )2362.1285714285733.011177738214771.5554164762228
Winsorized Mean ( 8 / 23 )2372.5285714285730.912805452825176.7490538847793
Winsorized Mean ( 9 / 23 )2369.730.136104990800778.6332540560026
Winsorized Mean ( 10 / 23 )2359.4142857142927.850439762630484.7173080864648
Winsorized Mean ( 11 / 23 )2356.1142857142926.917268717690387.531699832748
Winsorized Mean ( 12 / 23 )2355.7714285714325.939196073338290.8189838232043
Winsorized Mean ( 13 / 23 )2354.6571428571425.61753965098791.9158191979776
Winsorized Mean ( 14 / 23 )2352.2571428571421.4464008641688109.68074120013
Winsorized Mean ( 15 / 23 )2346.6857142857120.4118925962571114.966591325099
Winsorized Mean ( 16 / 23 )2342.1142857142919.5646885070979119.711299511085
Winsorized Mean ( 17 / 23 )2342.8428571428619.3186704843081121.273503735460
Winsorized Mean ( 18 / 23 )2343.118.9817188940810123.439821918901
Winsorized Mean ( 19 / 23 )2345.8142857142918.4489816677920127.151423745494
Winsorized Mean ( 20 / 23 )2348.117.566297370608133.670741788127
Winsorized Mean ( 21 / 23 )2339.715.7165939392656148.868133199943
Winsorized Mean ( 22 / 23 )2340.0142857142914.1913934909933164.889676774828
Winsorized Mean ( 23 / 23 )2339.6857142857113.9638626010147167.552902884886
Trimmed Mean ( 1 / 23 )2359.3529411764736.618041082323264.4314352008145
Trimmed Mean ( 2 / 23 )2358.6969696969735.154132608923367.0958659665023
Trimmed Mean ( 3 / 23 )2357.29687533.905423136999269.5256586380014
Trimmed Mean ( 4 / 23 )2355.9838709677432.656323730730772.1447977547663
Trimmed Mean ( 5 / 23 )2354.8166666666731.216769827381975.4343476178989
Trimmed Mean ( 6 / 23 )2354.6379310344830.048254177476878.3618880859787
Trimmed Mean ( 7 / 23 )2354.1607142857128.690339303350482.0541259339794
Trimmed Mean ( 8 / 23 )2352.6851851851927.375061772348385.9426438833335
Trimmed Mean ( 9 / 23 )2349.3461538461526.282286538328389.3889559578473
Trimmed Mean ( 10 / 23 )2346.1825.106462132612993.4492477517311
Trimmed Mean ( 11 / 23 )2344.2524.213780804555696.8147031197604
Trimmed Mean ( 12 / 23 )2342.6086956521723.3001519403905100.540490106903
Trimmed Mean ( 13 / 23 )2340.8636363636422.3545709036083104.715212224708
Trimmed Mean ( 14 / 23 )2339.0952380952421.1903548261542110.384901870931
Trimmed Mean ( 15 / 23 )2337.4520.7055966050059112.889768142923
Trimmed Mean ( 16 / 23 )2336.3157894736820.2892702747856115.150311363200
Trimmed Mean ( 17 / 23 )2335.6111111111119.9054223201243117.335421150538
Trimmed Mean ( 18 / 23 )2334.7352941176519.4013482828760120.338816667619
Trimmed Mean ( 19 / 23 )2333.7187518.751625433578124.454211090473
Trimmed Mean ( 20 / 23 )2332.2333333333317.9411351230048129.993632919182
Trimmed Mean ( 21 / 23 )2330.2517.0017603352522137.059337036316
Trimmed Mean ( 22 / 23 )2329.0384615384616.2569256975633143.264384968405
Trimmed Mean ( 23 / 23 )2327.5833333333315.6354433698562148.865835030986
Median2301.5
Midrange2504.5
Midmean - Weighted Average at Xnp2329.6
Midmean - Weighted Average at X(n+1)p2335.61111111111
Midmean - Empirical Distribution Function2335.61111111111
Midmean - Empirical Distribution Function - Averaging2335.61111111111
Midmean - Empirical Distribution Function - Interpolation2334.73529411765
Midmean - Closest Observation2335.61111111111
Midmean - True Basic - Statistics Graphics Toolkit2335.61111111111
Midmean - MS Excel (old versions)2335.61111111111
Number of observations70


Parameters (Session):
Parameters (R input):
R code (references can be found in the software module):
geomean <- function(x) {
return(exp(mean(log(x))))
}
harmean <- function(x) {
return(1/mean(1/x))
}
quamean <- function(x) {
return(sqrt(mean(x*x)))
}
winmean <- function(x) {
x <-sort(x[!is.na(x)])
n<-length(x)
denom <- 3
nodenom <- n/denom
if (nodenom>40) denom <- n/40
sqrtn = sqrt(n)
roundnodenom = floor(nodenom)
win <- array(NA,dim=c(roundnodenom,2))
for (j in 1:roundnodenom) {
win[j,1] <- (j*x[j+1]+sum(x[(j+1):(n-j)])+j*x[n-j])/n
win[j,2] <- sd(c(rep(x[j+1],j),x[(j+1):(n-j)],rep(x[n-j],j)))/sqrtn
}
return(win)
}
trimean <- function(x) {
x <-sort(x[!is.na(x)])
n<-length(x)
denom <- 3
nodenom <- n/denom
if (nodenom>40) denom <- n/40
sqrtn = sqrt(n)
roundnodenom = floor(nodenom)
tri <- array(NA,dim=c(roundnodenom,2))
for (j in 1:roundnodenom) {
tri[j,1] <- mean(x,trim=j/n)
tri[j,2] <- sd(x[(j+1):(n-j)]) / sqrt(n-j*2)
}
return(tri)
}
midrange <- function(x) {
return((max(x)+min(x))/2)
}
q1 <- function(data,n,p,i,f) {
np <- n*p;
i <<- floor(np)
f <<- np - i
qvalue <- (1-f)*data[i] + f*data[i+1]
}
q2 <- function(data,n,p,i,f) {
np <- (n+1)*p
i <<- floor(np)
f <<- np - i
qvalue <- (1-f)*data[i] + f*data[i+1]
}
q3 <- function(data,n,p,i,f) {
np <- n*p
i <<- floor(np)
f <<- np - i
if (f==0) {
qvalue <- data[i]
} else {
qvalue <- data[i+1]
}
}
q4 <- function(data,n,p,i,f) {
np <- n*p
i <<- floor(np)
f <<- np - i
if (f==0) {
qvalue <- (data[i]+data[i+1])/2
} else {
qvalue <- data[i+1]
}
}
q5 <- function(data,n,p,i,f) {
np <- (n-1)*p
i <<- floor(np)
f <<- np - i
if (f==0) {
qvalue <- data[i+1]
} else {
qvalue <- data[i+1] + f*(data[i+2]-data[i+1])
}
}
q6 <- function(data,n,p,i,f) {
np <- n*p+0.5
i <<- floor(np)
f <<- np - i
qvalue <- data[i]
}
q7 <- function(data,n,p,i,f) {
np <- (n+1)*p
i <<- floor(np)
f <<- np - i
if (f==0) {
qvalue <- data[i]
} else {
qvalue <- f*data[i] + (1-f)*data[i+1]
}
}
q8 <- function(data,n,p,i,f) {
np <- (n+1)*p
i <<- floor(np)
f <<- np - i
if (f==0) {
qvalue <- data[i]
} else {
if (f == 0.5) {
qvalue <- (data[i]+data[i+1])/2
} else {
if (f < 0.5) {
qvalue <- data[i]
} else {
qvalue <- data[i+1]
}
}
}
}
midmean <- function(x,def) {
x <-sort(x[!is.na(x)])
n<-length(x)
if (def==1) {
qvalue1 <- q1(x,n,0.25,i,f)
qvalue3 <- q1(x,n,0.75,i,f)
}
if (def==2) {
qvalue1 <- q2(x,n,0.25,i,f)
qvalue3 <- q2(x,n,0.75,i,f)
}
if (def==3) {
qvalue1 <- q3(x,n,0.25,i,f)
qvalue3 <- q3(x,n,0.75,i,f)
}
if (def==4) {
qvalue1 <- q4(x,n,0.25,i,f)
qvalue3 <- q4(x,n,0.75,i,f)
}
if (def==5) {
qvalue1 <- q5(x,n,0.25,i,f)
qvalue3 <- q5(x,n,0.75,i,f)
}
if (def==6) {
qvalue1 <- q6(x,n,0.25,i,f)
qvalue3 <- q6(x,n,0.75,i,f)
}
if (def==7) {
qvalue1 <- q7(x,n,0.25,i,f)
qvalue3 <- q7(x,n,0.75,i,f)
}
if (def==8) {
qvalue1 <- q8(x,n,0.25,i,f)
qvalue3 <- q8(x,n,0.75,i,f)
}
midm <- 0
myn <- 0
roundno4 <- round(n/4)
round3no4 <- round(3*n/4)
for (i in 1:n) {
if ((x[i]>=qvalue1) & (x[i]<=qvalue3)){
midm = midm + x[i]
myn = myn + 1
}
}
midm = midm / myn
return(midm)
}
(arm <- mean(x))
sqrtn <- sqrt(length(x))
(armse <- sd(x) / sqrtn)
(armose <- arm / armse)
(geo <- geomean(x))
(har <- harmean(x))
(qua <- quamean(x))
(win <- winmean(x))
(tri <- trimean(x))
(midr <- midrange(x))
midm <- array(NA,dim=8)
for (j in 1:8) midm[j] <- midmean(x,j)
midm
bitmap(file='test1.png')
lb <- win[,1] - 2*win[,2]
ub <- win[,1] + 2*win[,2]
if ((ylimmin == '') | (ylimmax == '')) plot(win[,1],type='b',main=main, xlab='j', pch=19, ylab='Winsorized Mean(j/n)', ylim=c(min(lb),max(ub))) else plot(win[,1],type='l',main=main, xlab='j', pch=19, ylab='Winsorized Mean(j/n)', ylim=c(ylimmin,ylimmax))
lines(ub,lty=3)
lines(lb,lty=3)
grid()
dev.off()
bitmap(file='test2.png')
lb <- tri[,1] - 2*tri[,2]
ub <- tri[,1] + 2*tri[,2]
if ((ylimmin == '') | (ylimmax == '')) plot(tri[,1],type='b',main=main, xlab='j', pch=19, ylab='Trimmed Mean(j/n)', ylim=c(min(lb),max(ub))) else plot(tri[,1],type='l',main=main, xlab='j', pch=19, ylab='Trimmed Mean(j/n)', ylim=c(ylimmin,ylimmax))
lines(ub,lty=3)
lines(lb,lty=3)
grid()
dev.off()
load(file='createtable')
a<-table.start()
a<-table.row.start(a)
a<-table.element(a,'Central Tendency - Ungrouped Data',4,TRUE)
a<-table.row.end(a)
a<-table.row.start(a)
a<-table.element(a,'Measure',header=TRUE)
a<-table.element(a,'Value',header=TRUE)
a<-table.element(a,'S.E.',header=TRUE)
a<-table.element(a,'Value/S.E.',header=TRUE)
a<-table.row.end(a)
a<-table.row.start(a)
a<-table.element(a,hyperlink('arithmetic_mean.htm', 'Arithmetic Mean', 'click to view the definition of the Arithmetic Mean'),header=TRUE)
a<-table.element(a,arm)
a<-table.element(a,hyperlink('arithmetic_mean_standard_error.htm', armse, 'click to view the definition of the Standard Error of the Arithmetic Mean'))
a<-table.element(a,armose)
a<-table.row.end(a)
a<-table.row.start(a)
a<-table.element(a,hyperlink('geometric_mean.htm', 'Geometric Mean', 'click to view the definition of the Geometric Mean'),header=TRUE)
a<-table.element(a,geo)
a<-table.element(a,'')
a<-table.row.end(a)
a<-table.row.start(a)
a<-table.element(a,hyperlink('harmonic_mean.htm', 'Harmonic Mean', 'click to view the definition of the Harmonic Mean'),header=TRUE)
a<-table.element(a,har)
a<-table.element(a,'')
a<-table.row.end(a)
a<-table.row.start(a)
a<-table.element(a,hyperlink('quadratic_mean.htm', 'Quadratic Mean', 'click to view the definition of the Quadratic Mean'),header=TRUE)
a<-table.element(a,qua)
a<-table.element(a,'')
a<-table.row.end(a)
for (j in 1:length(win[,1])) {
a<-table.row.start(a)
mylabel <- paste('Winsorized Mean (',j)
mylabel <- paste(mylabel,'/')
mylabel <- paste(mylabel,length(win[,1]))
mylabel <- paste(mylabel,')')
a<-table.element(a,hyperlink('winsorized_mean.htm', mylabel, 'click to view the definition of the Winsorized Mean'),header=TRUE)
a<-table.element(a,win[j,1])
a<-table.element(a,win[j,2])
a<-table.element(a,win[j,1]/win[j,2])
a<-table.row.end(a)
}
for (j in 1:length(tri[,1])) {
a<-table.row.start(a)
mylabel <- paste('Trimmed Mean (',j)
mylabel <- paste(mylabel,'/')
mylabel <- paste(mylabel,length(tri[,1]))
mylabel <- paste(mylabel,')')
a<-table.element(a,hyperlink('arithmetic_mean.htm', mylabel, 'click to view the definition of the Trimmed Mean'),header=TRUE)
a<-table.element(a,tri[j,1])
a<-table.element(a,tri[j,2])
a<-table.element(a,tri[j,1]/tri[j,2])
a<-table.row.end(a)
}
a<-table.row.start(a)
a<-table.element(a,hyperlink('median_1.htm', 'Median', 'click to view the definition of the Median'),header=TRUE)
a<-table.element(a,median(x))
a<-table.element(a,'')
a<-table.row.end(a)
a<-table.row.start(a)
a<-table.element(a,hyperlink('midrange.htm', 'Midrange', 'click to view the definition of the Midrange'),header=TRUE)
a<-table.element(a,midr)
a<-table.element(a,'')
a<-table.row.end(a)
a<-table.row.start(a)
mymid <- hyperlink('midmean.htm', 'Midmean', 'click to view the definition of the Midmean')
mylabel <- paste(mymid,hyperlink('method_1.htm','Weighted Average at Xnp',''),sep=' - ')
a<-table.element(a,mylabel,header=TRUE)
a<-table.element(a,midm[1])
a<-table.element(a,'')
a<-table.row.end(a)
a<-table.row.start(a)
mymid <- hyperlink('midmean.htm', 'Midmean', 'click to view the definition of the Midmean')
mylabel <- paste(mymid,hyperlink('method_2.htm','Weighted Average at X(n+1)p',''),sep=' - ')
a<-table.element(a,mylabel,header=TRUE)
a<-table.element(a,midm[2])
a<-table.element(a,'')
a<-table.row.end(a)
a<-table.row.start(a)
mymid <- hyperlink('midmean.htm', 'Midmean', 'click to view the definition of the Midmean')
mylabel <- paste(mymid,hyperlink('method_3.htm','Empirical Distribution Function',''),sep=' - ')
a<-table.element(a,mylabel,header=TRUE)
a<-table.element(a,midm[3])
a<-table.element(a,'')
a<-table.row.end(a)
a<-table.row.start(a)
mymid <- hyperlink('midmean.htm', 'Midmean', 'click to view the definition of the Midmean')
mylabel <- paste(mymid,hyperlink('method_4.htm','Empirical Distribution Function - Averaging',''),sep=' - ')
a<-table.element(a,mylabel,header=TRUE)
a<-table.element(a,midm[4])
a<-table.element(a,'')
a<-table.row.end(a)
a<-table.row.start(a)
mymid <- hyperlink('midmean.htm', 'Midmean', 'click to view the definition of the Midmean')
mylabel <- paste(mymid,hyperlink('method_5.htm','Empirical Distribution Function - Interpolation',''),sep=' - ')
a<-table.element(a,mylabel,header=TRUE)
a<-table.element(a,midm[5])
a<-table.element(a,'')
a<-table.row.end(a)
a<-table.row.start(a)
mymid <- hyperlink('midmean.htm', 'Midmean', 'click to view the definition of the Midmean')
mylabel <- paste(mymid,hyperlink('method_6.htm','Closest Observation',''),sep=' - ')
a<-table.element(a,mylabel,header=TRUE)
a<-table.element(a,midm[6])
a<-table.element(a,'')
a<-table.row.end(a)
a<-table.row.start(a)
mymid <- hyperlink('midmean.htm', 'Midmean', 'click to view the definition of the Midmean')
mylabel <- paste(mymid,hyperlink('method_7.htm','True Basic - Statistics Graphics Toolkit',''),sep=' - ')
a<-table.element(a,mylabel,header=TRUE)
a<-table.element(a,midm[7])
a<-table.element(a,'')
a<-table.row.end(a)
a<-table.row.start(a)
mymid <- hyperlink('midmean.htm', 'Midmean', 'click to view the definition of the Midmean')
mylabel <- paste(mymid,hyperlink('method_8.htm','MS Excel (old versions)',''),sep=' - ')
a<-table.element(a,mylabel,header=TRUE)
a<-table.element(a,midm[8])
a<-table.element(a,'')
a<-table.row.end(a)
a<-table.row.start(a)
a<-table.element(a,'Number of observations',header=TRUE)
a<-table.element(a,length(x))
a<-table.element(a,'')
a<-table.row.end(a)
a<-table.end(a)
table.save(a,file='mytable.tab')