Free Statistics

of Irreproducible Research!

Author's title

Author*The author of this computation has been verified*
R Software Modulerwasp_smp.wasp
Title produced by softwareStandard Deviation-Mean Plot
Date of computationMon, 08 Dec 2008 06:40:16 -0700
Cite this page as followsStatistical Computations at FreeStatistics.org, Office for Research Development and Education, URL https://freestatistics.org/blog/index.php?v=date/2008/Dec/08/t1228743928lx8nqzf5swyoydd.htm/, Retrieved Thu, 16 May 2024 23:14:07 +0000
Statistical Computations at FreeStatistics.org, Office for Research Development and Education, URL https://freestatistics.org/blog/index.php?pk=30488, Retrieved Thu, 16 May 2024 23:14:07 +0000
QR Codes:

Original text written by user:
IsPrivate?No (this computation is public)
User-defined keywords
Estimated Impact162
Family? (F = Feedback message, R = changed R code, M = changed R Module, P = changed Parameters, D = changed Data)
-     [Variance Reduction Matrix] [VRM PAPER] [2008-12-08 12:10:16] [547636b63517c1c2916a747d66b36ebf]
- RMPD  [Spectral Analysis] [SPECTRUM zonder a...] [2008-12-08 12:48:15] [547636b63517c1c2916a747d66b36ebf]
-   P     [Spectral Analysis] [SPECTRUM met aang...] [2008-12-08 12:53:34] [547636b63517c1c2916a747d66b36ebf]
- RMP         [Standard Deviation-Mean Plot] [SDMP PAPER LAMBDA...] [2008-12-08 13:40:16] [e11d930c9e2984715c66c796cf63ef19] [Current]
- RM            [(Partial) Autocorrelation Function] [PACF zonder aagep...] [2008-12-08 13:59:46] [547636b63517c1c2916a747d66b36ebf]
-                 [(Partial) Autocorrelation Function] [PACF met aangepas...] [2008-12-08 14:08:36] [547636b63517c1c2916a747d66b36ebf]
Feedback Forum

Post a new message
Dataseries X:
12300.00
12092.80
12380.80
12196.90
9455.00
13168.00
13427.90
11980.50
11884.80
11691.70
12233.80
14341.40
13130.70
12421.10
14285.80
12864.60
11160.20
14316.20
14388.70
14013.90
13419.00
12769.60
13315.50
15332.90
14243.00
13824.40
14962.90
13202.90
12199.00
15508.90
14199.80
15169.60
14058.00
13786.20
14147.90
16541.70
13587.50
15582.40
15802.80
14130.50
12923.20
15612.20
16033.70
16036.60
14037.80
15330.60
15038.30
17401.80
14992.50
16043.70
16929.60
15921.30
14417.20
15961.00
17851.90
16483.90
14215.50
17429.70
17839.50
17629.20


Summary of computational transaction
Raw Inputview raw input (R code)
Raw Outputview raw output of R engine
Computing time2 seconds
R Server'George Udny Yule' @ 72.249.76.132

\begin{tabular}{lllllllll}
\hline
Summary of computational transaction \tabularnewline
Raw Input & view raw input (R code)  \tabularnewline
Raw Output & view raw output of R engine  \tabularnewline
Computing time & 2 seconds \tabularnewline
R Server & 'George Udny Yule' @ 72.249.76.132 \tabularnewline
\hline
\end{tabular}
%Source: https://freestatistics.org/blog/index.php?pk=30488&T=0

[TABLE]
[ROW][C]Summary of computational transaction[/C][/ROW]
[ROW][C]Raw Input[/C][C]view raw input (R code) [/C][/ROW]
[ROW][C]Raw Output[/C][C]view raw output of R engine [/C][/ROW]
[ROW][C]Computing time[/C][C]2 seconds[/C][/ROW]
[ROW][C]R Server[/C][C]'George Udny Yule' @ 72.249.76.132[/C][/ROW]
[/TABLE]
Source: https://freestatistics.org/blog/index.php?pk=30488&T=0

Globally Unique Identifier (entire table): ba.freestatistics.org/blog/index.php?pk=30488&T=0

As an alternative you can also use a QR Code:  

The GUIDs for individual cells are displayed in the table below:

Summary of computational transaction
Raw Inputview raw input (R code)
Raw Outputview raw output of R engine
Computing time2 seconds
R Server'George Udny Yule' @ 72.249.76.132


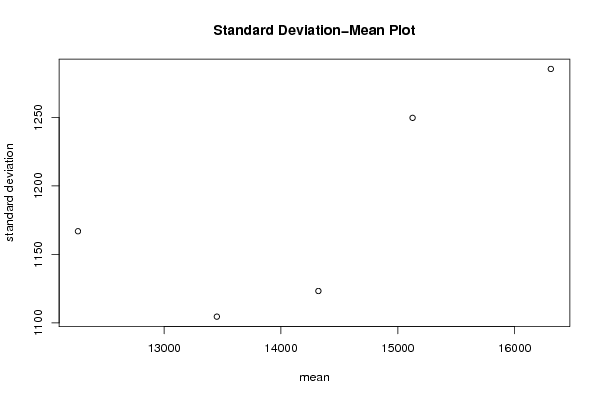
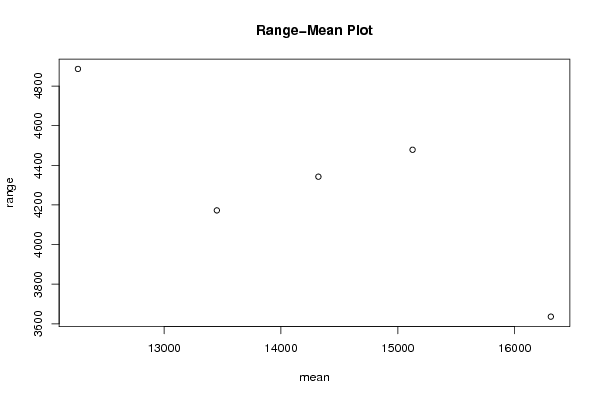
Standard Deviation-Mean Plot
SectionMeanStandard DeviationRange
112262.81166.94192423854886.4
213451.51666666671104.608120419624172.7
314320.35833333331123.320070520124342.7
415126.451249.697655435114478.6
516309.58333333331285.379979074693636.4

\begin{tabular}{lllllllll}
\hline
Standard Deviation-Mean Plot \tabularnewline
Section & Mean & Standard Deviation & Range \tabularnewline
1 & 12262.8 & 1166.9419242385 & 4886.4 \tabularnewline
2 & 13451.5166666667 & 1104.60812041962 & 4172.7 \tabularnewline
3 & 14320.3583333333 & 1123.32007052012 & 4342.7 \tabularnewline
4 & 15126.45 & 1249.69765543511 & 4478.6 \tabularnewline
5 & 16309.5833333333 & 1285.37997907469 & 3636.4 \tabularnewline
\hline
\end{tabular}
%Source: https://freestatistics.org/blog/index.php?pk=30488&T=1

[TABLE]
[ROW][C]Standard Deviation-Mean Plot[/C][/ROW]
[ROW][C]Section[/C][C]Mean[/C][C]Standard Deviation[/C][C]Range[/C][/ROW]
[ROW][C]1[/C][C]12262.8[/C][C]1166.9419242385[/C][C]4886.4[/C][/ROW]
[ROW][C]2[/C][C]13451.5166666667[/C][C]1104.60812041962[/C][C]4172.7[/C][/ROW]
[ROW][C]3[/C][C]14320.3583333333[/C][C]1123.32007052012[/C][C]4342.7[/C][/ROW]
[ROW][C]4[/C][C]15126.45[/C][C]1249.69765543511[/C][C]4478.6[/C][/ROW]
[ROW][C]5[/C][C]16309.5833333333[/C][C]1285.37997907469[/C][C]3636.4[/C][/ROW]
[/TABLE]
Source: https://freestatistics.org/blog/index.php?pk=30488&T=1

Globally Unique Identifier (entire table): ba.freestatistics.org/blog/index.php?pk=30488&T=1

As an alternative you can also use a QR Code:  

The GUIDs for individual cells are displayed in the table below:

Standard Deviation-Mean Plot
SectionMeanStandard DeviationRange
112262.81166.94192423854886.4
213451.51666666671104.608120419624172.7
314320.35833333331123.320070520124342.7
415126.451249.697655435114478.6
516309.58333333331285.379979074693636.4


Regression: S.E.(k) = alpha + beta * Mean(k)
alpha651.045108658678
beta0.037424033828236
S.D.0.0199184879357295
T-STAT1.87885917590688
p-value0.15687196614732

\begin{tabular}{lllllllll}
\hline
Regression: S.E.(k) = alpha + beta * Mean(k) \tabularnewline
alpha & 651.045108658678 \tabularnewline
beta & 0.037424033828236 \tabularnewline
S.D. & 0.0199184879357295 \tabularnewline
T-STAT & 1.87885917590688 \tabularnewline
p-value & 0.15687196614732 \tabularnewline
\hline
\end{tabular}
%Source: https://freestatistics.org/blog/index.php?pk=30488&T=2

[TABLE]
[ROW][C]Regression: S.E.(k) = alpha + beta * Mean(k)[/C][/ROW]
[ROW][C]alpha[/C][C]651.045108658678[/C][/ROW]
[ROW][C]beta[/C][C]0.037424033828236[/C][/ROW]
[ROW][C]S.D.[/C][C]0.0199184879357295[/C][/ROW]
[ROW][C]T-STAT[/C][C]1.87885917590688[/C][/ROW]
[ROW][C]p-value[/C][C]0.15687196614732[/C][/ROW]
[/TABLE]
Source: https://freestatistics.org/blog/index.php?pk=30488&T=2

Globally Unique Identifier (entire table): ba.freestatistics.org/blog/index.php?pk=30488&T=2

As an alternative you can also use a QR Code:  

The GUIDs for individual cells are displayed in the table below:

Regression: S.E.(k) = alpha + beta * Mean(k)
alpha651.045108658678
beta0.037424033828236
S.D.0.0199184879357295
T-STAT1.87885917590688
p-value0.15687196614732


Regression: ln S.E.(k) = alpha + beta * ln Mean(k)
alpha3.01780676398127
beta0.424430695982864
S.D.0.249063513249117
T-STAT1.70410627572872
p-value0.186909408728279
Lambda0.575569304017136

\begin{tabular}{lllllllll}
\hline
Regression: ln S.E.(k) = alpha + beta * ln Mean(k) \tabularnewline
alpha & 3.01780676398127 \tabularnewline
beta & 0.424430695982864 \tabularnewline
S.D. & 0.249063513249117 \tabularnewline
T-STAT & 1.70410627572872 \tabularnewline
p-value & 0.186909408728279 \tabularnewline
Lambda & 0.575569304017136 \tabularnewline
\hline
\end{tabular}
%Source: https://freestatistics.org/blog/index.php?pk=30488&T=3

[TABLE]
[ROW][C]Regression: ln S.E.(k) = alpha + beta * ln Mean(k)[/C][/ROW]
[ROW][C]alpha[/C][C]3.01780676398127[/C][/ROW]
[ROW][C]beta[/C][C]0.424430695982864[/C][/ROW]
[ROW][C]S.D.[/C][C]0.249063513249117[/C][/ROW]
[ROW][C]T-STAT[/C][C]1.70410627572872[/C][/ROW]
[ROW][C]p-value[/C][C]0.186909408728279[/C][/ROW]
[ROW][C]Lambda[/C][C]0.575569304017136[/C][/ROW]
[/TABLE]
Source: https://freestatistics.org/blog/index.php?pk=30488&T=3

Globally Unique Identifier (entire table): ba.freestatistics.org/blog/index.php?pk=30488&T=3

As an alternative you can also use a QR Code:  

The GUIDs for individual cells are displayed in the table below:

Regression: ln S.E.(k) = alpha + beta * ln Mean(k)
alpha3.01780676398127
beta0.424430695982864
S.D.0.249063513249117
T-STAT1.70410627572872
p-value0.186909408728279
Lambda0.575569304017136


Parameters (Session):
par1 = 12 ;
Parameters (R input):
par1 = 12 ;
R code (references can be found in the software module):
par1 <- as.numeric(par1)
(n <- length(x))
(np <- floor(n / par1))
arr <- array(NA,dim=c(par1,np))
j <- 0
k <- 1
for (i in 1:(np*par1))
{
j = j + 1
arr[j,k] <- x[i]
if (j == par1) {
j = 0
k=k+1
}
}
arr
arr.mean <- array(NA,dim=np)
arr.sd <- array(NA,dim=np)
arr.range <- array(NA,dim=np)
for (j in 1:np)
{
arr.mean[j] <- mean(arr[,j],na.rm=TRUE)
arr.sd[j] <- sd(arr[,j],na.rm=TRUE)
arr.range[j] <- max(arr[,j],na.rm=TRUE) - min(arr[,j],na.rm=TRUE)
}
arr.mean
arr.sd
arr.range
(lm1 <- lm(arr.sd~arr.mean))
(lnlm1 <- lm(log(arr.sd)~log(arr.mean)))
(lm2 <- lm(arr.range~arr.mean))
bitmap(file='test1.png')
plot(arr.mean,arr.sd,main='Standard Deviation-Mean Plot',xlab='mean',ylab='standard deviation')
dev.off()
bitmap(file='test2.png')
plot(arr.mean,arr.range,main='Range-Mean Plot',xlab='mean',ylab='range')
dev.off()
load(file='createtable')
a<-table.start()
a<-table.row.start(a)
a<-table.element(a,'Standard Deviation-Mean Plot',4,TRUE)
a<-table.row.end(a)
a<-table.row.start(a)
a<-table.element(a,'Section',header=TRUE)
a<-table.element(a,'Mean',header=TRUE)
a<-table.element(a,'Standard Deviation',header=TRUE)
a<-table.element(a,'Range',header=TRUE)
a<-table.row.end(a)
for (j in 1:np) {
a<-table.row.start(a)
a<-table.element(a,j,header=TRUE)
a<-table.element(a,arr.mean[j])
a<-table.element(a,arr.sd[j] )
a<-table.element(a,arr.range[j] )
a<-table.row.end(a)
}
a<-table.end(a)
table.save(a,file='mytable.tab')
a<-table.start()
a<-table.row.start(a)
a<-table.element(a,'Regression: S.E.(k) = alpha + beta * Mean(k)',2,TRUE)
a<-table.row.end(a)
a<-table.row.start(a)
a<-table.element(a,'alpha',header=TRUE)
a<-table.element(a,lm1$coefficients[[1]])
a<-table.row.end(a)
a<-table.row.start(a)
a<-table.element(a,'beta',header=TRUE)
a<-table.element(a,lm1$coefficients[[2]])
a<-table.row.end(a)
a<-table.row.start(a)
a<-table.element(a,'S.D.',header=TRUE)
a<-table.element(a,summary(lm1)$coefficients[2,2])
a<-table.row.end(a)
a<-table.row.start(a)
a<-table.element(a,'T-STAT',header=TRUE)
a<-table.element(a,summary(lm1)$coefficients[2,3])
a<-table.row.end(a)
a<-table.row.start(a)
a<-table.element(a,'p-value',header=TRUE)
a<-table.element(a,summary(lm1)$coefficients[2,4])
a<-table.row.end(a)
a<-table.end(a)
table.save(a,file='mytable1.tab')
a<-table.start()
a<-table.row.start(a)
a<-table.element(a,'Regression: ln S.E.(k) = alpha + beta * ln Mean(k)',2,TRUE)
a<-table.row.end(a)
a<-table.row.start(a)
a<-table.element(a,'alpha',header=TRUE)
a<-table.element(a,lnlm1$coefficients[[1]])
a<-table.row.end(a)
a<-table.row.start(a)
a<-table.element(a,'beta',header=TRUE)
a<-table.element(a,lnlm1$coefficients[[2]])
a<-table.row.end(a)
a<-table.row.start(a)
a<-table.element(a,'S.D.',header=TRUE)
a<-table.element(a,summary(lnlm1)$coefficients[2,2])
a<-table.row.end(a)
a<-table.row.start(a)
a<-table.element(a,'T-STAT',header=TRUE)
a<-table.element(a,summary(lnlm1)$coefficients[2,3])
a<-table.row.end(a)
a<-table.row.start(a)
a<-table.element(a,'p-value',header=TRUE)
a<-table.element(a,summary(lnlm1)$coefficients[2,4])
a<-table.row.end(a)
a<-table.row.start(a)
a<-table.element(a,'Lambda',header=TRUE)
a<-table.element(a,1-lnlm1$coefficients[[2]])
a<-table.row.end(a)
a<-table.end(a)
table.save(a,file='mytable2.tab')