Free Statistics

of Irreproducible Research!

Author's title

Author*Unverified author*
R Software Modulerwasp_smp.wasp
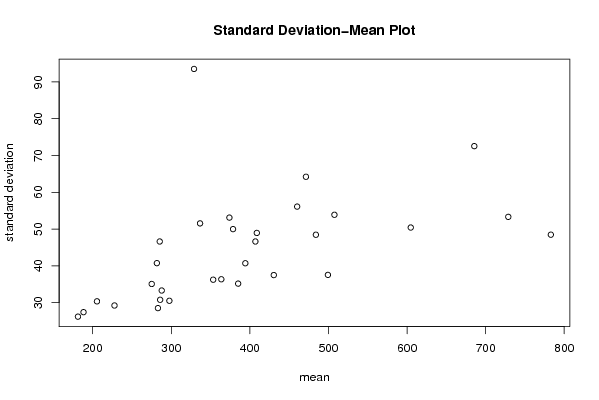
Title produced by softwareStandard Deviation-Mean Plot
Date of computationMon, 08 Dec 2008 06:17:52 -0700
Cite this page as followsStatistical Computations at FreeStatistics.org, Office for Research Development and Education, URL https://freestatistics.org/blog/index.php?v=date/2008/Dec/08/t12287423232h072zn75b96hor.htm/, Retrieved Thu, 16 May 2024 14:59:54 +0000
Statistical Computations at FreeStatistics.org, Office for Research Development and Education, URL https://freestatistics.org/blog/index.php?pk=30465, Retrieved Thu, 16 May 2024 14:59:54 +0000
QR Codes:

Original text written by user:
IsPrivate?No (this computation is public)
User-defined keywords
Estimated Impact153
Family? (F = Feedback message, R = changed R code, M = changed R Module, P = changed Parameters, D = changed Data)
-     [Univariate Data Series] [data set] [2008-12-01 19:54:57] [b98453cac15ba1066b407e146608df68]
F RMP   [Standard Deviation-Mean Plot] [standard deviatio...] [2008-12-07 19:03:08] [74be16979710d4c4e7c6647856088456]
F   P       [Standard Deviation-Mean Plot] [] [2008-12-08 13:17:52] [d14edc3cb6c80e1ccaa2891b038e75f7] [Current]
Feedback Forum
2008-12-16 21:10:38 [Marlies Polfliet] [reply
De student heeft ook hier de verkeerde software gebruikt. Hij/zij heeft hier de standard deviation meanplot gebruikt (hij/zij deed hier wat eigenlijk in step 1 moest berekend worden, zie dus verdere uitleg bij step 1) in plaats van de ACF (Autocorrelation), PACF (Partial autocorrelation) en Spectrum.
Je moet d en D wel gelijkgestellen aan 1 en lambda moet gelijk worden gesteld aan 0.5 (zie step 1).
Als we eerst naar de ACF kijken, kunnen we zien dat er allemaal positieve staafjes zijn die snel naar 0 convergeren. Als we dit patroon vergelijken met de theoretische patronen, kunnen we een gelijkenis vinden bij een theoretisch patroon van de ACF van een AR proces. In het theoretisch patroon zien we wel dat alle staafjes een dalend patroon vertonen. Hier zien we dat het eerste staafje –dit is lag 1  met lag 0 houden we geen rekening- kleiner is dan de rest omdat we werken met reële tijdreeksen (in de praktijk kan dit iets afwijken) en niet met theoretische schoolvoorbeelden. Dit is echter het minste van onze zorgen omdat je aan het eerste staafje een beetje mag trekken.
Voor de orde van het AR proces, moeten we naar de PACF kijken. We kijken hoeveel van de eerste coëfficiënten significant zijn. Over de eerste twee kunnen we met zekerheid zeggen dat ze significant zijn, de derde is een twijfelgeval. We nemen voorlopig een AR proces orde 3 en later in step 5 blijkt dat we de orde met zekerheid kunnen vaststellen. Over de parameters (p,q,P,Q) kunnen we het volgende zeggen; p=3 (dit hebben we zojuist bepaald bij de orde);
om P te bepalen, kijken we ook naar de ACF  hier zien we geen significant patroon, dus kunnen we concluderen dat we niet te maken hebben met een seizoenaal AR proces (P=0). Dan kunnen we in de PACF kijken of er sprake is van een MA proces. We zien geen gelijkenissen tussen het patroon van onze tijdreeks en de theoretische patronen, dus stellen we q gelijk aan 0. Seizoenaal: we zien allemaal negatieve coëfficiënten die een dalend patroon vertonen en die overeen komen met een theoretisch patroon. Om te kijken welke orde het is, kijken we weer naar de ACF.
Hier zien we dat het eerste staafje (lag 12) significant is, maar de volgende seizoenale coëfficiënten niet meer (Q=1).
Als we dan naar het spectrum kijken worden onze vermoedens bevestigd; het is namelijk zo dat indien het cumulatief periodogram van de tijdreeks een afwijking vertoont aan de bovenkant van de diagonaal, dan is het zeer waarschijnlijk dat we een AR proces zullen moeten gebruiken. Wanneer we echter een afwijking onderaan hebben, duidt dit op een MA proces. In dit geval zien we afwijking naar boven, de kans is dus groot dat we te maken hebben met een AR-proces.

Post a new message
Dataseries X:
235.1
280.7
264.6
240.7
201.4
240.8
241.1
223.8
206.1
174.7
203.3
220.5
299.5
347.4
338.3
327.7
351.6
396.6
438.8
395.6
363.5
378.8
357
369
464.8
479.1
431.3
366.5
326.3
355.1
331.6
261.3
249
205.5
235.6
240.9
264.9
253.8
232.3
193.8
177
213.2
207.2
180.6
188.6
175.4
199
179.6
225.8
234
200.2
183.6
178.2
203.2
208.5
191.8
172.8
148
159.4
154.5
213.2
196.4
182.8
176.4
153.6
173.2
171
151.2
161.9
157.2
201.7
236.4
356.1
398.3
403.7
384.6
365.8
368.1
367.9
347
343.3
292.9
311.5
300.9
366.9
356.9
329.7
316.2
269
289.3
266.2
253.6
233.8
228.4
253.6
260.1
306.6
309.2
309.5
271
279.9
317.9
298.4
246.7
227.3
209.1
259.9
266
320.6
308.5
282.2
262.7
263.5
313.1
284.3
252.6
250.3
246.5
312.7
333.2
446.4
511.6
515.5
506.4
483.2
522.3
509.8
460.7
405.8
375
378.5
406.8
467.8
469.8
429.8
355.8
332.7
378
360.5
334.7
319.5
323.1
363.6
352.1
411.9
388.6
416.4
360.7
338
417.2
388.4
371.1
331.5
353.7
396.7
447
533.5
565.4
542.3
488.7
467.1
531.3
496.1
444
403.4
386.3
394.1
404.1
462.1
448.1
432.3
386.3
395.2
421.9
382.9
384.2
345.5
323.4
372.6
376
462.7
487
444.2
399.3
394.9
455.4
414
375.5
347
339.4
385.8
378.8
451.8
446.1
422.5
383.1
352.8
445.3
367.5
355.1
326.2
319.8
331.8
340.9
394.1
417.2
369.9
349.2
321.4
405.7
342.9
316.5
284.2
270.9
288.8
278.8
324.4
310.9
299
273
279.3
359.2
305
282.1
250.3
246.5
257.9
266.5
315.9
318.4
295.4
266.4
245.8
362.8
324.9
294.2
289.5
295.2
290.3
272
307.4
328.7
292.9
249.1
230.4
361.5
321.7
277.2
260.7
251
257.6
241.8
287.5
292.3
274.7
254.2
230
339
318.2
287
295.8
284
271
262.7
340.6
379.4
373.3
355.2
338.4
466.9
451
422
429.2
425.9
460.7
463.6
541.4
544.2
517.5
469.4
439.4
549
533
506.1
484
457
481.5
469.5
544.7
541.2
521.5
469.7
434.4
542.6
517.3
485.7
465.8
447
426.6
411.6
467.5
484.5
451.2
417.4
379.9
484.7
455
420.8
416.5
376.3
405.6
405.8
500.8
514
475.5
430.1
414.4
538
526
488.5
520.2
504.4
568.5
610.6
818
830.9
835.9
782
762.3
856.9
820.9
769.6
752.2
724.4
723.1
719.5
817.4
803.3
752.5
689
630.4
765.5
757.7
732.2
702.6
683.3
709.5
702.2
784.8
810.9
755.6
656.8
615.1
745.3
694.1
675.7
643.7
622.1
634.6
588
689.7
673.9
647.9
568.8
545.7
632.6
643.8
593.1
579.7
546
562.9
572.5


Summary of computational transaction
Raw Inputview raw input (R code)
Raw Outputview raw output of R engine
Computing time1 seconds
R Server'George Udny Yule' @ 72.249.76.132

\begin{tabular}{lllllllll}
\hline
Summary of computational transaction \tabularnewline
Raw Input & view raw input (R code)  \tabularnewline
Raw Output & view raw output of R engine  \tabularnewline
Computing time & 1 seconds \tabularnewline
R Server & 'George Udny Yule' @ 72.249.76.132 \tabularnewline
\hline
\end{tabular}
%Source: https://freestatistics.org/blog/index.php?pk=30465&T=0

[TABLE]
[ROW][C]Summary of computational transaction[/C][/ROW]
[ROW][C]Raw Input[/C][C]view raw input (R code) [/C][/ROW]
[ROW][C]Raw Output[/C][C]view raw output of R engine [/C][/ROW]
[ROW][C]Computing time[/C][C]1 seconds[/C][/ROW]
[ROW][C]R Server[/C][C]'George Udny Yule' @ 72.249.76.132[/C][/ROW]
[/TABLE]
Source: https://freestatistics.org/blog/index.php?pk=30465&T=0

Globally Unique Identifier (entire table): ba.freestatistics.org/blog/index.php?pk=30465&T=0

As an alternative you can also use a QR Code:  

The GUIDs for individual cells are displayed in the table below:

Summary of computational transaction
Raw Inputview raw input (R code)
Raw Outputview raw output of R engine
Computing time1 seconds
R Server'George Udny Yule' @ 72.249.76.132


Standard Deviation-Mean Plot
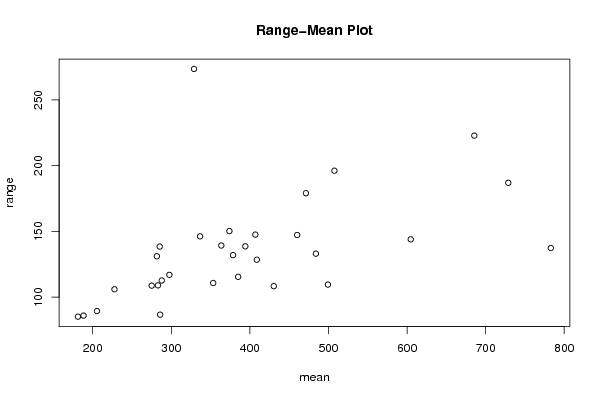
SectionMeanStandard DeviationRange
1227.73333333333329.1940010442162106
2363.6536.3267119348834139.3
3328.91666666666793.5458451857438273.6
4205.4530.324712394649189.5
5188.33333333333327.377373980362186
6181.2526.157199599901685.2
7353.34166666666736.2089506346236110.8
8285.30833333333346.6051783766048138.5
9275.12535.0509272345255108.8
10285.8530.740926229613686.7
11460.16666666666756.0969831198748147.3
12373.9553.1021228817215150.3
13385.135.1442999387072115.5
14471.35833333333364.2130184808676179.1
15394.20833333333340.6847628018454138.7
1640746.6030432092544147.6
17378.57549.9696839912143132
18336.63333333333351.5290973993129146.3
19287.84166666666733.2699826033054112.7
20297.56666666666730.476438987082117
21281.66666666666740.7140434412173131.1
22283.03333333333328.4860837901065109
23408.8548.934882520271128.5
24499.33333333333337.5159925494408109.6
25484.00833333333348.4390236808249133.1
26430.43333333333337.4665022103584108.4
27507.58333333333353.8722703730919196.2
28782.97548.4555489832973137.4
29728.853.3077684940777187
30685.55833333333372.5442618285032222.9
31604.71666666666750.4040372360882144

\begin{tabular}{lllllllll}
\hline
Standard Deviation-Mean Plot \tabularnewline
Section & Mean & Standard Deviation & Range \tabularnewline
1 & 227.733333333333 & 29.1940010442162 & 106 \tabularnewline
2 & 363.65 & 36.3267119348834 & 139.3 \tabularnewline
3 & 328.916666666667 & 93.5458451857438 & 273.6 \tabularnewline
4 & 205.45 & 30.3247123946491 & 89.5 \tabularnewline
5 & 188.333333333333 & 27.3773739803621 & 86 \tabularnewline
6 & 181.25 & 26.1571995999016 & 85.2 \tabularnewline
7 & 353.341666666667 & 36.2089506346236 & 110.8 \tabularnewline
8 & 285.308333333333 & 46.6051783766048 & 138.5 \tabularnewline
9 & 275.125 & 35.0509272345255 & 108.8 \tabularnewline
10 & 285.85 & 30.7409262296136 & 86.7 \tabularnewline
11 & 460.166666666667 & 56.0969831198748 & 147.3 \tabularnewline
12 & 373.95 & 53.1021228817215 & 150.3 \tabularnewline
13 & 385.1 & 35.1442999387072 & 115.5 \tabularnewline
14 & 471.358333333333 & 64.2130184808676 & 179.1 \tabularnewline
15 & 394.208333333333 & 40.6847628018454 & 138.7 \tabularnewline
16 & 407 & 46.6030432092544 & 147.6 \tabularnewline
17 & 378.575 & 49.9696839912143 & 132 \tabularnewline
18 & 336.633333333333 & 51.5290973993129 & 146.3 \tabularnewline
19 & 287.841666666667 & 33.2699826033054 & 112.7 \tabularnewline
20 & 297.566666666667 & 30.476438987082 & 117 \tabularnewline
21 & 281.666666666667 & 40.7140434412173 & 131.1 \tabularnewline
22 & 283.033333333333 & 28.4860837901065 & 109 \tabularnewline
23 & 408.85 & 48.934882520271 & 128.5 \tabularnewline
24 & 499.333333333333 & 37.5159925494408 & 109.6 \tabularnewline
25 & 484.008333333333 & 48.4390236808249 & 133.1 \tabularnewline
26 & 430.433333333333 & 37.4665022103584 & 108.4 \tabularnewline
27 & 507.583333333333 & 53.8722703730919 & 196.2 \tabularnewline
28 & 782.975 & 48.4555489832973 & 137.4 \tabularnewline
29 & 728.8 & 53.3077684940777 & 187 \tabularnewline
30 & 685.558333333333 & 72.5442618285032 & 222.9 \tabularnewline
31 & 604.716666666667 & 50.4040372360882 & 144 \tabularnewline
\hline
\end{tabular}
%Source: https://freestatistics.org/blog/index.php?pk=30465&T=1

[TABLE]
[ROW][C]Standard Deviation-Mean Plot[/C][/ROW]
[ROW][C]Section[/C][C]Mean[/C][C]Standard Deviation[/C][C]Range[/C][/ROW]
[ROW][C]1[/C][C]227.733333333333[/C][C]29.1940010442162[/C][C]106[/C][/ROW]
[ROW][C]2[/C][C]363.65[/C][C]36.3267119348834[/C][C]139.3[/C][/ROW]
[ROW][C]3[/C][C]328.916666666667[/C][C]93.5458451857438[/C][C]273.6[/C][/ROW]
[ROW][C]4[/C][C]205.45[/C][C]30.3247123946491[/C][C]89.5[/C][/ROW]
[ROW][C]5[/C][C]188.333333333333[/C][C]27.3773739803621[/C][C]86[/C][/ROW]
[ROW][C]6[/C][C]181.25[/C][C]26.1571995999016[/C][C]85.2[/C][/ROW]
[ROW][C]7[/C][C]353.341666666667[/C][C]36.2089506346236[/C][C]110.8[/C][/ROW]
[ROW][C]8[/C][C]285.308333333333[/C][C]46.6051783766048[/C][C]138.5[/C][/ROW]
[ROW][C]9[/C][C]275.125[/C][C]35.0509272345255[/C][C]108.8[/C][/ROW]
[ROW][C]10[/C][C]285.85[/C][C]30.7409262296136[/C][C]86.7[/C][/ROW]
[ROW][C]11[/C][C]460.166666666667[/C][C]56.0969831198748[/C][C]147.3[/C][/ROW]
[ROW][C]12[/C][C]373.95[/C][C]53.1021228817215[/C][C]150.3[/C][/ROW]
[ROW][C]13[/C][C]385.1[/C][C]35.1442999387072[/C][C]115.5[/C][/ROW]
[ROW][C]14[/C][C]471.358333333333[/C][C]64.2130184808676[/C][C]179.1[/C][/ROW]
[ROW][C]15[/C][C]394.208333333333[/C][C]40.6847628018454[/C][C]138.7[/C][/ROW]
[ROW][C]16[/C][C]407[/C][C]46.6030432092544[/C][C]147.6[/C][/ROW]
[ROW][C]17[/C][C]378.575[/C][C]49.9696839912143[/C][C]132[/C][/ROW]
[ROW][C]18[/C][C]336.633333333333[/C][C]51.5290973993129[/C][C]146.3[/C][/ROW]
[ROW][C]19[/C][C]287.841666666667[/C][C]33.2699826033054[/C][C]112.7[/C][/ROW]
[ROW][C]20[/C][C]297.566666666667[/C][C]30.476438987082[/C][C]117[/C][/ROW]
[ROW][C]21[/C][C]281.666666666667[/C][C]40.7140434412173[/C][C]131.1[/C][/ROW]
[ROW][C]22[/C][C]283.033333333333[/C][C]28.4860837901065[/C][C]109[/C][/ROW]
[ROW][C]23[/C][C]408.85[/C][C]48.934882520271[/C][C]128.5[/C][/ROW]
[ROW][C]24[/C][C]499.333333333333[/C][C]37.5159925494408[/C][C]109.6[/C][/ROW]
[ROW][C]25[/C][C]484.008333333333[/C][C]48.4390236808249[/C][C]133.1[/C][/ROW]
[ROW][C]26[/C][C]430.433333333333[/C][C]37.4665022103584[/C][C]108.4[/C][/ROW]
[ROW][C]27[/C][C]507.583333333333[/C][C]53.8722703730919[/C][C]196.2[/C][/ROW]
[ROW][C]28[/C][C]782.975[/C][C]48.4555489832973[/C][C]137.4[/C][/ROW]
[ROW][C]29[/C][C]728.8[/C][C]53.3077684940777[/C][C]187[/C][/ROW]
[ROW][C]30[/C][C]685.558333333333[/C][C]72.5442618285032[/C][C]222.9[/C][/ROW]
[ROW][C]31[/C][C]604.716666666667[/C][C]50.4040372360882[/C][C]144[/C][/ROW]
[/TABLE]
Source: https://freestatistics.org/blog/index.php?pk=30465&T=1

Globally Unique Identifier (entire table): ba.freestatistics.org/blog/index.php?pk=30465&T=1

As an alternative you can also use a QR Code:  

The GUIDs for individual cells are displayed in the table below:

Standard Deviation-Mean Plot
SectionMeanStandard DeviationRange
1227.73333333333329.1940010442162106
2363.6536.3267119348834139.3
3328.91666666666793.5458451857438273.6
4205.4530.324712394649189.5
5188.33333333333327.377373980362186
6181.2526.157199599901685.2
7353.34166666666736.2089506346236110.8
8285.30833333333346.6051783766048138.5
9275.12535.0509272345255108.8
10285.8530.740926229613686.7
11460.16666666666756.0969831198748147.3
12373.9553.1021228817215150.3
13385.135.1442999387072115.5
14471.35833333333364.2130184808676179.1
15394.20833333333340.6847628018454138.7
1640746.6030432092544147.6
17378.57549.9696839912143132
18336.63333333333351.5290973993129146.3
19287.84166666666733.2699826033054112.7
20297.56666666666730.476438987082117
21281.66666666666740.7140434412173131.1
22283.03333333333328.4860837901065109
23408.8548.934882520271128.5
24499.33333333333337.5159925494408109.6
25484.00833333333348.4390236808249133.1
26430.43333333333337.4665022103584108.4
27507.58333333333353.8722703730919196.2
28782.97548.4555489832973137.4
29728.853.3077684940777187
30685.55833333333372.5442618285032222.9
31604.71666666666750.4040372360882144


Regression: S.E.(k) = alpha + beta * Mean(k)
alpha25.0818554501784
beta0.0488516650103526
S.D.0.0155384837695400
T-STAT3.14391453728042
p-value0.00382792717820021

\begin{tabular}{lllllllll}
\hline
Regression: S.E.(k) = alpha + beta * Mean(k) \tabularnewline
alpha & 25.0818554501784 \tabularnewline
beta & 0.0488516650103526 \tabularnewline
S.D. & 0.0155384837695400 \tabularnewline
T-STAT & 3.14391453728042 \tabularnewline
p-value & 0.00382792717820021 \tabularnewline
\hline
\end{tabular}
%Source: https://freestatistics.org/blog/index.php?pk=30465&T=2

[TABLE]
[ROW][C]Regression: S.E.(k) = alpha + beta * Mean(k)[/C][/ROW]
[ROW][C]alpha[/C][C]25.0818554501784[/C][/ROW]
[ROW][C]beta[/C][C]0.0488516650103526[/C][/ROW]
[ROW][C]S.D.[/C][C]0.0155384837695400[/C][/ROW]
[ROW][C]T-STAT[/C][C]3.14391453728042[/C][/ROW]
[ROW][C]p-value[/C][C]0.00382792717820021[/C][/ROW]
[/TABLE]
Source: https://freestatistics.org/blog/index.php?pk=30465&T=2

Globally Unique Identifier (entire table): ba.freestatistics.org/blog/index.php?pk=30465&T=2

As an alternative you can also use a QR Code:  

The GUIDs for individual cells are displayed in the table below:

Regression: S.E.(k) = alpha + beta * Mean(k)
alpha25.0818554501784
beta0.0488516650103526
S.D.0.0155384837695400
T-STAT3.14391453728042
p-value0.00382792717820021


Regression: ln S.E.(k) = alpha + beta * ln Mean(k)
alpha0.596066412617842
beta0.532942026074986
S.D.0.115396834084912
T-STAT4.61834183148243
p-value7.31833172336408e-05
Lambda0.467057973925014

\begin{tabular}{lllllllll}
\hline
Regression: ln S.E.(k) = alpha + beta * ln Mean(k) \tabularnewline
alpha & 0.596066412617842 \tabularnewline
beta & 0.532942026074986 \tabularnewline
S.D. & 0.115396834084912 \tabularnewline
T-STAT & 4.61834183148243 \tabularnewline
p-value & 7.31833172336408e-05 \tabularnewline
Lambda & 0.467057973925014 \tabularnewline
\hline
\end{tabular}
%Source: https://freestatistics.org/blog/index.php?pk=30465&T=3

[TABLE]
[ROW][C]Regression: ln S.E.(k) = alpha + beta * ln Mean(k)[/C][/ROW]
[ROW][C]alpha[/C][C]0.596066412617842[/C][/ROW]
[ROW][C]beta[/C][C]0.532942026074986[/C][/ROW]
[ROW][C]S.D.[/C][C]0.115396834084912[/C][/ROW]
[ROW][C]T-STAT[/C][C]4.61834183148243[/C][/ROW]
[ROW][C]p-value[/C][C]7.31833172336408e-05[/C][/ROW]
[ROW][C]Lambda[/C][C]0.467057973925014[/C][/ROW]
[/TABLE]
Source: https://freestatistics.org/blog/index.php?pk=30465&T=3

Globally Unique Identifier (entire table): ba.freestatistics.org/blog/index.php?pk=30465&T=3

As an alternative you can also use a QR Code:  

The GUIDs for individual cells are displayed in the table below:

Regression: ln S.E.(k) = alpha + beta * ln Mean(k)
alpha0.596066412617842
beta0.532942026074986
S.D.0.115396834084912
T-STAT4.61834183148243
p-value7.31833172336408e-05
Lambda0.467057973925014


Parameters (Session):
par1 = 1 ; par2 = 1 ; par3 = 1 ; par4 = 12 ;
Parameters (R input):
par1 = 12 ; par2 = ; par3 = ; par4 = ; par5 = ; par6 = ; par7 = ; par8 = ; par9 = ; par10 = ; par11 = ; par12 = ; par13 = ; par14 = ; par15 = ; par16 = ; par17 = ; par18 = ; par19 = ; par20 = ;
R code (references can be found in the software module):
par1 <- as.numeric(par1)
(n <- length(x))
(np <- floor(n / par1))
arr <- array(NA,dim=c(par1,np))
j <- 0
k <- 1
for (i in 1:(np*par1))
{
j = j + 1
arr[j,k] <- x[i]
if (j == par1) {
j = 0
k=k+1
}
}
arr
arr.mean <- array(NA,dim=np)
arr.sd <- array(NA,dim=np)
arr.range <- array(NA,dim=np)
for (j in 1:np)
{
arr.mean[j] <- mean(arr[,j],na.rm=TRUE)
arr.sd[j] <- sd(arr[,j],na.rm=TRUE)
arr.range[j] <- max(arr[,j],na.rm=TRUE) - min(arr[,j],na.rm=TRUE)
}
arr.mean
arr.sd
arr.range
(lm1 <- lm(arr.sd~arr.mean))
(lnlm1 <- lm(log(arr.sd)~log(arr.mean)))
(lm2 <- lm(arr.range~arr.mean))
bitmap(file='test1.png')
plot(arr.mean,arr.sd,main='Standard Deviation-Mean Plot',xlab='mean',ylab='standard deviation')
dev.off()
bitmap(file='test2.png')
plot(arr.mean,arr.range,main='Range-Mean Plot',xlab='mean',ylab='range')
dev.off()
load(file='createtable')
a<-table.start()
a<-table.row.start(a)
a<-table.element(a,'Standard Deviation-Mean Plot',4,TRUE)
a<-table.row.end(a)
a<-table.row.start(a)
a<-table.element(a,'Section',header=TRUE)
a<-table.element(a,'Mean',header=TRUE)
a<-table.element(a,'Standard Deviation',header=TRUE)
a<-table.element(a,'Range',header=TRUE)
a<-table.row.end(a)
for (j in 1:np) {
a<-table.row.start(a)
a<-table.element(a,j,header=TRUE)
a<-table.element(a,arr.mean[j])
a<-table.element(a,arr.sd[j] )
a<-table.element(a,arr.range[j] )
a<-table.row.end(a)
}
a<-table.end(a)
table.save(a,file='mytable.tab')
a<-table.start()
a<-table.row.start(a)
a<-table.element(a,'Regression: S.E.(k) = alpha + beta * Mean(k)',2,TRUE)
a<-table.row.end(a)
a<-table.row.start(a)
a<-table.element(a,'alpha',header=TRUE)
a<-table.element(a,lm1$coefficients[[1]])
a<-table.row.end(a)
a<-table.row.start(a)
a<-table.element(a,'beta',header=TRUE)
a<-table.element(a,lm1$coefficients[[2]])
a<-table.row.end(a)
a<-table.row.start(a)
a<-table.element(a,'S.D.',header=TRUE)
a<-table.element(a,summary(lm1)$coefficients[2,2])
a<-table.row.end(a)
a<-table.row.start(a)
a<-table.element(a,'T-STAT',header=TRUE)
a<-table.element(a,summary(lm1)$coefficients[2,3])
a<-table.row.end(a)
a<-table.row.start(a)
a<-table.element(a,'p-value',header=TRUE)
a<-table.element(a,summary(lm1)$coefficients[2,4])
a<-table.row.end(a)
a<-table.end(a)
table.save(a,file='mytable1.tab')
a<-table.start()
a<-table.row.start(a)
a<-table.element(a,'Regression: ln S.E.(k) = alpha + beta * ln Mean(k)',2,TRUE)
a<-table.row.end(a)
a<-table.row.start(a)
a<-table.element(a,'alpha',header=TRUE)
a<-table.element(a,lnlm1$coefficients[[1]])
a<-table.row.end(a)
a<-table.row.start(a)
a<-table.element(a,'beta',header=TRUE)
a<-table.element(a,lnlm1$coefficients[[2]])
a<-table.row.end(a)
a<-table.row.start(a)
a<-table.element(a,'S.D.',header=TRUE)
a<-table.element(a,summary(lnlm1)$coefficients[2,2])
a<-table.row.end(a)
a<-table.row.start(a)
a<-table.element(a,'T-STAT',header=TRUE)
a<-table.element(a,summary(lnlm1)$coefficients[2,3])
a<-table.row.end(a)
a<-table.row.start(a)
a<-table.element(a,'p-value',header=TRUE)
a<-table.element(a,summary(lnlm1)$coefficients[2,4])
a<-table.row.end(a)
a<-table.row.start(a)
a<-table.element(a,'Lambda',header=TRUE)
a<-table.element(a,1-lnlm1$coefficients[[2]])
a<-table.row.end(a)
a<-table.end(a)
table.save(a,file='mytable2.tab')