Free Statistics

of Irreproducible Research!

Author's title

Author*Unverified author*
R Software Modulerwasp_autocorrelation.wasp
Title produced by software(Partial) Autocorrelation Function
Date of computationMon, 08 Dec 2008 05:49:54 -0700
Cite this page as followsStatistical Computations at FreeStatistics.org, Office for Research Development and Education, URL https://freestatistics.org/blog/index.php?v=date/2008/Dec/08/t1228740715gkyfp81m255pzls.htm/, Retrieved Thu, 16 May 2024 08:15:25 +0000
Statistical Computations at FreeStatistics.org, Office for Research Development and Education, URL https://freestatistics.org/blog/index.php?pk=30445, Retrieved Thu, 16 May 2024 08:15:25 +0000
QR Codes:

Original text written by user:
IsPrivate?No (this computation is public)
User-defined keywords
Estimated Impact256
Family? (F = Feedback message, R = changed R code, M = changed R Module, P = changed Parameters, D = changed Data)
-     [Univariate Data Series] [data set] [2008-12-01 19:54:57] [b98453cac15ba1066b407e146608df68]
F RMP   [Variance Reduction Matrix] [] [2008-12-08 12:21:57] [8f3bcf10d49be716301459c06981a7a2]
- RMP     [(Partial) Autocorrelation Function] [] [2008-12-08 12:36:25] [8f3bcf10d49be716301459c06981a7a2]
F   P         [(Partial) Autocorrelation Function] [] [2008-12-08 12:49:54] [d14edc3cb6c80e1ccaa2891b038e75f7] [Current]
Feedback Forum
2008-12-15 10:40:06 [Toon Wouters] [reply
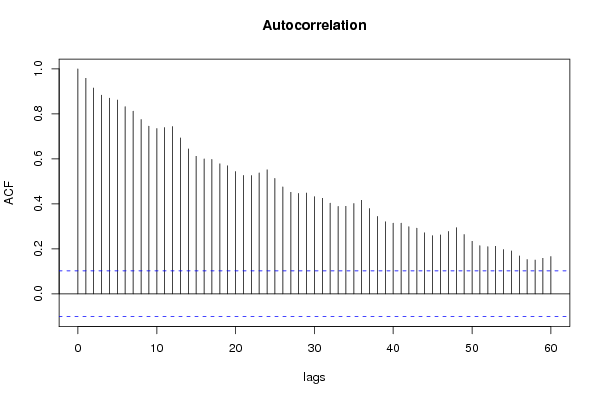
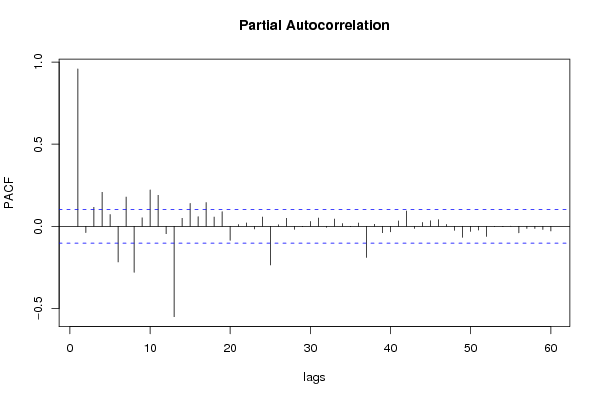
Uit de autocrrelatie grafiek kunnen we concluderen dat er een positieve langzaam dalende trend aanwezig is. Ook kunnen we besluiten dat er seizoenaliteit aanwezig is door de uitspringende observaties bij 12, 24, 36, 48, 60. Om de trend eruit te halen moet men niet-seizoenaal differntiëren (d=1) en voor de seizoenaliteit eruit te halen moet men seizoenaal-differentiëren (D=1), zie STEP 3.
2008-12-16 21:07:37 [Marlies Polfliet] [reply
De student had bij deze stap de Variantie reductie matrix moeten maken (hij/zij heeft deze echter geproduceerd bij step 1). Bij de variantie reductie matrix kunnen we kijken naar de 2de kolom, deze geeft de varianties aan na differentiatie. De variantie van de tijdreeks drukt een soort van risico, volatiliteit uit. De bedoeling van het differentiëren is om deze variantie te minimaliseren zodat we zoveel mogelijk van de tijdreeks kunnen verklaren. De kleine d wijst op een normale differentiatie (om een LT trend te verwijderen), de grote D wijst op een seizoenale differentiatie (om seizoenaliteit te verwijderen). Uit de matrix kunnen we afleiden dat de differentiatie optimaal is bij d=1 of D=1, we moeten dus één keer niet- seizoenaal differentiëren en één keer seizoenaal differentiëren. We zouden ook kunnen kijken naar de getrimde variantie, omdat deze de kleinste en de grootste waarde weglaat (outliers) en dan de variantie berekenen. Dat bekomen we door na de differentiatie de extremen weg te laten en dan opnieuw de variantie te berekenen.


Autocorrelatie:
De student heeft hier ook stapsgewijs gewerkt door eerst d gelijk te stellen aan 1 en D 0 te laten en pas daarna D en d gelijk te stellen aan 1, dit maakt de evolutie duidelijker. De student zijn berekeningen zijn correct, maar zijn uitleg is zeer beknopt. Hier volgt een iets uitgebreidere uitleg.
We doen de analyse eerst zonder te differentiëren.
We zien allemaal positieve correlaties en een langzaam dalend patroon. Dit wijst op een lange termijntrend.
Een lange termijntrend betekent dat er sprake is van een lange periode en een trage frequentie. Het spectrum geeft de intensiteit van een golfperiode aan, met andere woorden hoe belangrijk is deze golfbeweging. Een (relatief) groot spectrum wijst op een (relatief) belangrijke golfbeweging.. Ook is er inderdaad sprake van seizoenaliteit (zoals de student al had opgemerkt), dit kunnen we opmerken door het hangmattenpatroon met palen bij lag 12, 24, 36; hier zien we telkens een kleine stijging en als we alleen naar die bepaalde seizoenale autocorrelatiecoëfficiënten kijken zien we een langzaam dalend verloop. Alle autocorrelatiecoëfficiënten zijn significant verschillend van 0, aangezien ze allemaal buiten het betrouwbaarheidsinterval liggen. Er zou nog vermeld kunnen worden dat we in dit geval kunnen spreken van een positieve autocorrelatie, aangezien het niveau van de tijdreeks langzaam evolueert. Wanneer dus de vorige observatie hoog is, is er een grote kans dat de volgende ook hoog zal zijn. Dan gaan we de lange termijn trend eruit halen door d gelijk te stellen aan 1. We zien dat de lange termijn trend volledig is verdwenen wanneer we gewoon differentiëren (d=1) = niet-seizoenale trend eruit halen. Er is nog wel sprake van seizoenaliteit (de palen van de hangmatstructuur zijn nog steeds aanwezig = De 'palen' liggen nog steeds buiten het 95% betrouwbaarheidsinterval), we zullen dus ook seizoenaal moeten differentiëren ( D=1). Na gewone en seizoenale differentiatie (d=1 en D=1) zien we dat de lange termijn trend en de seizoenaliteit (bijna volledig)verdwenen zijn uit de tijdreeks. Er is nu sprake van een stationaire tijdreeks.


Het cumulative periodogram kunnen we beschouwen als een soort R^2: 70% (y-as) kan verklaard worden door een zeer lage frequentie (lange termijntrend). De zeer steile stijging die dominant is aan de linkerkant van de grafiek wijst dus op een lange termijn trend. Hier kunnen we reeds opmerken dat doordat de grafiek bij het cumulatieve periodogram afwijkt boven de betrouwbaarheidslijn (blauwe stippellijn), we hier waarschijnlijk te maken hebben met een AR-proces.
De trap-structuur in het cumulative periodogram wijst op seizonaliteit. Nu gaan we deze lange termijn trend wegwerken  d = 1. Als we dit doen, kunnen we duidelijk een trapbeweging opmerken, dit wijst op een seizoenale trend. Dit gaan we wegwerken door D gelijk te stellen aan 1.
Nu is er geen trapbeweging of lange termijn trend te bekennen. We kunnen wel opmerken dat er nog steeds een deel van de grafiek buiten de 95%- betrouwbaarheidsinterval valt. Dit betekent dat er nog golfbewegingen in de tijdreeks (met redelijk lange termijn) zitten die verklaard kunnen worden. Dit heeft waarschijnlijk te maken met de conjunctuurcyclus.

Post a new message
Dataseries X:
235.1
280.7
264.6
240.7
201.4
240.8
241.1
223.8
206.1
174.7
203.3
220.5
299.5
347.4
338.3
327.7
351.6
396.6
438.8
395.6
363.5
378.8
357
369
464.8
479.1
431.3
366.5
326.3
355.1
331.6
261.3
249
205.5
235.6
240.9
264.9
253.8
232.3
193.8
177
213.2
207.2
180.6
188.6
175.4
199
179.6
225.8
234
200.2
183.6
178.2
203.2
208.5
191.8
172.8
148
159.4
154.5
213.2
196.4
182.8
176.4
153.6
173.2
171
151.2
161.9
157.2
201.7
236.4
356.1
398.3
403.7
384.6
365.8
368.1
367.9
347
343.3
292.9
311.5
300.9
366.9
356.9
329.7
316.2
269
289.3
266.2
253.6
233.8
228.4
253.6
260.1
306.6
309.2
309.5
271
279.9
317.9
298.4
246.7
227.3
209.1
259.9
266
320.6
308.5
282.2
262.7
263.5
313.1
284.3
252.6
250.3
246.5
312.7
333.2
446.4
511.6
515.5
506.4
483.2
522.3
509.8
460.7
405.8
375
378.5
406.8
467.8
469.8
429.8
355.8
332.7
378
360.5
334.7
319.5
323.1
363.6
352.1
411.9
388.6
416.4
360.7
338
417.2
388.4
371.1
331.5
353.7
396.7
447
533.5
565.4
542.3
488.7
467.1
531.3
496.1
444
403.4
386.3
394.1
404.1
462.1
448.1
432.3
386.3
395.2
421.9
382.9
384.2
345.5
323.4
372.6
376
462.7
487
444.2
399.3
394.9
455.4
414
375.5
347
339.4
385.8
378.8
451.8
446.1
422.5
383.1
352.8
445.3
367.5
355.1
326.2
319.8
331.8
340.9
394.1
417.2
369.9
349.2
321.4
405.7
342.9
316.5
284.2
270.9
288.8
278.8
324.4
310.9
299
273
279.3
359.2
305
282.1
250.3
246.5
257.9
266.5
315.9
318.4
295.4
266.4
245.8
362.8
324.9
294.2
289.5
295.2
290.3
272
307.4
328.7
292.9
249.1
230.4
361.5
321.7
277.2
260.7
251
257.6
241.8
287.5
292.3
274.7
254.2
230
339
318.2
287
295.8
284
271
262.7
340.6
379.4
373.3
355.2
338.4
466.9
451
422
429.2
425.9
460.7
463.6
541.4
544.2
517.5
469.4
439.4
549
533
506.1
484
457
481.5
469.5
544.7
541.2
521.5
469.7
434.4
542.6
517.3
485.7
465.8
447
426.6
411.6
467.5
484.5
451.2
417.4
379.9
484.7
455
420.8
416.5
376.3
405.6
405.8
500.8
514
475.5
430.1
414.4
538
526
488.5
520.2
504.4
568.5
610.6
818
830.9
835.9
782
762.3
856.9
820.9
769.6
752.2
724.4
723.1
719.5
817.4
803.3
752.5
689
630.4
765.5
757.7
732.2
702.6
683.3
709.5
702.2
784.8
810.9
755.6
656.8
615.1
745.3
694.1
675.7
643.7
622.1
634.6
588
689.7
673.9
647.9
568.8
545.7
632.6
643.8
593.1
579.7
546
562.9
572.5


Summary of computational transaction
Raw Inputview raw input (R code)
Raw Outputview raw output of R engine
Computing time1 seconds
R Server'George Udny Yule' @ 72.249.76.132

\begin{tabular}{lllllllll}
\hline
Summary of computational transaction \tabularnewline
Raw Input & view raw input (R code)  \tabularnewline
Raw Output & view raw output of R engine  \tabularnewline
Computing time & 1 seconds \tabularnewline
R Server & 'George Udny Yule' @ 72.249.76.132 \tabularnewline
\hline
\end{tabular}
%Source: https://freestatistics.org/blog/index.php?pk=30445&T=0

[TABLE]
[ROW][C]Summary of computational transaction[/C][/ROW]
[ROW][C]Raw Input[/C][C]view raw input (R code) [/C][/ROW]
[ROW][C]Raw Output[/C][C]view raw output of R engine [/C][/ROW]
[ROW][C]Computing time[/C][C]1 seconds[/C][/ROW]
[ROW][C]R Server[/C][C]'George Udny Yule' @ 72.249.76.132[/C][/ROW]
[/TABLE]
Source: https://freestatistics.org/blog/index.php?pk=30445&T=0

Globally Unique Identifier (entire table): ba.freestatistics.org/blog/index.php?pk=30445&T=0

As an alternative you can also use a QR Code:  

The GUIDs for individual cells are displayed in the table below:

Summary of computational transaction
Raw Inputview raw input (R code)
Raw Outputview raw output of R engine
Computing time1 seconds
R Server'George Udny Yule' @ 72.249.76.132


Autocorrelation Function
Time lag kACF(k)T-STATP-value
10.95829718.4830
20.91521817.65210
30.88341217.03860
40.87008816.78160
50.86173516.62050
60.83236716.05410
70.81215315.66420
80.77509514.94950
90.74559214.38050
100.73465214.16950
110.73915414.25630
120.74370514.34410
130.69318813.36970
140.6441612.42410
150.61139311.79210
160.59979311.56840
170.59740911.52240
180.57795411.14720
190.56895310.97360
200.54377610.4880
210.52623210.14960
220.52570110.13940
230.53771210.3710
240.55135410.63410
250.5128499.89150
260.4750369.16220
270.451488.70780
280.4465798.61330
290.448128.6430
300.4318678.32950
310.4249028.19520
320.4028217.76930
330.3883397.490
340.3888877.50060
350.401247.73880
360.4155648.01510
370.3792257.31420
380.344126.63710
390.3204116.17990
400.3139326.05490
410.3139726.05570
420.2986625.76040
430.2917155.62640
440.2712295.23130
450.2585574.98690
460.26195.05130
470.2776165.35450
480.2937845.66630
490.2637235.08650
500.2335144.50394e-06
510.2142154.13162.2e-05
520.209714.04473.2e-05
530.2113754.07682.8e-05
540.1968923.79758.5e-05
550.190393.67210.000138
560.1683633.24730.000635
570.1523882.93920.001748
580.1500172.89340.002018
590.1578023.04360.001252
600.1653633.18940.000773

\begin{tabular}{lllllllll}
\hline
Autocorrelation Function \tabularnewline
Time lag k & ACF(k) & T-STAT & P-value \tabularnewline
1 & 0.958297 & 18.483 & 0 \tabularnewline
2 & 0.915218 & 17.6521 & 0 \tabularnewline
3 & 0.883412 & 17.0386 & 0 \tabularnewline
4 & 0.870088 & 16.7816 & 0 \tabularnewline
5 & 0.861735 & 16.6205 & 0 \tabularnewline
6 & 0.832367 & 16.0541 & 0 \tabularnewline
7 & 0.812153 & 15.6642 & 0 \tabularnewline
8 & 0.775095 & 14.9495 & 0 \tabularnewline
9 & 0.745592 & 14.3805 & 0 \tabularnewline
10 & 0.734652 & 14.1695 & 0 \tabularnewline
11 & 0.739154 & 14.2563 & 0 \tabularnewline
12 & 0.743705 & 14.3441 & 0 \tabularnewline
13 & 0.693188 & 13.3697 & 0 \tabularnewline
14 & 0.64416 & 12.4241 & 0 \tabularnewline
15 & 0.611393 & 11.7921 & 0 \tabularnewline
16 & 0.599793 & 11.5684 & 0 \tabularnewline
17 & 0.597409 & 11.5224 & 0 \tabularnewline
18 & 0.577954 & 11.1472 & 0 \tabularnewline
19 & 0.568953 & 10.9736 & 0 \tabularnewline
20 & 0.543776 & 10.488 & 0 \tabularnewline
21 & 0.526232 & 10.1496 & 0 \tabularnewline
22 & 0.525701 & 10.1394 & 0 \tabularnewline
23 & 0.537712 & 10.371 & 0 \tabularnewline
24 & 0.551354 & 10.6341 & 0 \tabularnewline
25 & 0.512849 & 9.8915 & 0 \tabularnewline
26 & 0.475036 & 9.1622 & 0 \tabularnewline
27 & 0.45148 & 8.7078 & 0 \tabularnewline
28 & 0.446579 & 8.6133 & 0 \tabularnewline
29 & 0.44812 & 8.643 & 0 \tabularnewline
30 & 0.431867 & 8.3295 & 0 \tabularnewline
31 & 0.424902 & 8.1952 & 0 \tabularnewline
32 & 0.402821 & 7.7693 & 0 \tabularnewline
33 & 0.388339 & 7.49 & 0 \tabularnewline
34 & 0.388887 & 7.5006 & 0 \tabularnewline
35 & 0.40124 & 7.7388 & 0 \tabularnewline
36 & 0.415564 & 8.0151 & 0 \tabularnewline
37 & 0.379225 & 7.3142 & 0 \tabularnewline
38 & 0.34412 & 6.6371 & 0 \tabularnewline
39 & 0.320411 & 6.1799 & 0 \tabularnewline
40 & 0.313932 & 6.0549 & 0 \tabularnewline
41 & 0.313972 & 6.0557 & 0 \tabularnewline
42 & 0.298662 & 5.7604 & 0 \tabularnewline
43 & 0.291715 & 5.6264 & 0 \tabularnewline
44 & 0.271229 & 5.2313 & 0 \tabularnewline
45 & 0.258557 & 4.9869 & 0 \tabularnewline
46 & 0.2619 & 5.0513 & 0 \tabularnewline
47 & 0.277616 & 5.3545 & 0 \tabularnewline
48 & 0.293784 & 5.6663 & 0 \tabularnewline
49 & 0.263723 & 5.0865 & 0 \tabularnewline
50 & 0.233514 & 4.5039 & 4e-06 \tabularnewline
51 & 0.214215 & 4.1316 & 2.2e-05 \tabularnewline
52 & 0.20971 & 4.0447 & 3.2e-05 \tabularnewline
53 & 0.211375 & 4.0768 & 2.8e-05 \tabularnewline
54 & 0.196892 & 3.7975 & 8.5e-05 \tabularnewline
55 & 0.19039 & 3.6721 & 0.000138 \tabularnewline
56 & 0.168363 & 3.2473 & 0.000635 \tabularnewline
57 & 0.152388 & 2.9392 & 0.001748 \tabularnewline
58 & 0.150017 & 2.8934 & 0.002018 \tabularnewline
59 & 0.157802 & 3.0436 & 0.001252 \tabularnewline
60 & 0.165363 & 3.1894 & 0.000773 \tabularnewline
\hline
\end{tabular}
%Source: https://freestatistics.org/blog/index.php?pk=30445&T=1

[TABLE]
[ROW][C]Autocorrelation Function[/C][/ROW]
[ROW][C]Time lag k[/C][C]ACF(k)[/C][C]T-STAT[/C][C]P-value[/C][/ROW]
[ROW][C]1[/C][C]0.958297[/C][C]18.483[/C][C]0[/C][/ROW]
[ROW][C]2[/C][C]0.915218[/C][C]17.6521[/C][C]0[/C][/ROW]
[ROW][C]3[/C][C]0.883412[/C][C]17.0386[/C][C]0[/C][/ROW]
[ROW][C]4[/C][C]0.870088[/C][C]16.7816[/C][C]0[/C][/ROW]
[ROW][C]5[/C][C]0.861735[/C][C]16.6205[/C][C]0[/C][/ROW]
[ROW][C]6[/C][C]0.832367[/C][C]16.0541[/C][C]0[/C][/ROW]
[ROW][C]7[/C][C]0.812153[/C][C]15.6642[/C][C]0[/C][/ROW]
[ROW][C]8[/C][C]0.775095[/C][C]14.9495[/C][C]0[/C][/ROW]
[ROW][C]9[/C][C]0.745592[/C][C]14.3805[/C][C]0[/C][/ROW]
[ROW][C]10[/C][C]0.734652[/C][C]14.1695[/C][C]0[/C][/ROW]
[ROW][C]11[/C][C]0.739154[/C][C]14.2563[/C][C]0[/C][/ROW]
[ROW][C]12[/C][C]0.743705[/C][C]14.3441[/C][C]0[/C][/ROW]
[ROW][C]13[/C][C]0.693188[/C][C]13.3697[/C][C]0[/C][/ROW]
[ROW][C]14[/C][C]0.64416[/C][C]12.4241[/C][C]0[/C][/ROW]
[ROW][C]15[/C][C]0.611393[/C][C]11.7921[/C][C]0[/C][/ROW]
[ROW][C]16[/C][C]0.599793[/C][C]11.5684[/C][C]0[/C][/ROW]
[ROW][C]17[/C][C]0.597409[/C][C]11.5224[/C][C]0[/C][/ROW]
[ROW][C]18[/C][C]0.577954[/C][C]11.1472[/C][C]0[/C][/ROW]
[ROW][C]19[/C][C]0.568953[/C][C]10.9736[/C][C]0[/C][/ROW]
[ROW][C]20[/C][C]0.543776[/C][C]10.488[/C][C]0[/C][/ROW]
[ROW][C]21[/C][C]0.526232[/C][C]10.1496[/C][C]0[/C][/ROW]
[ROW][C]22[/C][C]0.525701[/C][C]10.1394[/C][C]0[/C][/ROW]
[ROW][C]23[/C][C]0.537712[/C][C]10.371[/C][C]0[/C][/ROW]
[ROW][C]24[/C][C]0.551354[/C][C]10.6341[/C][C]0[/C][/ROW]
[ROW][C]25[/C][C]0.512849[/C][C]9.8915[/C][C]0[/C][/ROW]
[ROW][C]26[/C][C]0.475036[/C][C]9.1622[/C][C]0[/C][/ROW]
[ROW][C]27[/C][C]0.45148[/C][C]8.7078[/C][C]0[/C][/ROW]
[ROW][C]28[/C][C]0.446579[/C][C]8.6133[/C][C]0[/C][/ROW]
[ROW][C]29[/C][C]0.44812[/C][C]8.643[/C][C]0[/C][/ROW]
[ROW][C]30[/C][C]0.431867[/C][C]8.3295[/C][C]0[/C][/ROW]
[ROW][C]31[/C][C]0.424902[/C][C]8.1952[/C][C]0[/C][/ROW]
[ROW][C]32[/C][C]0.402821[/C][C]7.7693[/C][C]0[/C][/ROW]
[ROW][C]33[/C][C]0.388339[/C][C]7.49[/C][C]0[/C][/ROW]
[ROW][C]34[/C][C]0.388887[/C][C]7.5006[/C][C]0[/C][/ROW]
[ROW][C]35[/C][C]0.40124[/C][C]7.7388[/C][C]0[/C][/ROW]
[ROW][C]36[/C][C]0.415564[/C][C]8.0151[/C][C]0[/C][/ROW]
[ROW][C]37[/C][C]0.379225[/C][C]7.3142[/C][C]0[/C][/ROW]
[ROW][C]38[/C][C]0.34412[/C][C]6.6371[/C][C]0[/C][/ROW]
[ROW][C]39[/C][C]0.320411[/C][C]6.1799[/C][C]0[/C][/ROW]
[ROW][C]40[/C][C]0.313932[/C][C]6.0549[/C][C]0[/C][/ROW]
[ROW][C]41[/C][C]0.313972[/C][C]6.0557[/C][C]0[/C][/ROW]
[ROW][C]42[/C][C]0.298662[/C][C]5.7604[/C][C]0[/C][/ROW]
[ROW][C]43[/C][C]0.291715[/C][C]5.6264[/C][C]0[/C][/ROW]
[ROW][C]44[/C][C]0.271229[/C][C]5.2313[/C][C]0[/C][/ROW]
[ROW][C]45[/C][C]0.258557[/C][C]4.9869[/C][C]0[/C][/ROW]
[ROW][C]46[/C][C]0.2619[/C][C]5.0513[/C][C]0[/C][/ROW]
[ROW][C]47[/C][C]0.277616[/C][C]5.3545[/C][C]0[/C][/ROW]
[ROW][C]48[/C][C]0.293784[/C][C]5.6663[/C][C]0[/C][/ROW]
[ROW][C]49[/C][C]0.263723[/C][C]5.0865[/C][C]0[/C][/ROW]
[ROW][C]50[/C][C]0.233514[/C][C]4.5039[/C][C]4e-06[/C][/ROW]
[ROW][C]51[/C][C]0.214215[/C][C]4.1316[/C][C]2.2e-05[/C][/ROW]
[ROW][C]52[/C][C]0.20971[/C][C]4.0447[/C][C]3.2e-05[/C][/ROW]
[ROW][C]53[/C][C]0.211375[/C][C]4.0768[/C][C]2.8e-05[/C][/ROW]
[ROW][C]54[/C][C]0.196892[/C][C]3.7975[/C][C]8.5e-05[/C][/ROW]
[ROW][C]55[/C][C]0.19039[/C][C]3.6721[/C][C]0.000138[/C][/ROW]
[ROW][C]56[/C][C]0.168363[/C][C]3.2473[/C][C]0.000635[/C][/ROW]
[ROW][C]57[/C][C]0.152388[/C][C]2.9392[/C][C]0.001748[/C][/ROW]
[ROW][C]58[/C][C]0.150017[/C][C]2.8934[/C][C]0.002018[/C][/ROW]
[ROW][C]59[/C][C]0.157802[/C][C]3.0436[/C][C]0.001252[/C][/ROW]
[ROW][C]60[/C][C]0.165363[/C][C]3.1894[/C][C]0.000773[/C][/ROW]
[/TABLE]
Source: https://freestatistics.org/blog/index.php?pk=30445&T=1

Globally Unique Identifier (entire table): ba.freestatistics.org/blog/index.php?pk=30445&T=1

As an alternative you can also use a QR Code:  

The GUIDs for individual cells are displayed in the table below:

Autocorrelation Function
Time lag kACF(k)T-STATP-value
10.95829718.4830
20.91521817.65210
30.88341217.03860
40.87008816.78160
50.86173516.62050
60.83236716.05410
70.81215315.66420
80.77509514.94950
90.74559214.38050
100.73465214.16950
110.73915414.25630
120.74370514.34410
130.69318813.36970
140.6441612.42410
150.61139311.79210
160.59979311.56840
170.59740911.52240
180.57795411.14720
190.56895310.97360
200.54377610.4880
210.52623210.14960
220.52570110.13940
230.53771210.3710
240.55135410.63410
250.5128499.89150
260.4750369.16220
270.451488.70780
280.4465798.61330
290.448128.6430
300.4318678.32950
310.4249028.19520
320.4028217.76930
330.3883397.490
340.3888877.50060
350.401247.73880
360.4155648.01510
370.3792257.31420
380.344126.63710
390.3204116.17990
400.3139326.05490
410.3139726.05570
420.2986625.76040
430.2917155.62640
440.2712295.23130
450.2585574.98690
460.26195.05130
470.2776165.35450
480.2937845.66630
490.2637235.08650
500.2335144.50394e-06
510.2142154.13162.2e-05
520.209714.04473.2e-05
530.2113754.07682.8e-05
540.1968923.79758.5e-05
550.190393.67210.000138
560.1683633.24730.000635
570.1523882.93920.001748
580.1500172.89340.002018
590.1578023.04360.001252
600.1653633.18940.000773


Partial Autocorrelation Function
Time lag kPACF(k)T-STATP-value
10.95829718.4830
2-0.038138-0.73560.231227
30.1160082.23750.012923
40.2073453.99913.8e-05
50.0712951.37510.084967
6-0.216629-4.17821.8e-05
70.1778433.43010.000336
8-0.280159-5.40350
90.0515850.99490.160206
100.2214434.2711.2e-05
110.1890493.64620.000152
12-0.045031-0.86850.192833
13-0.550158-10.61110
140.0486850.9390.17417
150.1391522.68390.003802
160.0589661.13730.128074
170.1450152.7970.002713
180.0564151.08810.13863
190.0891681.71980.04315
20-0.085304-1.64530.050378
210.0107060.20650.418258
220.0204530.39450.346725
23-0.016396-0.31620.376
240.0564891.08950.138315
25-0.235006-4.53264e-06
260.008890.17150.431974
270.0490980.9470.172137
28-0.018295-0.35290.362198
29-0.002463-0.04750.481071
300.0294940.56890.284897
310.0502210.96860.16668
32-0.006361-0.12270.45121
330.0439290.84730.198693
340.016920.32630.372172
35-0.002393-0.04620.481607
360.0201210.38810.349091
37-0.189406-3.65310.000148
380.0123510.23820.405923
39-0.038849-0.74930.227076
40-0.033337-0.6430.260319
410.0326140.6290.264854
420.0928391.79060.037084
43-0.013284-0.25620.398966
440.0235280.45380.325119
450.0335990.6480.25868
460.0403740.77870.218321
470.0116450.22460.411208
48-0.024423-0.47110.31894
49-0.06699-1.29210.098569
50-0.031084-0.59950.274592
51-0.023084-0.44520.328206
52-0.061509-1.18630.118122
53-0.001646-0.03180.487343
54-0.002282-0.0440.482462
550.0011130.02150.491441
56-0.039442-0.76070.223649
57-0.0128-0.24690.402567
58-0.013281-0.25620.398983
59-0.018742-0.36150.358969
60-0.027922-0.53850.29526

\begin{tabular}{lllllllll}
\hline
Partial Autocorrelation Function \tabularnewline
Time lag k & PACF(k) & T-STAT & P-value \tabularnewline
1 & 0.958297 & 18.483 & 0 \tabularnewline
2 & -0.038138 & -0.7356 & 0.231227 \tabularnewline
3 & 0.116008 & 2.2375 & 0.012923 \tabularnewline
4 & 0.207345 & 3.9991 & 3.8e-05 \tabularnewline
5 & 0.071295 & 1.3751 & 0.084967 \tabularnewline
6 & -0.216629 & -4.1782 & 1.8e-05 \tabularnewline
7 & 0.177843 & 3.4301 & 0.000336 \tabularnewline
8 & -0.280159 & -5.4035 & 0 \tabularnewline
9 & 0.051585 & 0.9949 & 0.160206 \tabularnewline
10 & 0.221443 & 4.271 & 1.2e-05 \tabularnewline
11 & 0.189049 & 3.6462 & 0.000152 \tabularnewline
12 & -0.045031 & -0.8685 & 0.192833 \tabularnewline
13 & -0.550158 & -10.6111 & 0 \tabularnewline
14 & 0.048685 & 0.939 & 0.17417 \tabularnewline
15 & 0.139152 & 2.6839 & 0.003802 \tabularnewline
16 & 0.058966 & 1.1373 & 0.128074 \tabularnewline
17 & 0.145015 & 2.797 & 0.002713 \tabularnewline
18 & 0.056415 & 1.0881 & 0.13863 \tabularnewline
19 & 0.089168 & 1.7198 & 0.04315 \tabularnewline
20 & -0.085304 & -1.6453 & 0.050378 \tabularnewline
21 & 0.010706 & 0.2065 & 0.418258 \tabularnewline
22 & 0.020453 & 0.3945 & 0.346725 \tabularnewline
23 & -0.016396 & -0.3162 & 0.376 \tabularnewline
24 & 0.056489 & 1.0895 & 0.138315 \tabularnewline
25 & -0.235006 & -4.5326 & 4e-06 \tabularnewline
26 & 0.00889 & 0.1715 & 0.431974 \tabularnewline
27 & 0.049098 & 0.947 & 0.172137 \tabularnewline
28 & -0.018295 & -0.3529 & 0.362198 \tabularnewline
29 & -0.002463 & -0.0475 & 0.481071 \tabularnewline
30 & 0.029494 & 0.5689 & 0.284897 \tabularnewline
31 & 0.050221 & 0.9686 & 0.16668 \tabularnewline
32 & -0.006361 & -0.1227 & 0.45121 \tabularnewline
33 & 0.043929 & 0.8473 & 0.198693 \tabularnewline
34 & 0.01692 & 0.3263 & 0.372172 \tabularnewline
35 & -0.002393 & -0.0462 & 0.481607 \tabularnewline
36 & 0.020121 & 0.3881 & 0.349091 \tabularnewline
37 & -0.189406 & -3.6531 & 0.000148 \tabularnewline
38 & 0.012351 & 0.2382 & 0.405923 \tabularnewline
39 & -0.038849 & -0.7493 & 0.227076 \tabularnewline
40 & -0.033337 & -0.643 & 0.260319 \tabularnewline
41 & 0.032614 & 0.629 & 0.264854 \tabularnewline
42 & 0.092839 & 1.7906 & 0.037084 \tabularnewline
43 & -0.013284 & -0.2562 & 0.398966 \tabularnewline
44 & 0.023528 & 0.4538 & 0.325119 \tabularnewline
45 & 0.033599 & 0.648 & 0.25868 \tabularnewline
46 & 0.040374 & 0.7787 & 0.218321 \tabularnewline
47 & 0.011645 & 0.2246 & 0.411208 \tabularnewline
48 & -0.024423 & -0.4711 & 0.31894 \tabularnewline
49 & -0.06699 & -1.2921 & 0.098569 \tabularnewline
50 & -0.031084 & -0.5995 & 0.274592 \tabularnewline
51 & -0.023084 & -0.4452 & 0.328206 \tabularnewline
52 & -0.061509 & -1.1863 & 0.118122 \tabularnewline
53 & -0.001646 & -0.0318 & 0.487343 \tabularnewline
54 & -0.002282 & -0.044 & 0.482462 \tabularnewline
55 & 0.001113 & 0.0215 & 0.491441 \tabularnewline
56 & -0.039442 & -0.7607 & 0.223649 \tabularnewline
57 & -0.0128 & -0.2469 & 0.402567 \tabularnewline
58 & -0.013281 & -0.2562 & 0.398983 \tabularnewline
59 & -0.018742 & -0.3615 & 0.358969 \tabularnewline
60 & -0.027922 & -0.5385 & 0.29526 \tabularnewline
\hline
\end{tabular}
%Source: https://freestatistics.org/blog/index.php?pk=30445&T=2

[TABLE]
[ROW][C]Partial Autocorrelation Function[/C][/ROW]
[ROW][C]Time lag k[/C][C]PACF(k)[/C][C]T-STAT[/C][C]P-value[/C][/ROW]
[ROW][C]1[/C][C]0.958297[/C][C]18.483[/C][C]0[/C][/ROW]
[ROW][C]2[/C][C]-0.038138[/C][C]-0.7356[/C][C]0.231227[/C][/ROW]
[ROW][C]3[/C][C]0.116008[/C][C]2.2375[/C][C]0.012923[/C][/ROW]
[ROW][C]4[/C][C]0.207345[/C][C]3.9991[/C][C]3.8e-05[/C][/ROW]
[ROW][C]5[/C][C]0.071295[/C][C]1.3751[/C][C]0.084967[/C][/ROW]
[ROW][C]6[/C][C]-0.216629[/C][C]-4.1782[/C][C]1.8e-05[/C][/ROW]
[ROW][C]7[/C][C]0.177843[/C][C]3.4301[/C][C]0.000336[/C][/ROW]
[ROW][C]8[/C][C]-0.280159[/C][C]-5.4035[/C][C]0[/C][/ROW]
[ROW][C]9[/C][C]0.051585[/C][C]0.9949[/C][C]0.160206[/C][/ROW]
[ROW][C]10[/C][C]0.221443[/C][C]4.271[/C][C]1.2e-05[/C][/ROW]
[ROW][C]11[/C][C]0.189049[/C][C]3.6462[/C][C]0.000152[/C][/ROW]
[ROW][C]12[/C][C]-0.045031[/C][C]-0.8685[/C][C]0.192833[/C][/ROW]
[ROW][C]13[/C][C]-0.550158[/C][C]-10.6111[/C][C]0[/C][/ROW]
[ROW][C]14[/C][C]0.048685[/C][C]0.939[/C][C]0.17417[/C][/ROW]
[ROW][C]15[/C][C]0.139152[/C][C]2.6839[/C][C]0.003802[/C][/ROW]
[ROW][C]16[/C][C]0.058966[/C][C]1.1373[/C][C]0.128074[/C][/ROW]
[ROW][C]17[/C][C]0.145015[/C][C]2.797[/C][C]0.002713[/C][/ROW]
[ROW][C]18[/C][C]0.056415[/C][C]1.0881[/C][C]0.13863[/C][/ROW]
[ROW][C]19[/C][C]0.089168[/C][C]1.7198[/C][C]0.04315[/C][/ROW]
[ROW][C]20[/C][C]-0.085304[/C][C]-1.6453[/C][C]0.050378[/C][/ROW]
[ROW][C]21[/C][C]0.010706[/C][C]0.2065[/C][C]0.418258[/C][/ROW]
[ROW][C]22[/C][C]0.020453[/C][C]0.3945[/C][C]0.346725[/C][/ROW]
[ROW][C]23[/C][C]-0.016396[/C][C]-0.3162[/C][C]0.376[/C][/ROW]
[ROW][C]24[/C][C]0.056489[/C][C]1.0895[/C][C]0.138315[/C][/ROW]
[ROW][C]25[/C][C]-0.235006[/C][C]-4.5326[/C][C]4e-06[/C][/ROW]
[ROW][C]26[/C][C]0.00889[/C][C]0.1715[/C][C]0.431974[/C][/ROW]
[ROW][C]27[/C][C]0.049098[/C][C]0.947[/C][C]0.172137[/C][/ROW]
[ROW][C]28[/C][C]-0.018295[/C][C]-0.3529[/C][C]0.362198[/C][/ROW]
[ROW][C]29[/C][C]-0.002463[/C][C]-0.0475[/C][C]0.481071[/C][/ROW]
[ROW][C]30[/C][C]0.029494[/C][C]0.5689[/C][C]0.284897[/C][/ROW]
[ROW][C]31[/C][C]0.050221[/C][C]0.9686[/C][C]0.16668[/C][/ROW]
[ROW][C]32[/C][C]-0.006361[/C][C]-0.1227[/C][C]0.45121[/C][/ROW]
[ROW][C]33[/C][C]0.043929[/C][C]0.8473[/C][C]0.198693[/C][/ROW]
[ROW][C]34[/C][C]0.01692[/C][C]0.3263[/C][C]0.372172[/C][/ROW]
[ROW][C]35[/C][C]-0.002393[/C][C]-0.0462[/C][C]0.481607[/C][/ROW]
[ROW][C]36[/C][C]0.020121[/C][C]0.3881[/C][C]0.349091[/C][/ROW]
[ROW][C]37[/C][C]-0.189406[/C][C]-3.6531[/C][C]0.000148[/C][/ROW]
[ROW][C]38[/C][C]0.012351[/C][C]0.2382[/C][C]0.405923[/C][/ROW]
[ROW][C]39[/C][C]-0.038849[/C][C]-0.7493[/C][C]0.227076[/C][/ROW]
[ROW][C]40[/C][C]-0.033337[/C][C]-0.643[/C][C]0.260319[/C][/ROW]
[ROW][C]41[/C][C]0.032614[/C][C]0.629[/C][C]0.264854[/C][/ROW]
[ROW][C]42[/C][C]0.092839[/C][C]1.7906[/C][C]0.037084[/C][/ROW]
[ROW][C]43[/C][C]-0.013284[/C][C]-0.2562[/C][C]0.398966[/C][/ROW]
[ROW][C]44[/C][C]0.023528[/C][C]0.4538[/C][C]0.325119[/C][/ROW]
[ROW][C]45[/C][C]0.033599[/C][C]0.648[/C][C]0.25868[/C][/ROW]
[ROW][C]46[/C][C]0.040374[/C][C]0.7787[/C][C]0.218321[/C][/ROW]
[ROW][C]47[/C][C]0.011645[/C][C]0.2246[/C][C]0.411208[/C][/ROW]
[ROW][C]48[/C][C]-0.024423[/C][C]-0.4711[/C][C]0.31894[/C][/ROW]
[ROW][C]49[/C][C]-0.06699[/C][C]-1.2921[/C][C]0.098569[/C][/ROW]
[ROW][C]50[/C][C]-0.031084[/C][C]-0.5995[/C][C]0.274592[/C][/ROW]
[ROW][C]51[/C][C]-0.023084[/C][C]-0.4452[/C][C]0.328206[/C][/ROW]
[ROW][C]52[/C][C]-0.061509[/C][C]-1.1863[/C][C]0.118122[/C][/ROW]
[ROW][C]53[/C][C]-0.001646[/C][C]-0.0318[/C][C]0.487343[/C][/ROW]
[ROW][C]54[/C][C]-0.002282[/C][C]-0.044[/C][C]0.482462[/C][/ROW]
[ROW][C]55[/C][C]0.001113[/C][C]0.0215[/C][C]0.491441[/C][/ROW]
[ROW][C]56[/C][C]-0.039442[/C][C]-0.7607[/C][C]0.223649[/C][/ROW]
[ROW][C]57[/C][C]-0.0128[/C][C]-0.2469[/C][C]0.402567[/C][/ROW]
[ROW][C]58[/C][C]-0.013281[/C][C]-0.2562[/C][C]0.398983[/C][/ROW]
[ROW][C]59[/C][C]-0.018742[/C][C]-0.3615[/C][C]0.358969[/C][/ROW]
[ROW][C]60[/C][C]-0.027922[/C][C]-0.5385[/C][C]0.29526[/C][/ROW]
[/TABLE]
Source: https://freestatistics.org/blog/index.php?pk=30445&T=2

Globally Unique Identifier (entire table): ba.freestatistics.org/blog/index.php?pk=30445&T=2

As an alternative you can also use a QR Code:  

The GUIDs for individual cells are displayed in the table below:

Partial Autocorrelation Function
Time lag kPACF(k)T-STATP-value
10.95829718.4830
2-0.038138-0.73560.231227
30.1160082.23750.012923
40.2073453.99913.8e-05
50.0712951.37510.084967
6-0.216629-4.17821.8e-05
70.1778433.43010.000336
8-0.280159-5.40350
90.0515850.99490.160206
100.2214434.2711.2e-05
110.1890493.64620.000152
12-0.045031-0.86850.192833
13-0.550158-10.61110
140.0486850.9390.17417
150.1391522.68390.003802
160.0589661.13730.128074
170.1450152.7970.002713
180.0564151.08810.13863
190.0891681.71980.04315
20-0.085304-1.64530.050378
210.0107060.20650.418258
220.0204530.39450.346725
23-0.016396-0.31620.376
240.0564891.08950.138315
25-0.235006-4.53264e-06
260.008890.17150.431974
270.0490980.9470.172137
28-0.018295-0.35290.362198
29-0.002463-0.04750.481071
300.0294940.56890.284897
310.0502210.96860.16668
32-0.006361-0.12270.45121
330.0439290.84730.198693
340.016920.32630.372172
35-0.002393-0.04620.481607
360.0201210.38810.349091
37-0.189406-3.65310.000148
380.0123510.23820.405923
39-0.038849-0.74930.227076
40-0.033337-0.6430.260319
410.0326140.6290.264854
420.0928391.79060.037084
43-0.013284-0.25620.398966
440.0235280.45380.325119
450.0335990.6480.25868
460.0403740.77870.218321
470.0116450.22460.411208
48-0.024423-0.47110.31894
49-0.06699-1.29210.098569
50-0.031084-0.59950.274592
51-0.023084-0.44520.328206
52-0.061509-1.18630.118122
53-0.001646-0.03180.487343
54-0.002282-0.0440.482462
550.0011130.02150.491441
56-0.039442-0.76070.223649
57-0.0128-0.24690.402567
58-0.013281-0.25620.398983
59-0.018742-0.36150.358969
60-0.027922-0.53850.29526


Parameters (Session):
par1 = 60 ; par2 = 1 ; par3 = 0 ; par4 = 0 ; par5 = 12 ;
Parameters (R input):
par1 = 60 ; par2 = 1 ; par3 = 0 ; par4 = 0 ; par5 = 12 ;
R code (references can be found in the software module):
if (par1 == 'Default') {
par1 = 10*log10(length(x))
} else {
par1 <- as.numeric(par1)
}
par2 <- as.numeric(par2)
par3 <- as.numeric(par3)
par4 <- as.numeric(par4)
par5 <- as.numeric(par5)
if (par2 == 0) {
x <- log(x)
} else {
x <- (x ^ par2 - 1) / par2
}
if (par3 > 0) x <- diff(x,lag=1,difference=par3)
if (par4 > 0) x <- diff(x,lag=par5,difference=par4)
bitmap(file='pic1.png')
racf <- acf(x,par1,main='Autocorrelation',xlab='lags',ylab='ACF')
dev.off()
bitmap(file='pic2.png')
rpacf <- pacf(x,par1,main='Partial Autocorrelation',xlab='lags',ylab='PACF')
dev.off()
(myacf <- c(racf$acf))
(mypacf <- c(rpacf$acf))
lengthx <- length(x)
sqrtn <- sqrt(lengthx)
load(file='createtable')
a<-table.start()
a<-table.row.start(a)
a<-table.element(a,'Autocorrelation Function',4,TRUE)
a<-table.row.end(a)
a<-table.row.start(a)
a<-table.element(a,'Time lag k',header=TRUE)
a<-table.element(a,hyperlink('basics.htm','ACF(k)','click here for more information about the Autocorrelation Function'),header=TRUE)
a<-table.element(a,'T-STAT',header=TRUE)
a<-table.element(a,'P-value',header=TRUE)
a<-table.row.end(a)
for (i in 2:(par1+1)) {
a<-table.row.start(a)
a<-table.element(a,i-1,header=TRUE)
a<-table.element(a,round(myacf[i],6))
mytstat <- myacf[i]*sqrtn
a<-table.element(a,round(mytstat,4))
a<-table.element(a,round(1-pt(abs(mytstat),lengthx),6))
a<-table.row.end(a)
}
a<-table.end(a)
table.save(a,file='mytable.tab')
a<-table.start()
a<-table.row.start(a)
a<-table.element(a,'Partial Autocorrelation Function',4,TRUE)
a<-table.row.end(a)
a<-table.row.start(a)
a<-table.element(a,'Time lag k',header=TRUE)
a<-table.element(a,hyperlink('basics.htm','PACF(k)','click here for more information about the Partial Autocorrelation Function'),header=TRUE)
a<-table.element(a,'T-STAT',header=TRUE)
a<-table.element(a,'P-value',header=TRUE)
a<-table.row.end(a)
for (i in 1:par1) {
a<-table.row.start(a)
a<-table.element(a,i,header=TRUE)
a<-table.element(a,round(mypacf[i],6))
mytstat <- mypacf[i]*sqrtn
a<-table.element(a,round(mytstat,4))
a<-table.element(a,round(1-pt(abs(mytstat),lengthx),6))
a<-table.row.end(a)
}
a<-table.end(a)
table.save(a,file='mytable1.tab')