Free Statistics

of Irreproducible Research!

Author's title

Author*The author of this computation has been verified*
R Software Modulerwasp_arimabackwardselection.wasp
Title produced by softwareARIMA Backward Selection
Date of computationMon, 08 Dec 2008 04:46:44 -0700
Cite this page as followsStatistical Computations at FreeStatistics.org, Office for Research Development and Education, URL https://freestatistics.org/blog/index.php?v=date/2008/Dec/08/t1228736866e21tod5wds3g3ll.htm/, Retrieved Thu, 16 May 2024 12:27:55 +0000
Statistical Computations at FreeStatistics.org, Office for Research Development and Education, URL https://freestatistics.org/blog/index.php?pk=30402, Retrieved Thu, 16 May 2024 12:27:55 +0000
QR Codes:

Original text written by user:
IsPrivate?No (this computation is public)
User-defined keywords
Estimated Impact227
Family? (F = Feedback message, R = changed R code, M = changed R Module, P = changed Parameters, D = changed Data)
-     [Univariate Data Series] [data set] [2008-12-01 19:54:57] [b98453cac15ba1066b407e146608df68]
F RMP   [(Partial) Autocorrelation Function] [Taak 10 Stap 2 AC...] [2008-12-03 15:23:42] [6fea0e9a9b3b29a63badf2c274e82506]
-    D    [(Partial) Autocorrelation Function] [Taak 10 Stap 2 AC...] [2008-12-04 18:27:40] [819b576fab25b35cfda70f80599828ec]
F RMP         [ARIMA Backward Selection] [Taak 10 deel 2 st...] [2008-12-08 11:46:44] [286e96bd53289970f8e5f25a93fb50b3] [Current]
-   P           [ARIMA Backward Selection] [Identification an...] [2008-12-08 19:31:33] [79c17183721a40a589db5f9f561947d8]
-   PD          [ARIMA Backward Selection] [Paper - Backward ...] [2008-12-19 18:23:57] [23bfa928dab4b48567707937094f7011]
-    D            [ARIMA Backward Selection] [Paper - Backward ...] [2008-12-20 19:45:16] [23bfa928dab4b48567707937094f7011]
-                 [ARIMA Backward Selection] [Paper - Backward ...] [2008-12-20 19:49:38] [23bfa928dab4b48567707937094f7011]
-   PD          [ARIMA Backward Selection] [ARIMA backwardsel...] [2008-12-20 13:36:52] [513002e53792b228fd07c821aaa4d786]
-    D            [ARIMA Backward Selection] [Arimaproces Bel-20] [2008-12-22 11:33:01] [513002e53792b228fd07c821aaa4d786]
Feedback Forum
2008-12-14 13:25:22 [Matthieu Blondeau] [reply
Hier moet men voor de lambda, d en D de correcte waarde ingeven en voor de p, q, P, Q de maximumwaarden.

De resultaten zien er positief uit.
2008-12-14 13:37:04 [Kevin Neelen] [reply
De student heeft hier gebruik gemaakt van de juiste methode om deze vraagstelling correct op te lossen, namelijk de ARIMA Backward Selection Methode.

De student heeft de volgende gegevens ingevoerd: Lambda = 1 / d = 1 / D = 1 / p = 0 / q = 1 / Max AR = 3 / Max MA = 1 / Max SAR = 2 / Max SMA = 1 / Seasonal period = 12.

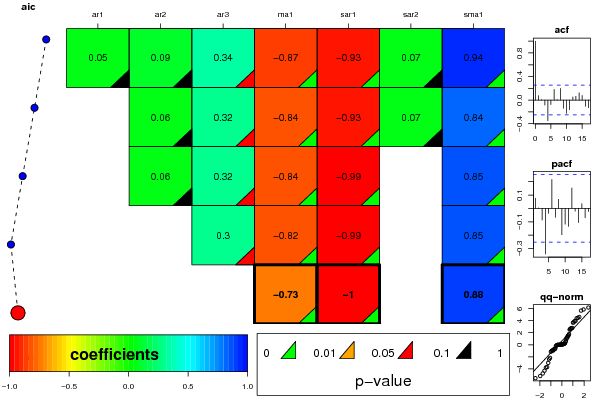
De eerste grafiek toont voor elke rij een model: AR1 = Ф1B, …. De getallen die we in de verschillende blokjes vinden, zijn waarden die ingevuld kunnen worden voor de verschillende Ф-waarden. In elk gekleurd blokje zien we rechtsonder een driehoekje met telkens een bepaalde kleur. In de legenda staat bijvoorbeeld vermeld dat als deze een groene kleur heeft, de p-waarde kleiner is dan 1% (wat uiteraard zeer goed is).

In de eerste rij (= eerste model) zien we dat parameters 1, 2, 3 en 6 niet significant zijn. Deze parameters worden stap voor stap weggelaten, waarbij degene met de hoogste p-waarde als eerste afvalt.

In de tweede rij wordt het model opnieuw berekend maar zonder de eerste parameter. Nu zien we dat parameters 2 en 6 niet significant zijn.
Het proces zoals hierboven beschreven wordt telkens herhaald, totdat alle parameters geldig zijn.

Hiernaast kunnen we dan de kwaliteit van het model gaan onderzoeken aan de hand van de assumpties:

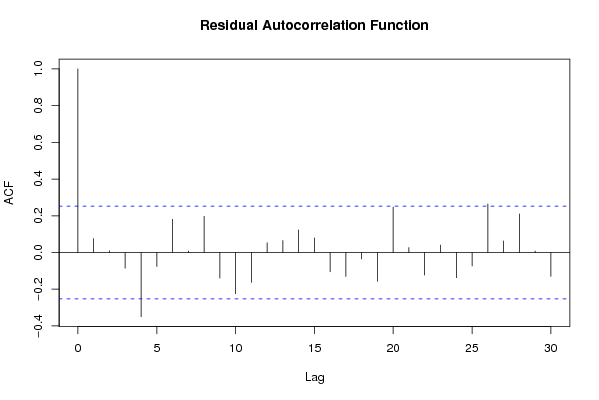
Assumptie 1: Er is geen sprake van autocorrelatie. Er mag gesteld wordend at aan deze assumptie voldaan is op basis van de autocorrelatiegrafiek.

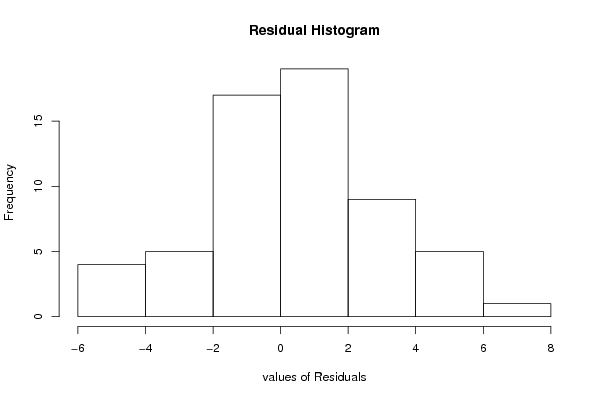
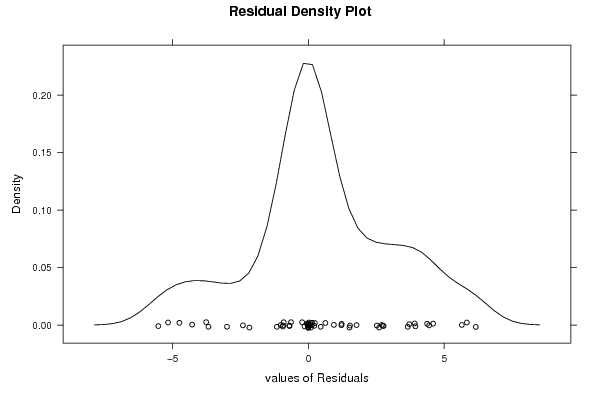
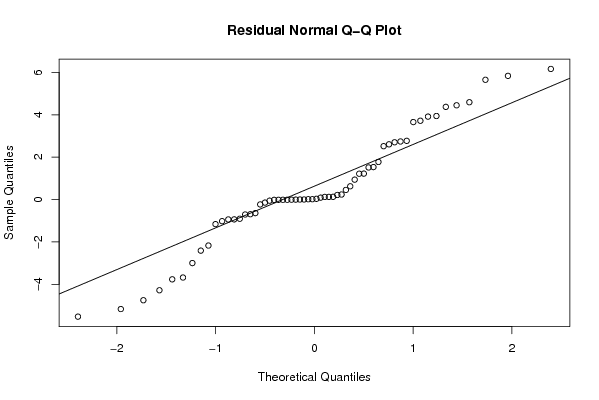
Assumptie 2: Er is sprake van een fixed distrbution. Naar onze mening vertoont het histogram een verdeling die de normaalverdeling voldoende benaderd.
Er is dus ook aan deze assumptie voldaan.

Assumptie 3: Er is sprake van een fixed location. Aangezien de tijdreeks stationair gemaakt is, is er aan deze assumptie voldaan.

Assumptie 4: Er is sprake van een fixed variation. Aangezien de tijdreeks stationair gemaakt is, is er aan deze assumptie voldaan.
  2008-12-14 13:38:17 [Kevin Neelen] [reply
De uiteindelijke vergelijking die geldt voor dit model staat vermeld in het bijgevoegde Word-document.
2008-12-14 14:14:53 [Jeroen Michel] [reply
Hier is een betrouwbare analyse gemaakt. De student legt eerst de grafieken duidelijk uit. Wat is er met andere woorden op af te lezen en waar moet vooral op gelet worden. Op die manier kan de student de verschillende 'assumpties' testen en analyseren. Dit heeft de student ook gedaan. Deze vraag is correct opgelost!
2008-12-14 17:03:43 [Mehmet Yilmaz] [reply
De berekening en conclusies zijn correct.
2008-12-15 10:50:57 [Jef Keersmaekers] [reply
De berekingen zijn correct de student heeft alle assumpties getest
2008-12-15 21:27:46 [Nilay Erdogdu] [reply
de assumpties zijn goed uitgewerkt en ook de berekening werd goed uitgevoerd
2008-12-15 21:50:42 [Michael Van Spaandonck] [reply
De gegevensinvoer is de volgende:
λ = 1
d = 1
D = 1
p = 0
q = 1
Max AR = 3
Max MA = 1
Max SAR = 2
Max SMA = 1
Seasonal period = 12

Ondanks de verschillende waarden die voor P, Q, p en q bekomen werden, wordttelkens het maximum in.

De eerste grafiek toont voor elke rij een model: AR1 = Ф1B, …. De getallen die we in de verschillende blokjes vinden, zijn waarden die ingevuld kunnen worden voor de verschillende Ф-waarden.
In elk gekleurd blokje zien we rechtsonder een driehoekje met telkens een bepaalde kleur. In de legenda staat bijvoorbeeld vermeld dat als deze een groene kleur heeft, de P-waarde kleiner is dan 1% (wat uiteraard zeer goed is).

In de eerste rij (= eerste model) zien we dat parameters 1,2,3 en 6 niet significant zijn. Deze parameters worden stap voor stap weggelaten, waarbij degene met de hoogste p-waarde als eerste afvalt.
In de tweede rij wordt het model opnieuw berekend maar zonder de eerste parameter. Nu zien we dat parameters 2 en 6 niet significant zijn.
Het proces zoals hierboven beschreven wordt telkens herhaald, totdat alle parameters geldig zijn.

De vergelijking ziet er in theorie als volgt uit:
(1 - Ф1B)▼▼12 Yt = (1 - δ1B) (1 – Θ1B12) Et
  2008-12-15 21:54:49 [Michael Van Spaandonck] [reply
Tenslotte nog de assumpties:

Assumptie 1: er is geen autocorrelatie
Er mag gesteld wordend at aan deze assumptie voldaan is op basis van de autocorrelatiegrafiek.

Assumptie 2: Er is sprake van een fixed distrbution.
Het histogram vertoont een verdeling die de normaalverdeling voldoende benaderd.
Er is dus ook aan deze assumptie voldaan.

Assumpties 3 en 4: fixed location en variation
Aangezien de tijdreeks stationair is, is er aan deze assumpties voldaan.

Post a new message
Dataseries X:
58.972
59.249
63.955
53.785
52.760
44.795
37.348
32.370
32.717
40.974
33.591
21.124
58.608
46.865
51.378
46.235
47.206
45.382
41.227
33.795
31.295
42.625
33.625
21.538
56.421
53.152
53.536
52.408
41.454
38.271
35.306
26.414
31.917
38.030
27.534
18.387
50.556
43.901
48.572
43.899
37.532
40.357
35.489
29.027
34.485
42.598
30.306
26.451
47.460
50.104
61.465
53.726
39.477
43.895
31.481
29.896
33.842
39.120
33.702
25.094


Summary of computational transaction
Raw Inputview raw input (R code)
Raw Outputview raw output of R engine
Computing time15 seconds
R Server'Gwilym Jenkins' @ 72.249.127.135

\begin{tabular}{lllllllll}
\hline
Summary of computational transaction \tabularnewline
Raw Input & view raw input (R code)  \tabularnewline
Raw Output & view raw output of R engine  \tabularnewline
Computing time & 15 seconds \tabularnewline
R Server & 'Gwilym Jenkins' @ 72.249.127.135 \tabularnewline
\hline
\end{tabular}
%Source: https://freestatistics.org/blog/index.php?pk=30402&T=0

[TABLE]
[ROW][C]Summary of computational transaction[/C][/ROW]
[ROW][C]Raw Input[/C][C]view raw input (R code) [/C][/ROW]
[ROW][C]Raw Output[/C][C]view raw output of R engine [/C][/ROW]
[ROW][C]Computing time[/C][C]15 seconds[/C][/ROW]
[ROW][C]R Server[/C][C]'Gwilym Jenkins' @ 72.249.127.135[/C][/ROW]
[/TABLE]
Source: https://freestatistics.org/blog/index.php?pk=30402&T=0

Globally Unique Identifier (entire table): ba.freestatistics.org/blog/index.php?pk=30402&T=0

As an alternative you can also use a QR Code:  

The GUIDs for individual cells are displayed in the table below:

Summary of computational transaction
Raw Inputview raw input (R code)
Raw Outputview raw output of R engine
Computing time15 seconds
R Server'Gwilym Jenkins' @ 72.249.127.135


ARIMA Parameter Estimation and Backward Selection
Iterationar1ar2ar3ma1sar1sar2sma1
Estimates ( 1 )0.05220.09170.3382-0.8743-0.9270.07210.9369
(p-val)(0.8395 )(0.6761 )(0.0889 )(0 )(3e-04 )(0.7657 )(0.006 )
Estimates ( 2 )00.05790.3167-0.8367-0.92550.06860.8354
(p-val)(NA )(0.7453 )(0.0804 )(0 )(3e-04 )(0.7735 )(0 )
Estimates ( 3 )00.06080.3178-0.8356-0.994500.8481
(p-val)(NA )(0.7318 )(0.0787 )(0 )(0 )(NA )(0 )
Estimates ( 4 )000.3043-0.816-0.994900.8532
(p-val)(NA )(NA )(0.078 )(0 )(0 )(NA )(0 )
Estimates ( 5 )000-0.7342-0.995400.8836
(p-val)(NA )(NA )(NA )(0 )(0 )(NA )(0 )
Estimates ( 6 )NANANANANANANA
(p-val)(NA )(NA )(NA )(NA )(NA )(NA )(NA )
Estimates ( 7 )NANANANANANANA
(p-val)(NA )(NA )(NA )(NA )(NA )(NA )(NA )
Estimates ( 8 )NANANANANANANA
(p-val)(NA )(NA )(NA )(NA )(NA )(NA )(NA )
Estimates ( 9 )NANANANANANANA
(p-val)(NA )(NA )(NA )(NA )(NA )(NA )(NA )
Estimates ( 10 )NANANANANANANA
(p-val)(NA )(NA )(NA )(NA )(NA )(NA )(NA )
Estimates ( 11 )NANANANANANANA
(p-val)(NA )(NA )(NA )(NA )(NA )(NA )(NA )
Estimates ( 12 )NANANANANANANA
(p-val)(NA )(NA )(NA )(NA )(NA )(NA )(NA )
Estimates ( 13 )NANANANANANANA
(p-val)(NA )(NA )(NA )(NA )(NA )(NA )(NA )

\begin{tabular}{lllllllll}
\hline
ARIMA Parameter Estimation and Backward Selection \tabularnewline
Iteration & ar1 & ar2 & ar3 & ma1 & sar1 & sar2 & sma1 \tabularnewline
Estimates ( 1 ) & 0.0522 & 0.0917 & 0.3382 & -0.8743 & -0.927 & 0.0721 & 0.9369 \tabularnewline
(p-val) & (0.8395 ) & (0.6761 ) & (0.0889 ) & (0 ) & (3e-04 ) & (0.7657 ) & (0.006 ) \tabularnewline
Estimates ( 2 ) & 0 & 0.0579 & 0.3167 & -0.8367 & -0.9255 & 0.0686 & 0.8354 \tabularnewline
(p-val) & (NA ) & (0.7453 ) & (0.0804 ) & (0 ) & (3e-04 ) & (0.7735 ) & (0 ) \tabularnewline
Estimates ( 3 ) & 0 & 0.0608 & 0.3178 & -0.8356 & -0.9945 & 0 & 0.8481 \tabularnewline
(p-val) & (NA ) & (0.7318 ) & (0.0787 ) & (0 ) & (0 ) & (NA ) & (0 ) \tabularnewline
Estimates ( 4 ) & 0 & 0 & 0.3043 & -0.816 & -0.9949 & 0 & 0.8532 \tabularnewline
(p-val) & (NA ) & (NA ) & (0.078 ) & (0 ) & (0 ) & (NA ) & (0 ) \tabularnewline
Estimates ( 5 ) & 0 & 0 & 0 & -0.7342 & -0.9954 & 0 & 0.8836 \tabularnewline
(p-val) & (NA ) & (NA ) & (NA ) & (0 ) & (0 ) & (NA ) & (0 ) \tabularnewline
Estimates ( 6 ) & NA & NA & NA & NA & NA & NA & NA \tabularnewline
(p-val) & (NA ) & (NA ) & (NA ) & (NA ) & (NA ) & (NA ) & (NA ) \tabularnewline
Estimates ( 7 ) & NA & NA & NA & NA & NA & NA & NA \tabularnewline
(p-val) & (NA ) & (NA ) & (NA ) & (NA ) & (NA ) & (NA ) & (NA ) \tabularnewline
Estimates ( 8 ) & NA & NA & NA & NA & NA & NA & NA \tabularnewline
(p-val) & (NA ) & (NA ) & (NA ) & (NA ) & (NA ) & (NA ) & (NA ) \tabularnewline
Estimates ( 9 ) & NA & NA & NA & NA & NA & NA & NA \tabularnewline
(p-val) & (NA ) & (NA ) & (NA ) & (NA ) & (NA ) & (NA ) & (NA ) \tabularnewline
Estimates ( 10 ) & NA & NA & NA & NA & NA & NA & NA \tabularnewline
(p-val) & (NA ) & (NA ) & (NA ) & (NA ) & (NA ) & (NA ) & (NA ) \tabularnewline
Estimates ( 11 ) & NA & NA & NA & NA & NA & NA & NA \tabularnewline
(p-val) & (NA ) & (NA ) & (NA ) & (NA ) & (NA ) & (NA ) & (NA ) \tabularnewline
Estimates ( 12 ) & NA & NA & NA & NA & NA & NA & NA \tabularnewline
(p-val) & (NA ) & (NA ) & (NA ) & (NA ) & (NA ) & (NA ) & (NA ) \tabularnewline
Estimates ( 13 ) & NA & NA & NA & NA & NA & NA & NA \tabularnewline
(p-val) & (NA ) & (NA ) & (NA ) & (NA ) & (NA ) & (NA ) & (NA ) \tabularnewline
\hline
\end{tabular}
%Source: https://freestatistics.org/blog/index.php?pk=30402&T=1

[TABLE]
[ROW][C]ARIMA Parameter Estimation and Backward Selection[/C][/ROW]
[ROW][C]Iteration[/C][C]ar1[/C][C]ar2[/C][C]ar3[/C][C]ma1[/C][C]sar1[/C][C]sar2[/C][C]sma1[/C][/ROW]
[ROW][C]Estimates ( 1 )[/C][C]0.0522[/C][C]0.0917[/C][C]0.3382[/C][C]-0.8743[/C][C]-0.927[/C][C]0.0721[/C][C]0.9369[/C][/ROW]
[ROW][C](p-val)[/C][C](0.8395 )[/C][C](0.6761 )[/C][C](0.0889 )[/C][C](0 )[/C][C](3e-04 )[/C][C](0.7657 )[/C][C](0.006 )[/C][/ROW]
[ROW][C]Estimates ( 2 )[/C][C]0[/C][C]0.0579[/C][C]0.3167[/C][C]-0.8367[/C][C]-0.9255[/C][C]0.0686[/C][C]0.8354[/C][/ROW]
[ROW][C](p-val)[/C][C](NA )[/C][C](0.7453 )[/C][C](0.0804 )[/C][C](0 )[/C][C](3e-04 )[/C][C](0.7735 )[/C][C](0 )[/C][/ROW]
[ROW][C]Estimates ( 3 )[/C][C]0[/C][C]0.0608[/C][C]0.3178[/C][C]-0.8356[/C][C]-0.9945[/C][C]0[/C][C]0.8481[/C][/ROW]
[ROW][C](p-val)[/C][C](NA )[/C][C](0.7318 )[/C][C](0.0787 )[/C][C](0 )[/C][C](0 )[/C][C](NA )[/C][C](0 )[/C][/ROW]
[ROW][C]Estimates ( 4 )[/C][C]0[/C][C]0[/C][C]0.3043[/C][C]-0.816[/C][C]-0.9949[/C][C]0[/C][C]0.8532[/C][/ROW]
[ROW][C](p-val)[/C][C](NA )[/C][C](NA )[/C][C](0.078 )[/C][C](0 )[/C][C](0 )[/C][C](NA )[/C][C](0 )[/C][/ROW]
[ROW][C]Estimates ( 5 )[/C][C]0[/C][C]0[/C][C]0[/C][C]-0.7342[/C][C]-0.9954[/C][C]0[/C][C]0.8836[/C][/ROW]
[ROW][C](p-val)[/C][C](NA )[/C][C](NA )[/C][C](NA )[/C][C](0 )[/C][C](0 )[/C][C](NA )[/C][C](0 )[/C][/ROW]
[ROW][C]Estimates ( 6 )[/C][C]NA[/C][C]NA[/C][C]NA[/C][C]NA[/C][C]NA[/C][C]NA[/C][C]NA[/C][/ROW]
[ROW][C](p-val)[/C][C](NA )[/C][C](NA )[/C][C](NA )[/C][C](NA )[/C][C](NA )[/C][C](NA )[/C][C](NA )[/C][/ROW]
[ROW][C]Estimates ( 7 )[/C][C]NA[/C][C]NA[/C][C]NA[/C][C]NA[/C][C]NA[/C][C]NA[/C][C]NA[/C][/ROW]
[ROW][C](p-val)[/C][C](NA )[/C][C](NA )[/C][C](NA )[/C][C](NA )[/C][C](NA )[/C][C](NA )[/C][C](NA )[/C][/ROW]
[ROW][C]Estimates ( 8 )[/C][C]NA[/C][C]NA[/C][C]NA[/C][C]NA[/C][C]NA[/C][C]NA[/C][C]NA[/C][/ROW]
[ROW][C](p-val)[/C][C](NA )[/C][C](NA )[/C][C](NA )[/C][C](NA )[/C][C](NA )[/C][C](NA )[/C][C](NA )[/C][/ROW]
[ROW][C]Estimates ( 9 )[/C][C]NA[/C][C]NA[/C][C]NA[/C][C]NA[/C][C]NA[/C][C]NA[/C][C]NA[/C][/ROW]
[ROW][C](p-val)[/C][C](NA )[/C][C](NA )[/C][C](NA )[/C][C](NA )[/C][C](NA )[/C][C](NA )[/C][C](NA )[/C][/ROW]
[ROW][C]Estimates ( 10 )[/C][C]NA[/C][C]NA[/C][C]NA[/C][C]NA[/C][C]NA[/C][C]NA[/C][C]NA[/C][/ROW]
[ROW][C](p-val)[/C][C](NA )[/C][C](NA )[/C][C](NA )[/C][C](NA )[/C][C](NA )[/C][C](NA )[/C][C](NA )[/C][/ROW]
[ROW][C]Estimates ( 11 )[/C][C]NA[/C][C]NA[/C][C]NA[/C][C]NA[/C][C]NA[/C][C]NA[/C][C]NA[/C][/ROW]
[ROW][C](p-val)[/C][C](NA )[/C][C](NA )[/C][C](NA )[/C][C](NA )[/C][C](NA )[/C][C](NA )[/C][C](NA )[/C][/ROW]
[ROW][C]Estimates ( 12 )[/C][C]NA[/C][C]NA[/C][C]NA[/C][C]NA[/C][C]NA[/C][C]NA[/C][C]NA[/C][/ROW]
[ROW][C](p-val)[/C][C](NA )[/C][C](NA )[/C][C](NA )[/C][C](NA )[/C][C](NA )[/C][C](NA )[/C][C](NA )[/C][/ROW]
[ROW][C]Estimates ( 13 )[/C][C]NA[/C][C]NA[/C][C]NA[/C][C]NA[/C][C]NA[/C][C]NA[/C][C]NA[/C][/ROW]
[ROW][C](p-val)[/C][C](NA )[/C][C](NA )[/C][C](NA )[/C][C](NA )[/C][C](NA )[/C][C](NA )[/C][C](NA )[/C][/ROW]
[/TABLE]
Source: https://freestatistics.org/blog/index.php?pk=30402&T=1

Globally Unique Identifier (entire table): ba.freestatistics.org/blog/index.php?pk=30402&T=1

As an alternative you can also use a QR Code:  

The GUIDs for individual cells are displayed in the table below:

ARIMA Parameter Estimation and Backward Selection
Iterationar1ar2ar3ma1sar1sar2sma1
Estimates ( 1 )0.05220.09170.3382-0.8743-0.9270.07210.9369
(p-val)(0.8395 )(0.6761 )(0.0889 )(0 )(3e-04 )(0.7657 )(0.006 )
Estimates ( 2 )00.05790.3167-0.8367-0.92550.06860.8354
(p-val)(NA )(0.7453 )(0.0804 )(0 )(3e-04 )(0.7735 )(0 )
Estimates ( 3 )00.06080.3178-0.8356-0.994500.8481
(p-val)(NA )(0.7318 )(0.0787 )(0 )(0 )(NA )(0 )
Estimates ( 4 )000.3043-0.816-0.994900.8532
(p-val)(NA )(NA )(0.078 )(0 )(0 )(NA )(0 )
Estimates ( 5 )000-0.7342-0.995400.8836
(p-val)(NA )(NA )(NA )(0 )(0 )(NA )(0 )
Estimates ( 6 )NANANANANANANA
(p-val)(NA )(NA )(NA )(NA )(NA )(NA )(NA )
Estimates ( 7 )NANANANANANANA
(p-val)(NA )(NA )(NA )(NA )(NA )(NA )(NA )
Estimates ( 8 )NANANANANANANA
(p-val)(NA )(NA )(NA )(NA )(NA )(NA )(NA )
Estimates ( 9 )NANANANANANANA
(p-val)(NA )(NA )(NA )(NA )(NA )(NA )(NA )
Estimates ( 10 )NANANANANANANA
(p-val)(NA )(NA )(NA )(NA )(NA )(NA )(NA )
Estimates ( 11 )NANANANANANANA
(p-val)(NA )(NA )(NA )(NA )(NA )(NA )(NA )
Estimates ( 12 )NANANANANANANA
(p-val)(NA )(NA )(NA )(NA )(NA )(NA )(NA )
Estimates ( 13 )NANANANANANANA
(p-val)(NA )(NA )(NA )(NA )(NA )(NA )(NA )


Estimated ARIMA Residuals
Value
-0.144923334095498
-5.1691317596994
-2.99953596466359
-0.641362726357153
2.60482367297805
5.6508445496222
5.83651843896891
2.51769291822945
-0.693243862905836
1.51360949121707
-0.706442056249958
0.122535382240684
1.21676400053233
1.22294194766579
-2.41239824111930
3.71794230161252
-5.52773979798823
-0.936320182990079
0.0886737135937441
0.236288635554518
4.44705264345116
-0.231137983461625
-1.02081987402379
0.624798417346145
-4.28210268766459
1.53100880534621
2.70169588332928
0.451942796363332
-2.17204829550406
0.123810848100870
-1.16181733807775
1.7732367016091
4.59152785729607
3.65544830144711
0.127414352100271
4.37326949359586
-4.75304098499834
-0.90774605825536
6.16266232678476
3.91389279471005
0.215555588532382
2.76964772889111
-3.76648158133677
2.74047408865218
-3.68150510308133
-0.940427621654915
3.94171773882842
0.938185905801925

\begin{tabular}{lllllllll}
\hline
Estimated ARIMA Residuals \tabularnewline
Value \tabularnewline
-0.144923334095498 \tabularnewline
-5.1691317596994 \tabularnewline
-2.99953596466359 \tabularnewline
-0.641362726357153 \tabularnewline
2.60482367297805 \tabularnewline
5.6508445496222 \tabularnewline
5.83651843896891 \tabularnewline
2.51769291822945 \tabularnewline
-0.693243862905836 \tabularnewline
1.51360949121707 \tabularnewline
-0.706442056249958 \tabularnewline
0.122535382240684 \tabularnewline
1.21676400053233 \tabularnewline
1.22294194766579 \tabularnewline
-2.41239824111930 \tabularnewline
3.71794230161252 \tabularnewline
-5.52773979798823 \tabularnewline
-0.936320182990079 \tabularnewline
0.0886737135937441 \tabularnewline
0.236288635554518 \tabularnewline
4.44705264345116 \tabularnewline
-0.231137983461625 \tabularnewline
-1.02081987402379 \tabularnewline
0.624798417346145 \tabularnewline
-4.28210268766459 \tabularnewline
1.53100880534621 \tabularnewline
2.70169588332928 \tabularnewline
0.451942796363332 \tabularnewline
-2.17204829550406 \tabularnewline
0.123810848100870 \tabularnewline
-1.16181733807775 \tabularnewline
1.7732367016091 \tabularnewline
4.59152785729607 \tabularnewline
3.65544830144711 \tabularnewline
0.127414352100271 \tabularnewline
4.37326949359586 \tabularnewline
-4.75304098499834 \tabularnewline
-0.90774605825536 \tabularnewline
6.16266232678476 \tabularnewline
3.91389279471005 \tabularnewline
0.215555588532382 \tabularnewline
2.76964772889111 \tabularnewline
-3.76648158133677 \tabularnewline
2.74047408865218 \tabularnewline
-3.68150510308133 \tabularnewline
-0.940427621654915 \tabularnewline
3.94171773882842 \tabularnewline
0.938185905801925 \tabularnewline
\hline
\end{tabular}
%Source: https://freestatistics.org/blog/index.php?pk=30402&T=2

[TABLE]
[ROW][C]Estimated ARIMA Residuals[/C][/ROW]
[ROW][C]Value[/C][/ROW]
[ROW][C]-0.144923334095498[/C][/ROW]
[ROW][C]-5.1691317596994[/C][/ROW]
[ROW][C]-2.99953596466359[/C][/ROW]
[ROW][C]-0.641362726357153[/C][/ROW]
[ROW][C]2.60482367297805[/C][/ROW]
[ROW][C]5.6508445496222[/C][/ROW]
[ROW][C]5.83651843896891[/C][/ROW]
[ROW][C]2.51769291822945[/C][/ROW]
[ROW][C]-0.693243862905836[/C][/ROW]
[ROW][C]1.51360949121707[/C][/ROW]
[ROW][C]-0.706442056249958[/C][/ROW]
[ROW][C]0.122535382240684[/C][/ROW]
[ROW][C]1.21676400053233[/C][/ROW]
[ROW][C]1.22294194766579[/C][/ROW]
[ROW][C]-2.41239824111930[/C][/ROW]
[ROW][C]3.71794230161252[/C][/ROW]
[ROW][C]-5.52773979798823[/C][/ROW]
[ROW][C]-0.936320182990079[/C][/ROW]
[ROW][C]0.0886737135937441[/C][/ROW]
[ROW][C]0.236288635554518[/C][/ROW]
[ROW][C]4.44705264345116[/C][/ROW]
[ROW][C]-0.231137983461625[/C][/ROW]
[ROW][C]-1.02081987402379[/C][/ROW]
[ROW][C]0.624798417346145[/C][/ROW]
[ROW][C]-4.28210268766459[/C][/ROW]
[ROW][C]1.53100880534621[/C][/ROW]
[ROW][C]2.70169588332928[/C][/ROW]
[ROW][C]0.451942796363332[/C][/ROW]
[ROW][C]-2.17204829550406[/C][/ROW]
[ROW][C]0.123810848100870[/C][/ROW]
[ROW][C]-1.16181733807775[/C][/ROW]
[ROW][C]1.7732367016091[/C][/ROW]
[ROW][C]4.59152785729607[/C][/ROW]
[ROW][C]3.65544830144711[/C][/ROW]
[ROW][C]0.127414352100271[/C][/ROW]
[ROW][C]4.37326949359586[/C][/ROW]
[ROW][C]-4.75304098499834[/C][/ROW]
[ROW][C]-0.90774605825536[/C][/ROW]
[ROW][C]6.16266232678476[/C][/ROW]
[ROW][C]3.91389279471005[/C][/ROW]
[ROW][C]0.215555588532382[/C][/ROW]
[ROW][C]2.76964772889111[/C][/ROW]
[ROW][C]-3.76648158133677[/C][/ROW]
[ROW][C]2.74047408865218[/C][/ROW]
[ROW][C]-3.68150510308133[/C][/ROW]
[ROW][C]-0.940427621654915[/C][/ROW]
[ROW][C]3.94171773882842[/C][/ROW]
[ROW][C]0.938185905801925[/C][/ROW]
[/TABLE]
Source: https://freestatistics.org/blog/index.php?pk=30402&T=2

Globally Unique Identifier (entire table): ba.freestatistics.org/blog/index.php?pk=30402&T=2

As an alternative you can also use a QR Code:  

The GUIDs for individual cells are displayed in the table below:

Estimated ARIMA Residuals
Value
-0.144923334095498
-5.1691317596994
-2.99953596466359
-0.641362726357153
2.60482367297805
5.6508445496222
5.83651843896891
2.51769291822945
-0.693243862905836
1.51360949121707
-0.706442056249958
0.122535382240684
1.21676400053233
1.22294194766579
-2.41239824111930
3.71794230161252
-5.52773979798823
-0.936320182990079
0.0886737135937441
0.236288635554518
4.44705264345116
-0.231137983461625
-1.02081987402379
0.624798417346145
-4.28210268766459
1.53100880534621
2.70169588332928
0.451942796363332
-2.17204829550406
0.123810848100870
-1.16181733807775
1.7732367016091
4.59152785729607
3.65544830144711
0.127414352100271
4.37326949359586
-4.75304098499834
-0.90774605825536
6.16266232678476
3.91389279471005
0.215555588532382
2.76964772889111
-3.76648158133677
2.74047408865218
-3.68150510308133
-0.940427621654915
3.94171773882842
0.938185905801925


Parameters (Session):
par1 = FALSE ; par2 = 1 ; par3 = 1 ; par4 = 1 ; par5 = 12 ; par6 = 3 ; par7 = 1 ; par8 = 2 ; par9 = 1 ;
Parameters (R input):
par1 = FALSE ; par2 = 1 ; par3 = 1 ; par4 = 1 ; par5 = 12 ; par6 = 3 ; par7 = 1 ; par8 = 2 ; par9 = 1 ;
R code (references can be found in the software module):
library(lattice)
if (par1 == 'TRUE') par1 <- TRUE
if (par1 == 'FALSE') par1 <- FALSE
par2 <- as.numeric(par2) #Box-Cox lambda transformation parameter
par3 <- as.numeric(par3) #degree of non-seasonal differencing
par4 <- as.numeric(par4) #degree of seasonal differencing
par5 <- as.numeric(par5) #seasonal period
par6 <- as.numeric(par6) #degree (p) of the non-seasonal AR(p) polynomial
par7 <- as.numeric(par7) #degree (q) of the non-seasonal MA(q) polynomial
par8 <- as.numeric(par8) #degree (P) of the seasonal AR(P) polynomial
par9 <- as.numeric(par9) #degree (Q) of the seasonal MA(Q) polynomial
armaGR <- function(arima.out, names, n){
try1 <- arima.out$coef
try2 <- sqrt(diag(arima.out$var.coef))
try.data.frame <- data.frame(matrix(NA,ncol=4,nrow=length(names)))
dimnames(try.data.frame) <- list(names,c('coef','std','tstat','pv'))
try.data.frame[,1] <- try1
for(i in 1:length(try2)) try.data.frame[which(rownames(try.data.frame)==names(try2)[i]),2] <- try2[i]
try.data.frame[,3] <- try.data.frame[,1] / try.data.frame[,2]
try.data.frame[,4] <- round((1-pt(abs(try.data.frame[,3]),df=n-(length(try2)+1)))*2,5)
vector <- rep(NA,length(names))
vector[is.na(try.data.frame[,4])] <- 0
maxi <- which.max(try.data.frame[,4])
continue <- max(try.data.frame[,4],na.rm=TRUE) > .05
vector[maxi] <- 0
list(summary=try.data.frame,next.vector=vector,continue=continue)
}
arimaSelect <- function(series, order=c(13,0,0), seasonal=list(order=c(2,0,0),period=12), include.mean=F){
nrc <- order[1]+order[3]+seasonal$order[1]+seasonal$order[3]
coeff <- matrix(NA, nrow=nrc*2, ncol=nrc)
pval <- matrix(NA, nrow=nrc*2, ncol=nrc)
mylist <- rep(list(NULL), nrc)
names <- NULL
if(order[1] > 0) names <- paste('ar',1:order[1],sep='')
if(order[3] > 0) names <- c( names , paste('ma',1:order[3],sep='') )
if(seasonal$order[1] > 0) names <- c(names, paste('sar',1:seasonal$order[1],sep=''))
if(seasonal$order[3] > 0) names <- c(names, paste('sma',1:seasonal$order[3],sep=''))
arima.out <- arima(series, order=order, seasonal=seasonal, include.mean=include.mean, method='ML')
mylist[[1]] <- arima.out
last.arma <- armaGR(arima.out, names, length(series))
mystop <- FALSE
i <- 1
coeff[i,] <- last.arma[[1]][,1]
pval [i,] <- last.arma[[1]][,4]
i <- 2
aic <- arima.out$aic
while(!mystop){
mylist[[i]] <- arima.out
arima.out <- arima(series, order=order, seasonal=seasonal, include.mean=include.mean, method='ML', fixed=last.arma$next.vector)
aic <- c(aic, arima.out$aic)
last.arma <- armaGR(arima.out, names, length(series))
mystop <- !last.arma$continue
coeff[i,] <- last.arma[[1]][,1]
pval [i,] <- last.arma[[1]][,4]
i <- i+1
}
list(coeff, pval, mylist, aic=aic)
}
arimaSelectplot <- function(arimaSelect.out,noms,choix){
noms <- names(arimaSelect.out[[3]][[1]]$coef)
coeff <- arimaSelect.out[[1]]
k <- min(which(is.na(coeff[,1])))-1
coeff <- coeff[1:k,]
pval <- arimaSelect.out[[2]][1:k,]
aic <- arimaSelect.out$aic[1:k]
coeff[coeff==0] <- NA
n <- ncol(coeff)
if(missing(choix)) choix <- k
layout(matrix(c(1,1,1,2,
3,3,3,2,
3,3,3,4,
5,6,7,7),nr=4),
widths=c(10,35,45,15),
heights=c(30,30,15,15))
couleurs <- rainbow(75)[1:50]#(50)
ticks <- pretty(coeff)
par(mar=c(1,1,3,1))
plot(aic,k:1-.5,type='o',pch=21,bg='blue',cex=2,axes=F,lty=2,xpd=NA)
points(aic[choix],k-choix+.5,pch=21,cex=4,bg=2,xpd=NA)
title('aic',line=2)
par(mar=c(3,0,0,0))
plot(0,axes=F,xlab='',ylab='',xlim=range(ticks),ylim=c(.1,1))
rect(xleft = min(ticks) + (0:49)/50*(max(ticks)-min(ticks)),
xright = min(ticks) + (1:50)/50*(max(ticks)-min(ticks)),
ytop = rep(1,50),
ybottom= rep(0,50),col=couleurs,border=NA)
axis(1,ticks)
rect(xleft=min(ticks),xright=max(ticks),ytop=1,ybottom=0)
text(mean(coeff,na.rm=T),.5,'coefficients',cex=2,font=2)
par(mar=c(1,1,3,1))
image(1:n,1:k,t(coeff[k:1,]),axes=F,col=couleurs,zlim=range(ticks))
for(i in 1:n) for(j in 1:k) if(!is.na(coeff[j,i])) {
if(pval[j,i]<.01) symb = 'green'
else if( (pval[j,i]<.05) & (pval[j,i]>=.01)) symb = 'orange'
else if( (pval[j,i]<.1) & (pval[j,i]>=.05)) symb = 'red'
else symb = 'black'
polygon(c(i+.5 ,i+.2 ,i+.5 ,i+.5),
c(k-j+0.5,k-j+0.5,k-j+0.8,k-j+0.5),
col=symb)
if(j==choix) {
rect(xleft=i-.5,
xright=i+.5,
ybottom=k-j+1.5,
ytop=k-j+.5,
lwd=4)
text(i,
k-j+1,
round(coeff[j,i],2),
cex=1.2,
font=2)
}
else{
rect(xleft=i-.5,xright=i+.5,ybottom=k-j+1.5,ytop=k-j+.5)
text(i,k-j+1,round(coeff[j,i],2),cex=1.2,font=1)
}
}
axis(3,1:n,noms)
par(mar=c(0.5,0,0,0.5))
plot(0,axes=F,xlab='',ylab='',type='n',xlim=c(0,8),ylim=c(-.2,.8))
cols <- c('green','orange','red','black')
niv <- c('0','0.01','0.05','0.1')
for(i in 0:3){
polygon(c(1+2*i ,1+2*i ,1+2*i-.5 ,1+2*i),
c(.4 ,.7 , .4 , .4),
col=cols[i+1])
text(2*i,0.5,niv[i+1],cex=1.5)
}
text(8,.5,1,cex=1.5)
text(4,0,'p-value',cex=2)
box()
residus <- arimaSelect.out[[3]][[choix]]$res
par(mar=c(1,2,4,1))
acf(residus,main='')
title('acf',line=.5)
par(mar=c(1,2,4,1))
pacf(residus,main='')
title('pacf',line=.5)
par(mar=c(2,2,4,1))
qqnorm(residus,main='')
title('qq-norm',line=.5)
qqline(residus)
residus
}
if (par2 == 0) x <- log(x)
if (par2 != 0) x <- x^par2
(selection <- arimaSelect(x, order=c(par6,par3,par7), seasonal=list(order=c(par8,par4,par9), period=par5)))
bitmap(file='test1.png')
resid <- arimaSelectplot(selection)
dev.off()
resid
bitmap(file='test2.png')
acf(resid,length(resid)/2, main='Residual Autocorrelation Function')
dev.off()
bitmap(file='test3.png')
pacf(resid,length(resid)/2, main='Residual Partial Autocorrelation Function')
dev.off()
bitmap(file='test4.png')
cpgram(resid, main='Residual Cumulative Periodogram')
dev.off()
bitmap(file='test5.png')
hist(resid, main='Residual Histogram', xlab='values of Residuals')
dev.off()
bitmap(file='test6.png')
densityplot(~resid,col='black',main='Residual Density Plot', xlab='values of Residuals')
dev.off()
bitmap(file='test7.png')
qqnorm(resid, main='Residual Normal Q-Q Plot')
qqline(resid)
dev.off()
ncols <- length(selection[[1]][1,])
nrows <- length(selection[[2]][,1])-1
load(file='createtable')
a<-table.start()
a<-table.row.start(a)
a<-table.element(a,'ARIMA Parameter Estimation and Backward Selection', ncols+1,TRUE)
a<-table.row.end(a)
a<-table.row.start(a)
a<-table.element(a,'Iteration', header=TRUE)
for (i in 1:ncols) {
a<-table.element(a,names(selection[[3]][[1]]$coef)[i],header=TRUE)
}
a<-table.row.end(a)
for (j in 1:nrows) {
a<-table.row.start(a)
mydum <- 'Estimates ('
mydum <- paste(mydum,j)
mydum <- paste(mydum,')')
a<-table.element(a,mydum, header=TRUE)
for (i in 1:ncols) {
a<-table.element(a,round(selection[[1]][j,i],4))
}
a<-table.row.end(a)
a<-table.row.start(a)
a<-table.element(a,'(p-val)', header=TRUE)
for (i in 1:ncols) {
mydum <- '('
mydum <- paste(mydum,round(selection[[2]][j,i],4),sep='')
mydum <- paste(mydum,')')
a<-table.element(a,mydum)
}
a<-table.row.end(a)
}
a<-table.end(a)
table.save(a,file='mytable.tab')
a<-table.start()
a<-table.row.start(a)
a<-table.element(a,'Estimated ARIMA Residuals', 1,TRUE)
a<-table.row.end(a)
a<-table.row.start(a)
a<-table.element(a,'Value', 1,TRUE)
a<-table.row.end(a)
for (i in (par4*par5+par3):length(resid)) {
a<-table.row.start(a)
a<-table.element(a,resid[i])
a<-table.row.end(a)
}
a<-table.end(a)
table.save(a,file='mytable1.tab')