Free Statistics

of Irreproducible Research!

Author's title

Author*The author of this computation has been verified*
R Software Modulerwasp_autocorrelation.wasp
Title produced by software(Partial) Autocorrelation Function
Date of computationMon, 08 Dec 2008 04:27:53 -0700
Cite this page as followsStatistical Computations at FreeStatistics.org, Office for Research Development and Education, URL https://freestatistics.org/blog/index.php?v=date/2008/Dec/08/t1228735807x1btn9r1yjfxy2l.htm/, Retrieved Fri, 17 May 2024 00:10:11 +0000
Statistical Computations at FreeStatistics.org, Office for Research Development and Education, URL https://freestatistics.org/blog/index.php?pk=30385, Retrieved Fri, 17 May 2024 00:10:11 +0000
QR Codes:

Original text written by user:
IsPrivate?No (this computation is public)
User-defined keywords
Estimated Impact224
Family? (F = Feedback message, R = changed R code, M = changed R Module, P = changed Parameters, D = changed Data)
-     [Univariate Data Series] [data set] [2008-12-01 19:54:57] [b98453cac15ba1066b407e146608df68]
F RMP   [(Partial) Autocorrelation Function] [Taak 10 Stap 2 AC...] [2008-12-03 15:23:42] [6fea0e9a9b3b29a63badf2c274e82506]
-    D    [(Partial) Autocorrelation Function] [Taak 10 Stap 2 AC...] [2008-12-04 18:27:40] [819b576fab25b35cfda70f80599828ec]
F   P         [(Partial) Autocorrelation Function] [Taak 10 deel 2 st...] [2008-12-08 11:27:53] [286e96bd53289970f8e5f25a93fb50b3] [Current]
-   P           [(Partial) Autocorrelation Function] [Identification an...] [2008-12-08 19:24:23] [79c17183721a40a589db5f9f561947d8]
-   P           [(Partial) Autocorrelation Function] [Identification an...] [2008-12-08 19:29:28] [79c17183721a40a589db5f9f561947d8]
Feedback Forum
2008-12-14 11:56:24 [Jeroen Michel] [reply
Ook hier zien we een perfect model en met mooie conclusie. Hier zijn zowel trend als seizoenaliteit weg gefilterd en wordt uitgelegd hoe de interpretatie moet gebeuren.
2008-12-14 13:20:33 [Kevin Neelen] [reply
Uiteindelijk heeft de student de volgende gegevens ingevoerd: lags = 36, d = 1, D = 1 en Seasonal period = 12

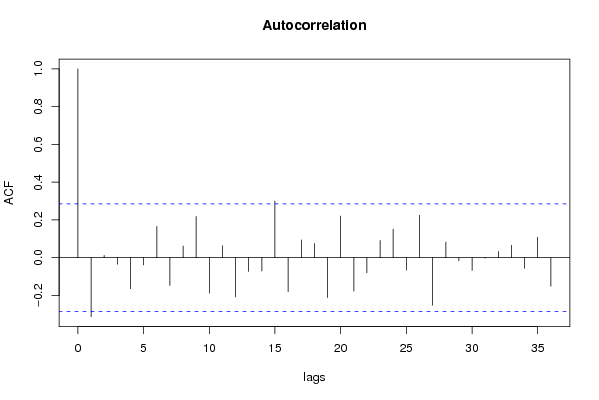
De lange termijntrend is in dit model nu volledig weggewerkt, terwijl er nog wel een beetje sprake is van enige autocorrelatie, waaronder echter geen seizoensinvloeden.

Om de eventueel nog aanwezig resterende autocorrelatie weg te werken, kunnen er ARMA-modellen gebruikt worden.
2008-12-14 13:22:09 [Matthieu Blondeau] [reply
Men moet eerst de berekening uitvoeren met d=0 en D=0 en daarna pas differentiëren zodat men het verschil tussen de berekeningen duidelijk kan zien. De student heeft dit ook correct gedaan.
2008-12-14 13:23:29 [Matthieu Blondeau] [reply
De student heeft de nodige parameters op een correcte manier gevonden.
2008-12-14 13:30:01 [Kevin Neelen] [reply
Voor stap 4 moeten de waarden van p, P, q en Q berekend worden.

De student heeft hiervoor de volgende gegevens ingevoerd: number of time lags = 36, Lambda = 1, d = 1, D = 1 en Seasonal Periods = 12.

p = 0 --> met de nodige goede wil kan gesteld worden dat bij de autocorrelatiegrafiek de eerste 5 à 6 geen specifiek AR-patroon vertonen. Dit betekent dat p = 0.

P = 0 --> we kijken op de grafiek of de tabel van de autocorrelatie (want AR-model) naar de autocorrelatiewaarden van 12, 24, 36. We zien dat geen enkele lag significant verschilt van 0. Dit wil zeggen dat er geen saisonaal patroon aanwezig is, de waarde van P is dus 0.

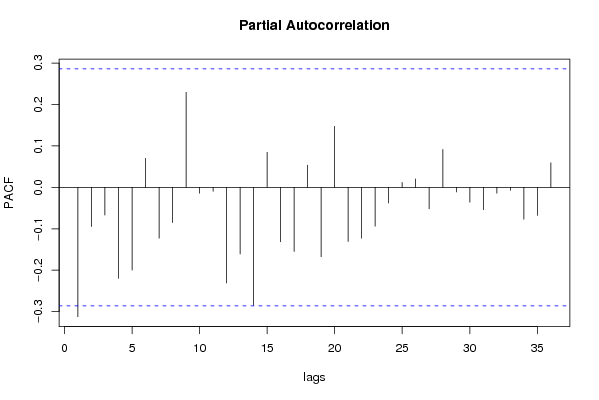
q = 1 --> we zoeken het typische patroon van een MA-model op de grafiek van de partiële autocorrelatie. Het is hier moeilijk na te gaan of we kunnen stellen dat er een typisch patroon terug te vinden is. De eerste 5 waarden zijn negatief en convergeren wel enigszins naar 0, maar er moet toch een fikse kink in de kabel genegeerd worden om dit te kunnen stellen. We gaan met het oog op de Arima backward selection q toch gelijkstellen aan 1 (enkel de 1e partiele autocorrelatiecoefficient is significant), mocht dit foutief zijn wordt dit namelijk aangegeven door een p-waarde die groter zal zijn dan 5%.

Q = 0 --> bij lags 12, 24, 36 zien we geen patroon. Bovendien is geen enkele significant en is Q bijgevolg gelijk aan 0.
2008-12-14 17:02:32 [Mehmet Yilmaz] [reply
De berekening en conclusies zijn correct.
2008-12-15 21:19:16 [Michael Van Spaandonck] [reply
Q2

In het model waarbij d = 0 en D = 0
http://www.freestatistics.org/blog/index.php?v=date/2008/Dec/08/t1228755325k63sweo5iwux45g.htm
zien we dat de autocorrelatiegrafiek langzaam aflopende correlatiewaarden vertoont rond de seizoenslags 12, 24 enz.. Dit duidt dus op een LT-trend en op seizoensinvloeden.

In het model waarbij d = 1 en D = 0
http://www.freestatistics.org/blog/index.php?v=date/2008/Dec/08/t1228755457pf776oobc8z8lbc.htm
zien we een autocorrelatiegrafiek waarbij enkel voor lags 12 en 24 een significant hoge correlatiewaarde geldt. Dit betekent dat er nog seizoensinvloeden zijn.

In het huidige model is de lange termijntrend volledig weggewerkt, terwijl er nog wel sprake is van enige autocorrelatie, waaronder echter geen seizoensinvloeden.
Normaal gesproken zouden we door D te laten variëren moeten nagaan of de seizoensdifferentiatie nog verder doorgedreven moet worden, maar om de resterende autocorrelatie weg te werken kunnen ook de ARMA-modellen gebruikt worden. (Zie stap 4)
2008-12-15 21:25:35 [Nilay Erdogdu] [reply
correct
2008-12-15 21:40:24 [Michael Van Spaandonck] [reply
Q4

Er werd in de vorige stappen bepaald dat de ideale differentiatie voor zowel d als D 1 bedraagt, vandaar dezelfde link als bij het ACF-model waarbij d = 1 en D = 1. De gegevensinvoer is dus de volgende:

Number of time lags = 36
Lambda = 1
d = 1
D = 1
Seasonal Periods = 12
De waarden van p, P, q en Q moeten bepaald worden, om de vergelijking op te stellen en door middel van de ARIMA backward selection-toepassing de waarden van de verschillende Ф te kunnen berekenen. We beginnen met p en P en kijken hiervoor naar de AR-modellen.

Met de nodige goede wil kan gesteld worden dat bij de autocorrelatiegrafiek de eerste 5 à 6 geen sprecifiek AR-patroon vertonen. Dit betekent dat p = 0.

Om de waarde van P te bepalen kijken we op de grafiek of de tabel van de autocorrelatie (want AR-model) naar de autocorrelatiewaarden van 12, 24, 36.
We zien dat geen enkele lag significant verschilt van 0.
Dit wil zeggen dat er geen saisonaal patroon aanwezig is, de waarde van P is dus 0.

Om q en Q te bepalen moeten we het typische patroon van een MA-model op de grafiek van de partiële autocorrelatie zoeken. Wat q betreft is het in dit geval moeilijk na te gaan of we kunnen stellen dat er een typisch patroon terug te vinden is. De eerste 5 waarden zijn negatief en convergeren wel enigzins naar 0, maar er moet toch een fikse kink in de kabel genegeerd worden om dit te kunnen stellen.
We gaan met het oog op de Arima backward selection toch q gelijkstellen aan 1 (enkel de 1e partiële autocorrelatiecoëfficient is significant), mocht dit foutief zijn wordt dit namelijk aangegeven door een p-waarde die groter zal zijn dan 5%.

Bij lags 12, 24, 36 zien we geen patroon. Bovendien is geen enkele significant en is Q bijgevolg gelijk aan 0.

Op basis van deze en vorige stappen kunnen we tot de volgende algemene conclusie komen:

p = 0 λ = 1
P = 0 d = 1
q = 1 D = 1
Q = 0

▼▼12 Yt = (1 – Θ1B12) Et

Post a new message
Dataseries X:
58.972
59.249
63.955
53.785
52.760
44.795
37.348
32.370
32.717
40.974
33.591
21.124
58.608
46.865
51.378
46.235
47.206
45.382
41.227
33.795
31.295
42.625
33.625
21.538
56.421
53.152
53.536
52.408
41.454
38.271
35.306
26.414
31.917
38.030
27.534
18.387
50.556
43.901
48.572
43.899
37.532
40.357
35.489
29.027
34.485
42.598
30.306
26.451
47.460
50.104
61.465
53.726
39.477
43.895
31.481
29.896
33.842
39.120
33.702
25.094


Summary of computational transaction
Raw Inputview raw input (R code)
Raw Outputview raw output of R engine
Computing time2 seconds
R Server'Gwilym Jenkins' @ 72.249.127.135

\begin{tabular}{lllllllll}
\hline
Summary of computational transaction \tabularnewline
Raw Input & view raw input (R code)  \tabularnewline
Raw Output & view raw output of R engine  \tabularnewline
Computing time & 2 seconds \tabularnewline
R Server & 'Gwilym Jenkins' @ 72.249.127.135 \tabularnewline
\hline
\end{tabular}
%Source: https://freestatistics.org/blog/index.php?pk=30385&T=0

[TABLE]
[ROW][C]Summary of computational transaction[/C][/ROW]
[ROW][C]Raw Input[/C][C]view raw input (R code) [/C][/ROW]
[ROW][C]Raw Output[/C][C]view raw output of R engine [/C][/ROW]
[ROW][C]Computing time[/C][C]2 seconds[/C][/ROW]
[ROW][C]R Server[/C][C]'Gwilym Jenkins' @ 72.249.127.135[/C][/ROW]
[/TABLE]
Source: https://freestatistics.org/blog/index.php?pk=30385&T=0

Globally Unique Identifier (entire table): ba.freestatistics.org/blog/index.php?pk=30385&T=0

As an alternative you can also use a QR Code:  

The GUIDs for individual cells are displayed in the table below:

Summary of computational transaction
Raw Inputview raw input (R code)
Raw Outputview raw output of R engine
Computing time2 seconds
R Server'Gwilym Jenkins' @ 72.249.127.135


Autocorrelation Function
Time lag kACF(k)T-STATP-value
1-0.312204-2.14040.018773
20.01190.08160.467664
3-0.034294-0.23510.407573
4-0.164135-1.12530.133097
5-0.037966-0.26030.397891
60.1655731.13510.131042
7-0.146665-1.00550.159906
80.0615820.42220.337408
90.2183541.4970.070545
10-0.187325-1.28420.102677
110.0628970.43120.334146
12-0.207989-1.42590.080253
13-0.073037-0.50070.309454
14-0.070005-0.47990.316752
150.2992932.05190.022889
16-0.179449-1.23020.112365
170.0945010.64790.260111
180.0748850.51340.305042
19-0.211253-1.44830.077089
200.2207141.51310.06847
21-0.176674-1.21120.115934
22-0.079764-0.54680.293539
230.0909470.62350.267985
240.1510271.03540.152893
25-0.065451-0.44870.327852
260.2251561.54360.064697
27-0.251663-1.72530.04552
280.0827780.56750.286538
29-0.015706-0.10770.457355
30-0.067683-0.4640.322392
31-0.002626-0.0180.492856
320.0328790.22540.411319
330.0657530.45080.32711
34-0.056127-0.38480.351065
350.1085920.74450.23015
36-0.150503-1.03180.153724

\begin{tabular}{lllllllll}
\hline
Autocorrelation Function \tabularnewline
Time lag k & ACF(k) & T-STAT & P-value \tabularnewline
1 & -0.312204 & -2.1404 & 0.018773 \tabularnewline
2 & 0.0119 & 0.0816 & 0.467664 \tabularnewline
3 & -0.034294 & -0.2351 & 0.407573 \tabularnewline
4 & -0.164135 & -1.1253 & 0.133097 \tabularnewline
5 & -0.037966 & -0.2603 & 0.397891 \tabularnewline
6 & 0.165573 & 1.1351 & 0.131042 \tabularnewline
7 & -0.146665 & -1.0055 & 0.159906 \tabularnewline
8 & 0.061582 & 0.4222 & 0.337408 \tabularnewline
9 & 0.218354 & 1.497 & 0.070545 \tabularnewline
10 & -0.187325 & -1.2842 & 0.102677 \tabularnewline
11 & 0.062897 & 0.4312 & 0.334146 \tabularnewline
12 & -0.207989 & -1.4259 & 0.080253 \tabularnewline
13 & -0.073037 & -0.5007 & 0.309454 \tabularnewline
14 & -0.070005 & -0.4799 & 0.316752 \tabularnewline
15 & 0.299293 & 2.0519 & 0.022889 \tabularnewline
16 & -0.179449 & -1.2302 & 0.112365 \tabularnewline
17 & 0.094501 & 0.6479 & 0.260111 \tabularnewline
18 & 0.074885 & 0.5134 & 0.305042 \tabularnewline
19 & -0.211253 & -1.4483 & 0.077089 \tabularnewline
20 & 0.220714 & 1.5131 & 0.06847 \tabularnewline
21 & -0.176674 & -1.2112 & 0.115934 \tabularnewline
22 & -0.079764 & -0.5468 & 0.293539 \tabularnewline
23 & 0.090947 & 0.6235 & 0.267985 \tabularnewline
24 & 0.151027 & 1.0354 & 0.152893 \tabularnewline
25 & -0.065451 & -0.4487 & 0.327852 \tabularnewline
26 & 0.225156 & 1.5436 & 0.064697 \tabularnewline
27 & -0.251663 & -1.7253 & 0.04552 \tabularnewline
28 & 0.082778 & 0.5675 & 0.286538 \tabularnewline
29 & -0.015706 & -0.1077 & 0.457355 \tabularnewline
30 & -0.067683 & -0.464 & 0.322392 \tabularnewline
31 & -0.002626 & -0.018 & 0.492856 \tabularnewline
32 & 0.032879 & 0.2254 & 0.411319 \tabularnewline
33 & 0.065753 & 0.4508 & 0.32711 \tabularnewline
34 & -0.056127 & -0.3848 & 0.351065 \tabularnewline
35 & 0.108592 & 0.7445 & 0.23015 \tabularnewline
36 & -0.150503 & -1.0318 & 0.153724 \tabularnewline
\hline
\end{tabular}
%Source: https://freestatistics.org/blog/index.php?pk=30385&T=1

[TABLE]
[ROW][C]Autocorrelation Function[/C][/ROW]
[ROW][C]Time lag k[/C][C]ACF(k)[/C][C]T-STAT[/C][C]P-value[/C][/ROW]
[ROW][C]1[/C][C]-0.312204[/C][C]-2.1404[/C][C]0.018773[/C][/ROW]
[ROW][C]2[/C][C]0.0119[/C][C]0.0816[/C][C]0.467664[/C][/ROW]
[ROW][C]3[/C][C]-0.034294[/C][C]-0.2351[/C][C]0.407573[/C][/ROW]
[ROW][C]4[/C][C]-0.164135[/C][C]-1.1253[/C][C]0.133097[/C][/ROW]
[ROW][C]5[/C][C]-0.037966[/C][C]-0.2603[/C][C]0.397891[/C][/ROW]
[ROW][C]6[/C][C]0.165573[/C][C]1.1351[/C][C]0.131042[/C][/ROW]
[ROW][C]7[/C][C]-0.146665[/C][C]-1.0055[/C][C]0.159906[/C][/ROW]
[ROW][C]8[/C][C]0.061582[/C][C]0.4222[/C][C]0.337408[/C][/ROW]
[ROW][C]9[/C][C]0.218354[/C][C]1.497[/C][C]0.070545[/C][/ROW]
[ROW][C]10[/C][C]-0.187325[/C][C]-1.2842[/C][C]0.102677[/C][/ROW]
[ROW][C]11[/C][C]0.062897[/C][C]0.4312[/C][C]0.334146[/C][/ROW]
[ROW][C]12[/C][C]-0.207989[/C][C]-1.4259[/C][C]0.080253[/C][/ROW]
[ROW][C]13[/C][C]-0.073037[/C][C]-0.5007[/C][C]0.309454[/C][/ROW]
[ROW][C]14[/C][C]-0.070005[/C][C]-0.4799[/C][C]0.316752[/C][/ROW]
[ROW][C]15[/C][C]0.299293[/C][C]2.0519[/C][C]0.022889[/C][/ROW]
[ROW][C]16[/C][C]-0.179449[/C][C]-1.2302[/C][C]0.112365[/C][/ROW]
[ROW][C]17[/C][C]0.094501[/C][C]0.6479[/C][C]0.260111[/C][/ROW]
[ROW][C]18[/C][C]0.074885[/C][C]0.5134[/C][C]0.305042[/C][/ROW]
[ROW][C]19[/C][C]-0.211253[/C][C]-1.4483[/C][C]0.077089[/C][/ROW]
[ROW][C]20[/C][C]0.220714[/C][C]1.5131[/C][C]0.06847[/C][/ROW]
[ROW][C]21[/C][C]-0.176674[/C][C]-1.2112[/C][C]0.115934[/C][/ROW]
[ROW][C]22[/C][C]-0.079764[/C][C]-0.5468[/C][C]0.293539[/C][/ROW]
[ROW][C]23[/C][C]0.090947[/C][C]0.6235[/C][C]0.267985[/C][/ROW]
[ROW][C]24[/C][C]0.151027[/C][C]1.0354[/C][C]0.152893[/C][/ROW]
[ROW][C]25[/C][C]-0.065451[/C][C]-0.4487[/C][C]0.327852[/C][/ROW]
[ROW][C]26[/C][C]0.225156[/C][C]1.5436[/C][C]0.064697[/C][/ROW]
[ROW][C]27[/C][C]-0.251663[/C][C]-1.7253[/C][C]0.04552[/C][/ROW]
[ROW][C]28[/C][C]0.082778[/C][C]0.5675[/C][C]0.286538[/C][/ROW]
[ROW][C]29[/C][C]-0.015706[/C][C]-0.1077[/C][C]0.457355[/C][/ROW]
[ROW][C]30[/C][C]-0.067683[/C][C]-0.464[/C][C]0.322392[/C][/ROW]
[ROW][C]31[/C][C]-0.002626[/C][C]-0.018[/C][C]0.492856[/C][/ROW]
[ROW][C]32[/C][C]0.032879[/C][C]0.2254[/C][C]0.411319[/C][/ROW]
[ROW][C]33[/C][C]0.065753[/C][C]0.4508[/C][C]0.32711[/C][/ROW]
[ROW][C]34[/C][C]-0.056127[/C][C]-0.3848[/C][C]0.351065[/C][/ROW]
[ROW][C]35[/C][C]0.108592[/C][C]0.7445[/C][C]0.23015[/C][/ROW]
[ROW][C]36[/C][C]-0.150503[/C][C]-1.0318[/C][C]0.153724[/C][/ROW]
[/TABLE]
Source: https://freestatistics.org/blog/index.php?pk=30385&T=1

Globally Unique Identifier (entire table): ba.freestatistics.org/blog/index.php?pk=30385&T=1

As an alternative you can also use a QR Code:  

The GUIDs for individual cells are displayed in the table below:

Autocorrelation Function
Time lag kACF(k)T-STATP-value
1-0.312204-2.14040.018773
20.01190.08160.467664
3-0.034294-0.23510.407573
4-0.164135-1.12530.133097
5-0.037966-0.26030.397891
60.1655731.13510.131042
7-0.146665-1.00550.159906
80.0615820.42220.337408
90.2183541.4970.070545
10-0.187325-1.28420.102677
110.0628970.43120.334146
12-0.207989-1.42590.080253
13-0.073037-0.50070.309454
14-0.070005-0.47990.316752
150.2992932.05190.022889
16-0.179449-1.23020.112365
170.0945010.64790.260111
180.0748850.51340.305042
19-0.211253-1.44830.077089
200.2207141.51310.06847
21-0.176674-1.21120.115934
22-0.079764-0.54680.293539
230.0909470.62350.267985
240.1510271.03540.152893
25-0.065451-0.44870.327852
260.2251561.54360.064697
27-0.251663-1.72530.04552
280.0827780.56750.286538
29-0.015706-0.10770.457355
30-0.067683-0.4640.322392
31-0.002626-0.0180.492856
320.0328790.22540.411319
330.0657530.45080.32711
34-0.056127-0.38480.351065
350.1085920.74450.23015
36-0.150503-1.03180.153724


Partial Autocorrelation Function
Time lag kPACF(k)T-STATP-value
1-0.312204-2.14040.018773
2-0.094813-0.650.259426
3-0.06689-0.45860.324326
4-0.219626-1.50570.069421
5-0.199778-1.36960.088658
60.0701520.48090.316395
7-0.122674-0.8410.2023
8-0.085014-0.58280.281399
90.2296141.57420.06108
10-0.01397-0.09580.462054
11-0.009452-0.06480.474303
12-0.230776-1.58210.060165
13-0.16079-1.10230.137968
14-0.28496-1.95360.028358
150.0845050.57930.282565
16-0.131608-0.90230.18576
17-0.154609-1.05990.147293
180.0533820.3660.358016
19-0.167531-1.14850.12828
200.147371.01030.158758
21-0.130585-0.89520.187608
22-0.122624-0.84070.202395
23-0.093833-0.64330.261583
24-0.037777-0.2590.398387
250.0120130.08240.467356
260.02030.13920.444955
27-0.051852-0.35550.361909
280.0915110.62740.266726
29-0.011081-0.0760.469883
30-0.035828-0.24560.403522
31-0.053891-0.36950.356723
32-0.01404-0.09630.461865
33-0.007285-0.04990.480189
34-0.076727-0.5260.300675
35-0.067821-0.4650.322055
360.0593160.40670.343055

\begin{tabular}{lllllllll}
\hline
Partial Autocorrelation Function \tabularnewline
Time lag k & PACF(k) & T-STAT & P-value \tabularnewline
1 & -0.312204 & -2.1404 & 0.018773 \tabularnewline
2 & -0.094813 & -0.65 & 0.259426 \tabularnewline
3 & -0.06689 & -0.4586 & 0.324326 \tabularnewline
4 & -0.219626 & -1.5057 & 0.069421 \tabularnewline
5 & -0.199778 & -1.3696 & 0.088658 \tabularnewline
6 & 0.070152 & 0.4809 & 0.316395 \tabularnewline
7 & -0.122674 & -0.841 & 0.2023 \tabularnewline
8 & -0.085014 & -0.5828 & 0.281399 \tabularnewline
9 & 0.229614 & 1.5742 & 0.06108 \tabularnewline
10 & -0.01397 & -0.0958 & 0.462054 \tabularnewline
11 & -0.009452 & -0.0648 & 0.474303 \tabularnewline
12 & -0.230776 & -1.5821 & 0.060165 \tabularnewline
13 & -0.16079 & -1.1023 & 0.137968 \tabularnewline
14 & -0.28496 & -1.9536 & 0.028358 \tabularnewline
15 & 0.084505 & 0.5793 & 0.282565 \tabularnewline
16 & -0.131608 & -0.9023 & 0.18576 \tabularnewline
17 & -0.154609 & -1.0599 & 0.147293 \tabularnewline
18 & 0.053382 & 0.366 & 0.358016 \tabularnewline
19 & -0.167531 & -1.1485 & 0.12828 \tabularnewline
20 & 0.14737 & 1.0103 & 0.158758 \tabularnewline
21 & -0.130585 & -0.8952 & 0.187608 \tabularnewline
22 & -0.122624 & -0.8407 & 0.202395 \tabularnewline
23 & -0.093833 & -0.6433 & 0.261583 \tabularnewline
24 & -0.037777 & -0.259 & 0.398387 \tabularnewline
25 & 0.012013 & 0.0824 & 0.467356 \tabularnewline
26 & 0.0203 & 0.1392 & 0.444955 \tabularnewline
27 & -0.051852 & -0.3555 & 0.361909 \tabularnewline
28 & 0.091511 & 0.6274 & 0.266726 \tabularnewline
29 & -0.011081 & -0.076 & 0.469883 \tabularnewline
30 & -0.035828 & -0.2456 & 0.403522 \tabularnewline
31 & -0.053891 & -0.3695 & 0.356723 \tabularnewline
32 & -0.01404 & -0.0963 & 0.461865 \tabularnewline
33 & -0.007285 & -0.0499 & 0.480189 \tabularnewline
34 & -0.076727 & -0.526 & 0.300675 \tabularnewline
35 & -0.067821 & -0.465 & 0.322055 \tabularnewline
36 & 0.059316 & 0.4067 & 0.343055 \tabularnewline
\hline
\end{tabular}
%Source: https://freestatistics.org/blog/index.php?pk=30385&T=2

[TABLE]
[ROW][C]Partial Autocorrelation Function[/C][/ROW]
[ROW][C]Time lag k[/C][C]PACF(k)[/C][C]T-STAT[/C][C]P-value[/C][/ROW]
[ROW][C]1[/C][C]-0.312204[/C][C]-2.1404[/C][C]0.018773[/C][/ROW]
[ROW][C]2[/C][C]-0.094813[/C][C]-0.65[/C][C]0.259426[/C][/ROW]
[ROW][C]3[/C][C]-0.06689[/C][C]-0.4586[/C][C]0.324326[/C][/ROW]
[ROW][C]4[/C][C]-0.219626[/C][C]-1.5057[/C][C]0.069421[/C][/ROW]
[ROW][C]5[/C][C]-0.199778[/C][C]-1.3696[/C][C]0.088658[/C][/ROW]
[ROW][C]6[/C][C]0.070152[/C][C]0.4809[/C][C]0.316395[/C][/ROW]
[ROW][C]7[/C][C]-0.122674[/C][C]-0.841[/C][C]0.2023[/C][/ROW]
[ROW][C]8[/C][C]-0.085014[/C][C]-0.5828[/C][C]0.281399[/C][/ROW]
[ROW][C]9[/C][C]0.229614[/C][C]1.5742[/C][C]0.06108[/C][/ROW]
[ROW][C]10[/C][C]-0.01397[/C][C]-0.0958[/C][C]0.462054[/C][/ROW]
[ROW][C]11[/C][C]-0.009452[/C][C]-0.0648[/C][C]0.474303[/C][/ROW]
[ROW][C]12[/C][C]-0.230776[/C][C]-1.5821[/C][C]0.060165[/C][/ROW]
[ROW][C]13[/C][C]-0.16079[/C][C]-1.1023[/C][C]0.137968[/C][/ROW]
[ROW][C]14[/C][C]-0.28496[/C][C]-1.9536[/C][C]0.028358[/C][/ROW]
[ROW][C]15[/C][C]0.084505[/C][C]0.5793[/C][C]0.282565[/C][/ROW]
[ROW][C]16[/C][C]-0.131608[/C][C]-0.9023[/C][C]0.18576[/C][/ROW]
[ROW][C]17[/C][C]-0.154609[/C][C]-1.0599[/C][C]0.147293[/C][/ROW]
[ROW][C]18[/C][C]0.053382[/C][C]0.366[/C][C]0.358016[/C][/ROW]
[ROW][C]19[/C][C]-0.167531[/C][C]-1.1485[/C][C]0.12828[/C][/ROW]
[ROW][C]20[/C][C]0.14737[/C][C]1.0103[/C][C]0.158758[/C][/ROW]
[ROW][C]21[/C][C]-0.130585[/C][C]-0.8952[/C][C]0.187608[/C][/ROW]
[ROW][C]22[/C][C]-0.122624[/C][C]-0.8407[/C][C]0.202395[/C][/ROW]
[ROW][C]23[/C][C]-0.093833[/C][C]-0.6433[/C][C]0.261583[/C][/ROW]
[ROW][C]24[/C][C]-0.037777[/C][C]-0.259[/C][C]0.398387[/C][/ROW]
[ROW][C]25[/C][C]0.012013[/C][C]0.0824[/C][C]0.467356[/C][/ROW]
[ROW][C]26[/C][C]0.0203[/C][C]0.1392[/C][C]0.444955[/C][/ROW]
[ROW][C]27[/C][C]-0.051852[/C][C]-0.3555[/C][C]0.361909[/C][/ROW]
[ROW][C]28[/C][C]0.091511[/C][C]0.6274[/C][C]0.266726[/C][/ROW]
[ROW][C]29[/C][C]-0.011081[/C][C]-0.076[/C][C]0.469883[/C][/ROW]
[ROW][C]30[/C][C]-0.035828[/C][C]-0.2456[/C][C]0.403522[/C][/ROW]
[ROW][C]31[/C][C]-0.053891[/C][C]-0.3695[/C][C]0.356723[/C][/ROW]
[ROW][C]32[/C][C]-0.01404[/C][C]-0.0963[/C][C]0.461865[/C][/ROW]
[ROW][C]33[/C][C]-0.007285[/C][C]-0.0499[/C][C]0.480189[/C][/ROW]
[ROW][C]34[/C][C]-0.076727[/C][C]-0.526[/C][C]0.300675[/C][/ROW]
[ROW][C]35[/C][C]-0.067821[/C][C]-0.465[/C][C]0.322055[/C][/ROW]
[ROW][C]36[/C][C]0.059316[/C][C]0.4067[/C][C]0.343055[/C][/ROW]
[/TABLE]
Source: https://freestatistics.org/blog/index.php?pk=30385&T=2

Globally Unique Identifier (entire table): ba.freestatistics.org/blog/index.php?pk=30385&T=2

As an alternative you can also use a QR Code:  

The GUIDs for individual cells are displayed in the table below:

Partial Autocorrelation Function
Time lag kPACF(k)T-STATP-value
1-0.312204-2.14040.018773
2-0.094813-0.650.259426
3-0.06689-0.45860.324326
4-0.219626-1.50570.069421
5-0.199778-1.36960.088658
60.0701520.48090.316395
7-0.122674-0.8410.2023
8-0.085014-0.58280.281399
90.2296141.57420.06108
10-0.01397-0.09580.462054
11-0.009452-0.06480.474303
12-0.230776-1.58210.060165
13-0.16079-1.10230.137968
14-0.28496-1.95360.028358
150.0845050.57930.282565
16-0.131608-0.90230.18576
17-0.154609-1.05990.147293
180.0533820.3660.358016
19-0.167531-1.14850.12828
200.147371.01030.158758
21-0.130585-0.89520.187608
22-0.122624-0.84070.202395
23-0.093833-0.64330.261583
24-0.037777-0.2590.398387
250.0120130.08240.467356
260.02030.13920.444955
27-0.051852-0.35550.361909
280.0915110.62740.266726
29-0.011081-0.0760.469883
30-0.035828-0.24560.403522
31-0.053891-0.36950.356723
32-0.01404-0.09630.461865
33-0.007285-0.04990.480189
34-0.076727-0.5260.300675
35-0.067821-0.4650.322055
360.0593160.40670.343055


Parameters (Session):
par1 = 36 ; par2 = 1 ; par3 = 1 ; par4 = 1 ; par5 = 12 ;
Parameters (R input):
par1 = 36 ; par2 = 1 ; par3 = 1 ; par4 = 1 ; par5 = 12 ;
R code (references can be found in the software module):
if (par1 == 'Default') {
par1 = 10*log10(length(x))
} else {
par1 <- as.numeric(par1)
}
par2 <- as.numeric(par2)
par3 <- as.numeric(par3)
par4 <- as.numeric(par4)
par5 <- as.numeric(par5)
if (par2 == 0) {
x <- log(x)
} else {
x <- (x ^ par2 - 1) / par2
}
if (par3 > 0) x <- diff(x,lag=1,difference=par3)
if (par4 > 0) x <- diff(x,lag=par5,difference=par4)
bitmap(file='pic1.png')
racf <- acf(x,par1,main='Autocorrelation',xlab='lags',ylab='ACF')
dev.off()
bitmap(file='pic2.png')
rpacf <- pacf(x,par1,main='Partial Autocorrelation',xlab='lags',ylab='PACF')
dev.off()
(myacf <- c(racf$acf))
(mypacf <- c(rpacf$acf))
lengthx <- length(x)
sqrtn <- sqrt(lengthx)
load(file='createtable')
a<-table.start()
a<-table.row.start(a)
a<-table.element(a,'Autocorrelation Function',4,TRUE)
a<-table.row.end(a)
a<-table.row.start(a)
a<-table.element(a,'Time lag k',header=TRUE)
a<-table.element(a,hyperlink('basics.htm','ACF(k)','click here for more information about the Autocorrelation Function'),header=TRUE)
a<-table.element(a,'T-STAT',header=TRUE)
a<-table.element(a,'P-value',header=TRUE)
a<-table.row.end(a)
for (i in 2:(par1+1)) {
a<-table.row.start(a)
a<-table.element(a,i-1,header=TRUE)
a<-table.element(a,round(myacf[i],6))
mytstat <- myacf[i]*sqrtn
a<-table.element(a,round(mytstat,4))
a<-table.element(a,round(1-pt(abs(mytstat),lengthx),6))
a<-table.row.end(a)
}
a<-table.end(a)
table.save(a,file='mytable.tab')
a<-table.start()
a<-table.row.start(a)
a<-table.element(a,'Partial Autocorrelation Function',4,TRUE)
a<-table.row.end(a)
a<-table.row.start(a)
a<-table.element(a,'Time lag k',header=TRUE)
a<-table.element(a,hyperlink('basics.htm','PACF(k)','click here for more information about the Partial Autocorrelation Function'),header=TRUE)
a<-table.element(a,'T-STAT',header=TRUE)
a<-table.element(a,'P-value',header=TRUE)
a<-table.row.end(a)
for (i in 1:par1) {
a<-table.row.start(a)
a<-table.element(a,i,header=TRUE)
a<-table.element(a,round(mypacf[i],6))
mytstat <- mypacf[i]*sqrtn
a<-table.element(a,round(mytstat,4))
a<-table.element(a,round(1-pt(abs(mytstat),lengthx),6))
a<-table.row.end(a)
}
a<-table.end(a)
table.save(a,file='mytable1.tab')