Free Statistics

of Irreproducible Research!

Author's title

Author*The author of this computation has been verified*
R Software Modulerwasp_autocorrelation.wasp
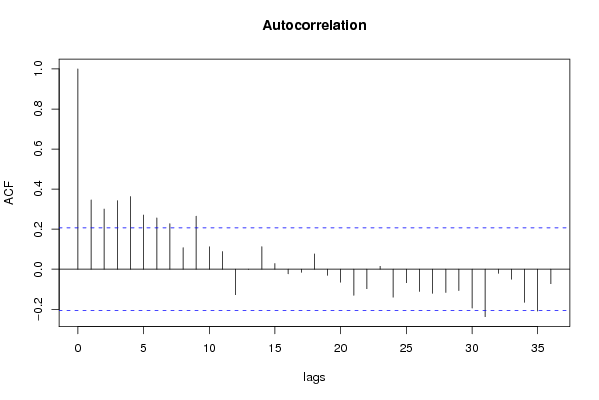
Title produced by software(Partial) Autocorrelation Function
Date of computationSun, 07 Dec 2008 16:16:53 -0700
Cite this page as followsStatistical Computations at FreeStatistics.org, Office for Research Development and Education, URL https://freestatistics.org/blog/index.php?v=date/2008/Dec/08/t1228691858y5rycn0lmkmu9ns.htm/, Retrieved Thu, 16 May 2024 14:07:44 +0000
Statistical Computations at FreeStatistics.org, Office for Research Development and Education, URL https://freestatistics.org/blog/index.php?pk=30340, Retrieved Thu, 16 May 2024 14:07:44 +0000
QR Codes:

Original text written by user:
IsPrivate?No (this computation is public)
User-defined keywords
Estimated Impact209
Family? (F = Feedback message, R = changed R code, M = changed R Module, P = changed Parameters, D = changed Data)
F     [Standard Deviation-Mean Plot] [step 1] [2008-12-06 12:33:55] [c45c87b96bbf32ffc2144fc37d767b2e]
- RMP   [(Partial) Autocorrelation Function] [acf] [2008-12-07 20:04:18] [c45c87b96bbf32ffc2144fc37d767b2e]
-   P     [(Partial) Autocorrelation Function] [acf] [2008-12-07 20:21:09] [c45c87b96bbf32ffc2144fc37d767b2e]
F   P         [(Partial) Autocorrelation Function] [acf] [2008-12-07 23:16:53] [3dc594a6c62226e1e98766c4d385bfaa] [Current]
Feedback Forum
2008-12-14 20:58:40 [Michaël De Kuyer] [reply
Dit is correct.
2008-12-15 20:11:46 [8e2cc0b2ef568da46d009b2f601285b2] [reply
De acf is correct besproken, hoewel een foutieve lambda waarde is gebruikt doordat de student een foutieve waarde had gevonden in vraag 1. Toch is de resulterende grafiek correct besproken en beoordeeld. Deze reeks is stationair en zoals de student reeds vermoed zijn er arima processen aanwezig.
2008-12-15 20:19:41 [8e2cc0b2ef568da46d009b2f601285b2] [reply
De student heeft correct naar de ARIMA patterns gezocht en goed besproken/toegelicht hoe deze gevonden kunnen worden. Enkel bij de SMA blijkt de student geen process te vinden terwijl er volgens mij toch 1 aanwezig is.

Post a new message
Dataseries X:
3595
3914
4159
3676
3794
3446
3504
3958
3353
3480
3098
2944
3389
3497
4404
3849
3734
3060
3507
3287
3215
3764
2734
2837
2766
3851
3289
3848
3348
3682
4058
3655
3811
3341
3032
3475
3353
3186
3902
4164
3499
4145
3796
3711
3949
3740
3243
4407
4814
3908
5250
3937
4004
5560
3922
3759
4138
4634
3996
4308
4142
4429
5219
4929
5754
5592
4163
4962
5208
4755
4491
5732
5730
5024
6056
4901
5353
5578
4618
4724
5011
5298
4143
4617
4736
4214
5112
4197
4119
5104
4194
4583
3790
5557
4304
3838
4277
4951
4479
4677
4274
4782


Summary of computational transaction
Raw Inputview raw input (R code)
Raw Outputview raw output of R engine
Computing time1 seconds
R Server'Gwilym Jenkins' @ 72.249.127.135

\begin{tabular}{lllllllll}
\hline
Summary of computational transaction \tabularnewline
Raw Input & view raw input (R code)  \tabularnewline
Raw Output & view raw output of R engine  \tabularnewline
Computing time & 1 seconds \tabularnewline
R Server & 'Gwilym Jenkins' @ 72.249.127.135 \tabularnewline
\hline
\end{tabular}
%Source: https://freestatistics.org/blog/index.php?pk=30340&T=0

[TABLE]
[ROW][C]Summary of computational transaction[/C][/ROW]
[ROW][C]Raw Input[/C][C]view raw input (R code) [/C][/ROW]
[ROW][C]Raw Output[/C][C]view raw output of R engine [/C][/ROW]
[ROW][C]Computing time[/C][C]1 seconds[/C][/ROW]
[ROW][C]R Server[/C][C]'Gwilym Jenkins' @ 72.249.127.135[/C][/ROW]
[/TABLE]
Source: https://freestatistics.org/blog/index.php?pk=30340&T=0

Globally Unique Identifier (entire table): ba.freestatistics.org/blog/index.php?pk=30340&T=0

As an alternative you can also use a QR Code:  

The GUIDs for individual cells are displayed in the table below:

Summary of computational transaction
Raw Inputview raw input (R code)
Raw Outputview raw output of R engine
Computing time1 seconds
R Server'Gwilym Jenkins' @ 72.249.127.135


Autocorrelation Function
Time lag kACF(k)T-STATP-value
10.3459243.28170.000735
20.3002152.84810.002725
30.3420833.24530.000824
40.3629993.44370.000437
50.2701532.56290.00602
60.2563362.43180.008502
70.2276272.15950.016737
80.1073271.01820.155658
90.2649752.51380.006861
100.1122581.0650.144869
110.0882820.83750.202262
12-0.127132-1.20610.115474
13-0.000562-0.00530.49788
140.1125571.06780.144231
150.0280510.26610.395378
16-0.022839-0.21670.414479
17-0.015104-0.14330.44319
180.076630.7270.234564
19-0.030163-0.28610.387712
20-0.064469-0.61160.271168
21-0.130208-1.23530.109973
22-0.097459-0.92460.17883
230.0148440.14080.444161
24-0.139545-1.32380.094454
25-0.067211-0.63760.262671
26-0.110706-1.05030.148207
27-0.120123-1.13960.128742
28-0.115858-1.09910.137321
29-0.106312-1.00860.157944
30-0.194151-1.84190.034393
31-0.23677-2.24620.013569
32-0.020224-0.19190.424142
33-0.049447-0.46910.320069
34-0.165246-1.56770.060235
35-0.208971-1.98250.025238
36-0.072314-0.6860.247229

\begin{tabular}{lllllllll}
\hline
Autocorrelation Function \tabularnewline
Time lag k & ACF(k) & T-STAT & P-value \tabularnewline
1 & 0.345924 & 3.2817 & 0.000735 \tabularnewline
2 & 0.300215 & 2.8481 & 0.002725 \tabularnewline
3 & 0.342083 & 3.2453 & 0.000824 \tabularnewline
4 & 0.362999 & 3.4437 & 0.000437 \tabularnewline
5 & 0.270153 & 2.5629 & 0.00602 \tabularnewline
6 & 0.256336 & 2.4318 & 0.008502 \tabularnewline
7 & 0.227627 & 2.1595 & 0.016737 \tabularnewline
8 & 0.107327 & 1.0182 & 0.155658 \tabularnewline
9 & 0.264975 & 2.5138 & 0.006861 \tabularnewline
10 & 0.112258 & 1.065 & 0.144869 \tabularnewline
11 & 0.088282 & 0.8375 & 0.202262 \tabularnewline
12 & -0.127132 & -1.2061 & 0.115474 \tabularnewline
13 & -0.000562 & -0.0053 & 0.49788 \tabularnewline
14 & 0.112557 & 1.0678 & 0.144231 \tabularnewline
15 & 0.028051 & 0.2661 & 0.395378 \tabularnewline
16 & -0.022839 & -0.2167 & 0.414479 \tabularnewline
17 & -0.015104 & -0.1433 & 0.44319 \tabularnewline
18 & 0.07663 & 0.727 & 0.234564 \tabularnewline
19 & -0.030163 & -0.2861 & 0.387712 \tabularnewline
20 & -0.064469 & -0.6116 & 0.271168 \tabularnewline
21 & -0.130208 & -1.2353 & 0.109973 \tabularnewline
22 & -0.097459 & -0.9246 & 0.17883 \tabularnewline
23 & 0.014844 & 0.1408 & 0.444161 \tabularnewline
24 & -0.139545 & -1.3238 & 0.094454 \tabularnewline
25 & -0.067211 & -0.6376 & 0.262671 \tabularnewline
26 & -0.110706 & -1.0503 & 0.148207 \tabularnewline
27 & -0.120123 & -1.1396 & 0.128742 \tabularnewline
28 & -0.115858 & -1.0991 & 0.137321 \tabularnewline
29 & -0.106312 & -1.0086 & 0.157944 \tabularnewline
30 & -0.194151 & -1.8419 & 0.034393 \tabularnewline
31 & -0.23677 & -2.2462 & 0.013569 \tabularnewline
32 & -0.020224 & -0.1919 & 0.424142 \tabularnewline
33 & -0.049447 & -0.4691 & 0.320069 \tabularnewline
34 & -0.165246 & -1.5677 & 0.060235 \tabularnewline
35 & -0.208971 & -1.9825 & 0.025238 \tabularnewline
36 & -0.072314 & -0.686 & 0.247229 \tabularnewline
\hline
\end{tabular}
%Source: https://freestatistics.org/blog/index.php?pk=30340&T=1

[TABLE]
[ROW][C]Autocorrelation Function[/C][/ROW]
[ROW][C]Time lag k[/C][C]ACF(k)[/C][C]T-STAT[/C][C]P-value[/C][/ROW]
[ROW][C]1[/C][C]0.345924[/C][C]3.2817[/C][C]0.000735[/C][/ROW]
[ROW][C]2[/C][C]0.300215[/C][C]2.8481[/C][C]0.002725[/C][/ROW]
[ROW][C]3[/C][C]0.342083[/C][C]3.2453[/C][C]0.000824[/C][/ROW]
[ROW][C]4[/C][C]0.362999[/C][C]3.4437[/C][C]0.000437[/C][/ROW]
[ROW][C]5[/C][C]0.270153[/C][C]2.5629[/C][C]0.00602[/C][/ROW]
[ROW][C]6[/C][C]0.256336[/C][C]2.4318[/C][C]0.008502[/C][/ROW]
[ROW][C]7[/C][C]0.227627[/C][C]2.1595[/C][C]0.016737[/C][/ROW]
[ROW][C]8[/C][C]0.107327[/C][C]1.0182[/C][C]0.155658[/C][/ROW]
[ROW][C]9[/C][C]0.264975[/C][C]2.5138[/C][C]0.006861[/C][/ROW]
[ROW][C]10[/C][C]0.112258[/C][C]1.065[/C][C]0.144869[/C][/ROW]
[ROW][C]11[/C][C]0.088282[/C][C]0.8375[/C][C]0.202262[/C][/ROW]
[ROW][C]12[/C][C]-0.127132[/C][C]-1.2061[/C][C]0.115474[/C][/ROW]
[ROW][C]13[/C][C]-0.000562[/C][C]-0.0053[/C][C]0.49788[/C][/ROW]
[ROW][C]14[/C][C]0.112557[/C][C]1.0678[/C][C]0.144231[/C][/ROW]
[ROW][C]15[/C][C]0.028051[/C][C]0.2661[/C][C]0.395378[/C][/ROW]
[ROW][C]16[/C][C]-0.022839[/C][C]-0.2167[/C][C]0.414479[/C][/ROW]
[ROW][C]17[/C][C]-0.015104[/C][C]-0.1433[/C][C]0.44319[/C][/ROW]
[ROW][C]18[/C][C]0.07663[/C][C]0.727[/C][C]0.234564[/C][/ROW]
[ROW][C]19[/C][C]-0.030163[/C][C]-0.2861[/C][C]0.387712[/C][/ROW]
[ROW][C]20[/C][C]-0.064469[/C][C]-0.6116[/C][C]0.271168[/C][/ROW]
[ROW][C]21[/C][C]-0.130208[/C][C]-1.2353[/C][C]0.109973[/C][/ROW]
[ROW][C]22[/C][C]-0.097459[/C][C]-0.9246[/C][C]0.17883[/C][/ROW]
[ROW][C]23[/C][C]0.014844[/C][C]0.1408[/C][C]0.444161[/C][/ROW]
[ROW][C]24[/C][C]-0.139545[/C][C]-1.3238[/C][C]0.094454[/C][/ROW]
[ROW][C]25[/C][C]-0.067211[/C][C]-0.6376[/C][C]0.262671[/C][/ROW]
[ROW][C]26[/C][C]-0.110706[/C][C]-1.0503[/C][C]0.148207[/C][/ROW]
[ROW][C]27[/C][C]-0.120123[/C][C]-1.1396[/C][C]0.128742[/C][/ROW]
[ROW][C]28[/C][C]-0.115858[/C][C]-1.0991[/C][C]0.137321[/C][/ROW]
[ROW][C]29[/C][C]-0.106312[/C][C]-1.0086[/C][C]0.157944[/C][/ROW]
[ROW][C]30[/C][C]-0.194151[/C][C]-1.8419[/C][C]0.034393[/C][/ROW]
[ROW][C]31[/C][C]-0.23677[/C][C]-2.2462[/C][C]0.013569[/C][/ROW]
[ROW][C]32[/C][C]-0.020224[/C][C]-0.1919[/C][C]0.424142[/C][/ROW]
[ROW][C]33[/C][C]-0.049447[/C][C]-0.4691[/C][C]0.320069[/C][/ROW]
[ROW][C]34[/C][C]-0.165246[/C][C]-1.5677[/C][C]0.060235[/C][/ROW]
[ROW][C]35[/C][C]-0.208971[/C][C]-1.9825[/C][C]0.025238[/C][/ROW]
[ROW][C]36[/C][C]-0.072314[/C][C]-0.686[/C][C]0.247229[/C][/ROW]
[/TABLE]
Source: https://freestatistics.org/blog/index.php?pk=30340&T=1

Globally Unique Identifier (entire table): ba.freestatistics.org/blog/index.php?pk=30340&T=1

As an alternative you can also use a QR Code:  

The GUIDs for individual cells are displayed in the table below:

Autocorrelation Function
Time lag kACF(k)T-STATP-value
10.3459243.28170.000735
20.3002152.84810.002725
30.3420833.24530.000824
40.3629993.44370.000437
50.2701532.56290.00602
60.2563362.43180.008502
70.2276272.15950.016737
80.1073271.01820.155658
90.2649752.51380.006861
100.1122581.0650.144869
110.0882820.83750.202262
12-0.127132-1.20610.115474
13-0.000562-0.00530.49788
140.1125571.06780.144231
150.0280510.26610.395378
16-0.022839-0.21670.414479
17-0.015104-0.14330.44319
180.076630.7270.234564
19-0.030163-0.28610.387712
20-0.064469-0.61160.271168
21-0.130208-1.23530.109973
22-0.097459-0.92460.17883
230.0148440.14080.444161
24-0.139545-1.32380.094454
25-0.067211-0.63760.262671
26-0.110706-1.05030.148207
27-0.120123-1.13960.128742
28-0.115858-1.09910.137321
29-0.106312-1.00860.157944
30-0.194151-1.84190.034393
31-0.23677-2.24620.013569
32-0.020224-0.19190.424142
33-0.049447-0.46910.320069
34-0.165246-1.56770.060235
35-0.208971-1.98250.025238
36-0.072314-0.6860.247229


Partial Autocorrelation Function
Time lag kPACF(k)T-STATP-value
10.3459243.28170.000735
20.2050941.94570.027406
30.2236242.12150.018315
40.2049031.94390.027517
50.0529490.50230.308336
60.0475760.45130.326415
70.0056430.05350.478713
8-0.129797-1.23140.110697
90.1541921.46280.073504
10-0.093048-0.88270.189868
11-0.031251-0.29650.383777
12-0.303639-2.88060.002481
13-0.035211-0.3340.369562
140.1838581.74420.042267
150.0644740.61170.271154
160.0284040.26950.394094
170.0145780.13830.445157
180.0658610.62480.266836
19-0.030303-0.28750.387202
20-0.167805-1.59190.057453
21-0.094361-0.89520.186538
22-0.062021-0.58840.278874
230.104270.98920.162611
24-0.22031-2.090.019717
250.0396780.37640.353747
260.0796860.7560.225822
27-0.011299-0.10720.457436
280.0010380.00990.496081
29-0.030259-0.28710.387364
30-0.008864-0.08410.466586
31-0.127537-1.20990.114739
320.0184510.1750.430722
330.1129021.07110.143499
34-0.134805-1.27890.102115
35-0.053044-0.50320.308019
36-0.02639-0.25040.401442

\begin{tabular}{lllllllll}
\hline
Partial Autocorrelation Function \tabularnewline
Time lag k & PACF(k) & T-STAT & P-value \tabularnewline
1 & 0.345924 & 3.2817 & 0.000735 \tabularnewline
2 & 0.205094 & 1.9457 & 0.027406 \tabularnewline
3 & 0.223624 & 2.1215 & 0.018315 \tabularnewline
4 & 0.204903 & 1.9439 & 0.027517 \tabularnewline
5 & 0.052949 & 0.5023 & 0.308336 \tabularnewline
6 & 0.047576 & 0.4513 & 0.326415 \tabularnewline
7 & 0.005643 & 0.0535 & 0.478713 \tabularnewline
8 & -0.129797 & -1.2314 & 0.110697 \tabularnewline
9 & 0.154192 & 1.4628 & 0.073504 \tabularnewline
10 & -0.093048 & -0.8827 & 0.189868 \tabularnewline
11 & -0.031251 & -0.2965 & 0.383777 \tabularnewline
12 & -0.303639 & -2.8806 & 0.002481 \tabularnewline
13 & -0.035211 & -0.334 & 0.369562 \tabularnewline
14 & 0.183858 & 1.7442 & 0.042267 \tabularnewline
15 & 0.064474 & 0.6117 & 0.271154 \tabularnewline
16 & 0.028404 & 0.2695 & 0.394094 \tabularnewline
17 & 0.014578 & 0.1383 & 0.445157 \tabularnewline
18 & 0.065861 & 0.6248 & 0.266836 \tabularnewline
19 & -0.030303 & -0.2875 & 0.387202 \tabularnewline
20 & -0.167805 & -1.5919 & 0.057453 \tabularnewline
21 & -0.094361 & -0.8952 & 0.186538 \tabularnewline
22 & -0.062021 & -0.5884 & 0.278874 \tabularnewline
23 & 0.10427 & 0.9892 & 0.162611 \tabularnewline
24 & -0.22031 & -2.09 & 0.019717 \tabularnewline
25 & 0.039678 & 0.3764 & 0.353747 \tabularnewline
26 & 0.079686 & 0.756 & 0.225822 \tabularnewline
27 & -0.011299 & -0.1072 & 0.457436 \tabularnewline
28 & 0.001038 & 0.0099 & 0.496081 \tabularnewline
29 & -0.030259 & -0.2871 & 0.387364 \tabularnewline
30 & -0.008864 & -0.0841 & 0.466586 \tabularnewline
31 & -0.127537 & -1.2099 & 0.114739 \tabularnewline
32 & 0.018451 & 0.175 & 0.430722 \tabularnewline
33 & 0.112902 & 1.0711 & 0.143499 \tabularnewline
34 & -0.134805 & -1.2789 & 0.102115 \tabularnewline
35 & -0.053044 & -0.5032 & 0.308019 \tabularnewline
36 & -0.02639 & -0.2504 & 0.401442 \tabularnewline
\hline
\end{tabular}
%Source: https://freestatistics.org/blog/index.php?pk=30340&T=2

[TABLE]
[ROW][C]Partial Autocorrelation Function[/C][/ROW]
[ROW][C]Time lag k[/C][C]PACF(k)[/C][C]T-STAT[/C][C]P-value[/C][/ROW]
[ROW][C]1[/C][C]0.345924[/C][C]3.2817[/C][C]0.000735[/C][/ROW]
[ROW][C]2[/C][C]0.205094[/C][C]1.9457[/C][C]0.027406[/C][/ROW]
[ROW][C]3[/C][C]0.223624[/C][C]2.1215[/C][C]0.018315[/C][/ROW]
[ROW][C]4[/C][C]0.204903[/C][C]1.9439[/C][C]0.027517[/C][/ROW]
[ROW][C]5[/C][C]0.052949[/C][C]0.5023[/C][C]0.308336[/C][/ROW]
[ROW][C]6[/C][C]0.047576[/C][C]0.4513[/C][C]0.326415[/C][/ROW]
[ROW][C]7[/C][C]0.005643[/C][C]0.0535[/C][C]0.478713[/C][/ROW]
[ROW][C]8[/C][C]-0.129797[/C][C]-1.2314[/C][C]0.110697[/C][/ROW]
[ROW][C]9[/C][C]0.154192[/C][C]1.4628[/C][C]0.073504[/C][/ROW]
[ROW][C]10[/C][C]-0.093048[/C][C]-0.8827[/C][C]0.189868[/C][/ROW]
[ROW][C]11[/C][C]-0.031251[/C][C]-0.2965[/C][C]0.383777[/C][/ROW]
[ROW][C]12[/C][C]-0.303639[/C][C]-2.8806[/C][C]0.002481[/C][/ROW]
[ROW][C]13[/C][C]-0.035211[/C][C]-0.334[/C][C]0.369562[/C][/ROW]
[ROW][C]14[/C][C]0.183858[/C][C]1.7442[/C][C]0.042267[/C][/ROW]
[ROW][C]15[/C][C]0.064474[/C][C]0.6117[/C][C]0.271154[/C][/ROW]
[ROW][C]16[/C][C]0.028404[/C][C]0.2695[/C][C]0.394094[/C][/ROW]
[ROW][C]17[/C][C]0.014578[/C][C]0.1383[/C][C]0.445157[/C][/ROW]
[ROW][C]18[/C][C]0.065861[/C][C]0.6248[/C][C]0.266836[/C][/ROW]
[ROW][C]19[/C][C]-0.030303[/C][C]-0.2875[/C][C]0.387202[/C][/ROW]
[ROW][C]20[/C][C]-0.167805[/C][C]-1.5919[/C][C]0.057453[/C][/ROW]
[ROW][C]21[/C][C]-0.094361[/C][C]-0.8952[/C][C]0.186538[/C][/ROW]
[ROW][C]22[/C][C]-0.062021[/C][C]-0.5884[/C][C]0.278874[/C][/ROW]
[ROW][C]23[/C][C]0.10427[/C][C]0.9892[/C][C]0.162611[/C][/ROW]
[ROW][C]24[/C][C]-0.22031[/C][C]-2.09[/C][C]0.019717[/C][/ROW]
[ROW][C]25[/C][C]0.039678[/C][C]0.3764[/C][C]0.353747[/C][/ROW]
[ROW][C]26[/C][C]0.079686[/C][C]0.756[/C][C]0.225822[/C][/ROW]
[ROW][C]27[/C][C]-0.011299[/C][C]-0.1072[/C][C]0.457436[/C][/ROW]
[ROW][C]28[/C][C]0.001038[/C][C]0.0099[/C][C]0.496081[/C][/ROW]
[ROW][C]29[/C][C]-0.030259[/C][C]-0.2871[/C][C]0.387364[/C][/ROW]
[ROW][C]30[/C][C]-0.008864[/C][C]-0.0841[/C][C]0.466586[/C][/ROW]
[ROW][C]31[/C][C]-0.127537[/C][C]-1.2099[/C][C]0.114739[/C][/ROW]
[ROW][C]32[/C][C]0.018451[/C][C]0.175[/C][C]0.430722[/C][/ROW]
[ROW][C]33[/C][C]0.112902[/C][C]1.0711[/C][C]0.143499[/C][/ROW]
[ROW][C]34[/C][C]-0.134805[/C][C]-1.2789[/C][C]0.102115[/C][/ROW]
[ROW][C]35[/C][C]-0.053044[/C][C]-0.5032[/C][C]0.308019[/C][/ROW]
[ROW][C]36[/C][C]-0.02639[/C][C]-0.2504[/C][C]0.401442[/C][/ROW]
[/TABLE]
Source: https://freestatistics.org/blog/index.php?pk=30340&T=2

Globally Unique Identifier (entire table): ba.freestatistics.org/blog/index.php?pk=30340&T=2

As an alternative you can also use a QR Code:  

The GUIDs for individual cells are displayed in the table below:

Partial Autocorrelation Function
Time lag kPACF(k)T-STATP-value
10.3459243.28170.000735
20.2050941.94570.027406
30.2236242.12150.018315
40.2049031.94390.027517
50.0529490.50230.308336
60.0475760.45130.326415
70.0056430.05350.478713
8-0.129797-1.23140.110697
90.1541921.46280.073504
10-0.093048-0.88270.189868
11-0.031251-0.29650.383777
12-0.303639-2.88060.002481
13-0.035211-0.3340.369562
140.1838581.74420.042267
150.0644740.61170.271154
160.0284040.26950.394094
170.0145780.13830.445157
180.0658610.62480.266836
19-0.030303-0.28750.387202
20-0.167805-1.59190.057453
21-0.094361-0.89520.186538
22-0.062021-0.58840.278874
230.104270.98920.162611
24-0.22031-2.090.019717
250.0396780.37640.353747
260.0796860.7560.225822
27-0.011299-0.10720.457436
280.0010380.00990.496081
29-0.030259-0.28710.387364
30-0.008864-0.08410.466586
31-0.127537-1.20990.114739
320.0184510.1750.430722
330.1129021.07110.143499
34-0.134805-1.27890.102115
35-0.053044-0.50320.308019
36-0.02639-0.25040.401442


Parameters (Session):
par1 = 36 ; par2 = -0.1 ; par3 = 0 ; par4 = 1 ; par5 = 12 ;
Parameters (R input):
par1 = 36 ; par2 = -0.1 ; par3 = 0 ; par4 = 1 ; par5 = 12 ;
R code (references can be found in the software module):
if (par1 == 'Default') {
par1 = 10*log10(length(x))
} else {
par1 <- as.numeric(par1)
}
par2 <- as.numeric(par2)
par3 <- as.numeric(par3)
par4 <- as.numeric(par4)
par5 <- as.numeric(par5)
if (par2 == 0) {
x <- log(x)
} else {
x <- (x ^ par2 - 1) / par2
}
if (par3 > 0) x <- diff(x,lag=1,difference=par3)
if (par4 > 0) x <- diff(x,lag=par5,difference=par4)
bitmap(file='pic1.png')
racf <- acf(x,par1,main='Autocorrelation',xlab='lags',ylab='ACF')
dev.off()
bitmap(file='pic2.png')
rpacf <- pacf(x,par1,main='Partial Autocorrelation',xlab='lags',ylab='PACF')
dev.off()
(myacf <- c(racf$acf))
(mypacf <- c(rpacf$acf))
lengthx <- length(x)
sqrtn <- sqrt(lengthx)
load(file='createtable')
a<-table.start()
a<-table.row.start(a)
a<-table.element(a,'Autocorrelation Function',4,TRUE)
a<-table.row.end(a)
a<-table.row.start(a)
a<-table.element(a,'Time lag k',header=TRUE)
a<-table.element(a,hyperlink('basics.htm','ACF(k)','click here for more information about the Autocorrelation Function'),header=TRUE)
a<-table.element(a,'T-STAT',header=TRUE)
a<-table.element(a,'P-value',header=TRUE)
a<-table.row.end(a)
for (i in 2:(par1+1)) {
a<-table.row.start(a)
a<-table.element(a,i-1,header=TRUE)
a<-table.element(a,round(myacf[i],6))
mytstat <- myacf[i]*sqrtn
a<-table.element(a,round(mytstat,4))
a<-table.element(a,round(1-pt(abs(mytstat),lengthx),6))
a<-table.row.end(a)
}
a<-table.end(a)
table.save(a,file='mytable.tab')
a<-table.start()
a<-table.row.start(a)
a<-table.element(a,'Partial Autocorrelation Function',4,TRUE)
a<-table.row.end(a)
a<-table.row.start(a)
a<-table.element(a,'Time lag k',header=TRUE)
a<-table.element(a,hyperlink('basics.htm','PACF(k)','click here for more information about the Partial Autocorrelation Function'),header=TRUE)
a<-table.element(a,'T-STAT',header=TRUE)
a<-table.element(a,'P-value',header=TRUE)
a<-table.row.end(a)
for (i in 1:par1) {
a<-table.row.start(a)
a<-table.element(a,i,header=TRUE)
a<-table.element(a,round(mypacf[i],6))
mytstat <- mypacf[i]*sqrtn
a<-table.element(a,round(mytstat,4))
a<-table.element(a,round(1-pt(abs(mytstat),lengthx),6))
a<-table.row.end(a)
}
a<-table.end(a)
table.save(a,file='mytable1.tab')