Free Statistics

of Irreproducible Research!

Author's title

Author*The author of this computation has been verified*
R Software Modulerwasp_arimabackwardselection.wasp
Title produced by softwareARIMA Backward Selection
Date of computationSun, 07 Dec 2008 16:13:24 -0700
Cite this page as followsStatistical Computations at FreeStatistics.org, Office for Research Development and Education, URL https://freestatistics.org/blog/index.php?v=date/2008/Dec/08/t122869168083zm6ddc04j0xdy.htm/, Retrieved Thu, 16 May 2024 12:04:20 +0000
Statistical Computations at FreeStatistics.org, Office for Research Development and Education, URL https://freestatistics.org/blog/index.php?pk=30339, Retrieved Thu, 16 May 2024 12:04:20 +0000
QR Codes:

Original text written by user:
IsPrivate?No (this computation is public)
User-defined keywords
Estimated Impact202
Family? (F = Feedback message, R = changed R code, M = changed R Module, P = changed Parameters, D = changed Data)
F     [Standard Deviation-Mean Plot] [step 1] [2008-12-06 12:33:55] [c45c87b96bbf32ffc2144fc37d767b2e]
F RM    [Variance Reduction Matrix] [VRM] [2008-12-07 19:46:08] [c45c87b96bbf32ffc2144fc37d767b2e]
F RMP       [ARIMA Backward Selection] [backward estimation] [2008-12-07 23:13:24] [3dc594a6c62226e1e98766c4d385bfaa] [Current]
Feedback Forum
2008-12-14 21:02:08 [Michaël De Kuyer] [reply
Deze vraag heb ik naar mijn mening correct beantwoord. Ik had nog kunnen vermelden dat er een AR1, MA1, SAR1 en een SMA1 proces aanwezig is.
2008-12-15 20:22:12 [8e2cc0b2ef568da46d009b2f601285b2] [reply
Correct berekend en de formule opgesteld. Het antwoord zelf is juist enkel wel een beetje beknopt.

Post a new message
Dataseries X:
3595
3914
4159
3676
3794
3446
3504
3958
3353
3480
3098
2944
3389
3497
4404
3849
3734
3060
3507
3287
3215
3764
2734
2837
2766
3851
3289
3848
3348
3682
4058
3655
3811
3341
3032
3475
3353
3186
3902
4164
3499
4145
3796
3711
3949
3740
3243
4407
4814
3908
5250
3937
4004
5560
3922
3759
4138
4634
3996
4308
4142
4429
5219
4929
5754
5592
4163
4962
5208
4755
4491
5732
5730
5024
6056
4901
5353
5578
4618
4724
5011
5298
4143
4617
4736
4214
5112
4197
4119
5104
4194
4583
3790
5557
4304
3838
4277
4951
4479
4677
4274
4782


Summary of computational transaction
Raw Inputview raw input (R code)
Raw Outputview raw output of R engine
Computing time19 seconds
R Server'Herman Ole Andreas Wold' @ 193.190.124.10:1001

\begin{tabular}{lllllllll}
\hline
Summary of computational transaction \tabularnewline
Raw Input & view raw input (R code)  \tabularnewline
Raw Output & view raw output of R engine  \tabularnewline
Computing time & 19 seconds \tabularnewline
R Server & 'Herman Ole Andreas Wold' @ 193.190.124.10:1001 \tabularnewline
\hline
\end{tabular}
%Source: https://freestatistics.org/blog/index.php?pk=30339&T=0

[TABLE]
[ROW][C]Summary of computational transaction[/C][/ROW]
[ROW][C]Raw Input[/C][C]view raw input (R code) [/C][/ROW]
[ROW][C]Raw Output[/C][C]view raw output of R engine [/C][/ROW]
[ROW][C]Computing time[/C][C]19 seconds[/C][/ROW]
[ROW][C]R Server[/C][C]'Herman Ole Andreas Wold' @ 193.190.124.10:1001[/C][/ROW]
[/TABLE]
Source: https://freestatistics.org/blog/index.php?pk=30339&T=0

Globally Unique Identifier (entire table): ba.freestatistics.org/blog/index.php?pk=30339&T=0

As an alternative you can also use a QR Code:  

The GUIDs for individual cells are displayed in the table below:

Summary of computational transaction
Raw Inputview raw input (R code)
Raw Outputview raw output of R engine
Computing time19 seconds
R Server'Herman Ole Andreas Wold' @ 193.190.124.10:1001


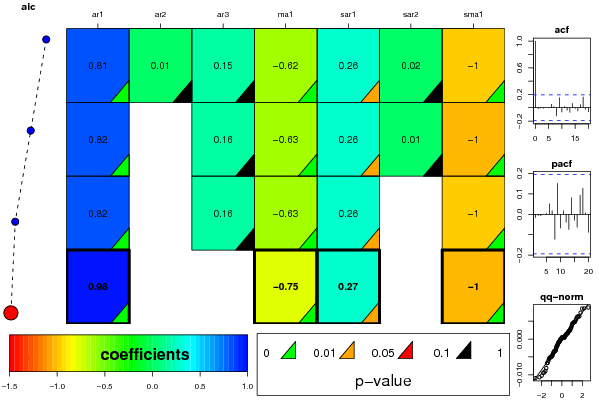
ARIMA Parameter Estimation and Backward Selection
Iterationar1ar2ar3ma1sar1sar2sma1
Estimates ( 1 )0.80510.01410.1528-0.62450.2640.0163-0.9995
(p-val)(0 )(0.9202 )(0.2636 )(1e-04 )(0.0415 )(0.9016 )(0 )
Estimates ( 2 )0.81600.1568-0.62890.26390.0138-1.0003
(p-val)(0 )(NA )(0.2289 )(0 )(0.0414 )(0.9155 )(0 )
Estimates ( 3 )0.818600.1552-0.63050.26220-0.9999
(p-val)(0 )(NA )(0.2294 )(0 )(0.0402 )(NA )(0 )
Estimates ( 4 )0.984700-0.75250.27320-1
(p-val)(0 )(NA )(NA )(0 )(0.0326 )(NA )(0 )
Estimates ( 5 )NANANANANANANA
(p-val)(NA )(NA )(NA )(NA )(NA )(NA )(NA )
Estimates ( 6 )NANANANANANANA
(p-val)(NA )(NA )(NA )(NA )(NA )(NA )(NA )
Estimates ( 7 )NANANANANANANA
(p-val)(NA )(NA )(NA )(NA )(NA )(NA )(NA )
Estimates ( 8 )NANANANANANANA
(p-val)(NA )(NA )(NA )(NA )(NA )(NA )(NA )
Estimates ( 9 )NANANANANANANA
(p-val)(NA )(NA )(NA )(NA )(NA )(NA )(NA )
Estimates ( 10 )NANANANANANANA
(p-val)(NA )(NA )(NA )(NA )(NA )(NA )(NA )
Estimates ( 11 )NANANANANANANA
(p-val)(NA )(NA )(NA )(NA )(NA )(NA )(NA )
Estimates ( 12 )NANANANANANANA
(p-val)(NA )(NA )(NA )(NA )(NA )(NA )(NA )
Estimates ( 13 )NANANANANANANA
(p-val)(NA )(NA )(NA )(NA )(NA )(NA )(NA )

\begin{tabular}{lllllllll}
\hline
ARIMA Parameter Estimation and Backward Selection \tabularnewline
Iteration & ar1 & ar2 & ar3 & ma1 & sar1 & sar2 & sma1 \tabularnewline
Estimates ( 1 ) & 0.8051 & 0.0141 & 0.1528 & -0.6245 & 0.264 & 0.0163 & -0.9995 \tabularnewline
(p-val) & (0 ) & (0.9202 ) & (0.2636 ) & (1e-04 ) & (0.0415 ) & (0.9016 ) & (0 ) \tabularnewline
Estimates ( 2 ) & 0.816 & 0 & 0.1568 & -0.6289 & 0.2639 & 0.0138 & -1.0003 \tabularnewline
(p-val) & (0 ) & (NA ) & (0.2289 ) & (0 ) & (0.0414 ) & (0.9155 ) & (0 ) \tabularnewline
Estimates ( 3 ) & 0.8186 & 0 & 0.1552 & -0.6305 & 0.2622 & 0 & -0.9999 \tabularnewline
(p-val) & (0 ) & (NA ) & (0.2294 ) & (0 ) & (0.0402 ) & (NA ) & (0 ) \tabularnewline
Estimates ( 4 ) & 0.9847 & 0 & 0 & -0.7525 & 0.2732 & 0 & -1 \tabularnewline
(p-val) & (0 ) & (NA ) & (NA ) & (0 ) & (0.0326 ) & (NA ) & (0 ) \tabularnewline
Estimates ( 5 ) & NA & NA & NA & NA & NA & NA & NA \tabularnewline
(p-val) & (NA ) & (NA ) & (NA ) & (NA ) & (NA ) & (NA ) & (NA ) \tabularnewline
Estimates ( 6 ) & NA & NA & NA & NA & NA & NA & NA \tabularnewline
(p-val) & (NA ) & (NA ) & (NA ) & (NA ) & (NA ) & (NA ) & (NA ) \tabularnewline
Estimates ( 7 ) & NA & NA & NA & NA & NA & NA & NA \tabularnewline
(p-val) & (NA ) & (NA ) & (NA ) & (NA ) & (NA ) & (NA ) & (NA ) \tabularnewline
Estimates ( 8 ) & NA & NA & NA & NA & NA & NA & NA \tabularnewline
(p-val) & (NA ) & (NA ) & (NA ) & (NA ) & (NA ) & (NA ) & (NA ) \tabularnewline
Estimates ( 9 ) & NA & NA & NA & NA & NA & NA & NA \tabularnewline
(p-val) & (NA ) & (NA ) & (NA ) & (NA ) & (NA ) & (NA ) & (NA ) \tabularnewline
Estimates ( 10 ) & NA & NA & NA & NA & NA & NA & NA \tabularnewline
(p-val) & (NA ) & (NA ) & (NA ) & (NA ) & (NA ) & (NA ) & (NA ) \tabularnewline
Estimates ( 11 ) & NA & NA & NA & NA & NA & NA & NA \tabularnewline
(p-val) & (NA ) & (NA ) & (NA ) & (NA ) & (NA ) & (NA ) & (NA ) \tabularnewline
Estimates ( 12 ) & NA & NA & NA & NA & NA & NA & NA \tabularnewline
(p-val) & (NA ) & (NA ) & (NA ) & (NA ) & (NA ) & (NA ) & (NA ) \tabularnewline
Estimates ( 13 ) & NA & NA & NA & NA & NA & NA & NA \tabularnewline
(p-val) & (NA ) & (NA ) & (NA ) & (NA ) & (NA ) & (NA ) & (NA ) \tabularnewline
\hline
\end{tabular}
%Source: https://freestatistics.org/blog/index.php?pk=30339&T=1

[TABLE]
[ROW][C]ARIMA Parameter Estimation and Backward Selection[/C][/ROW]
[ROW][C]Iteration[/C][C]ar1[/C][C]ar2[/C][C]ar3[/C][C]ma1[/C][C]sar1[/C][C]sar2[/C][C]sma1[/C][/ROW]
[ROW][C]Estimates ( 1 )[/C][C]0.8051[/C][C]0.0141[/C][C]0.1528[/C][C]-0.6245[/C][C]0.264[/C][C]0.0163[/C][C]-0.9995[/C][/ROW]
[ROW][C](p-val)[/C][C](0 )[/C][C](0.9202 )[/C][C](0.2636 )[/C][C](1e-04 )[/C][C](0.0415 )[/C][C](0.9016 )[/C][C](0 )[/C][/ROW]
[ROW][C]Estimates ( 2 )[/C][C]0.816[/C][C]0[/C][C]0.1568[/C][C]-0.6289[/C][C]0.2639[/C][C]0.0138[/C][C]-1.0003[/C][/ROW]
[ROW][C](p-val)[/C][C](0 )[/C][C](NA )[/C][C](0.2289 )[/C][C](0 )[/C][C](0.0414 )[/C][C](0.9155 )[/C][C](0 )[/C][/ROW]
[ROW][C]Estimates ( 3 )[/C][C]0.8186[/C][C]0[/C][C]0.1552[/C][C]-0.6305[/C][C]0.2622[/C][C]0[/C][C]-0.9999[/C][/ROW]
[ROW][C](p-val)[/C][C](0 )[/C][C](NA )[/C][C](0.2294 )[/C][C](0 )[/C][C](0.0402 )[/C][C](NA )[/C][C](0 )[/C][/ROW]
[ROW][C]Estimates ( 4 )[/C][C]0.9847[/C][C]0[/C][C]0[/C][C]-0.7525[/C][C]0.2732[/C][C]0[/C][C]-1[/C][/ROW]
[ROW][C](p-val)[/C][C](0 )[/C][C](NA )[/C][C](NA )[/C][C](0 )[/C][C](0.0326 )[/C][C](NA )[/C][C](0 )[/C][/ROW]
[ROW][C]Estimates ( 5 )[/C][C]NA[/C][C]NA[/C][C]NA[/C][C]NA[/C][C]NA[/C][C]NA[/C][C]NA[/C][/ROW]
[ROW][C](p-val)[/C][C](NA )[/C][C](NA )[/C][C](NA )[/C][C](NA )[/C][C](NA )[/C][C](NA )[/C][C](NA )[/C][/ROW]
[ROW][C]Estimates ( 6 )[/C][C]NA[/C][C]NA[/C][C]NA[/C][C]NA[/C][C]NA[/C][C]NA[/C][C]NA[/C][/ROW]
[ROW][C](p-val)[/C][C](NA )[/C][C](NA )[/C][C](NA )[/C][C](NA )[/C][C](NA )[/C][C](NA )[/C][C](NA )[/C][/ROW]
[ROW][C]Estimates ( 7 )[/C][C]NA[/C][C]NA[/C][C]NA[/C][C]NA[/C][C]NA[/C][C]NA[/C][C]NA[/C][/ROW]
[ROW][C](p-val)[/C][C](NA )[/C][C](NA )[/C][C](NA )[/C][C](NA )[/C][C](NA )[/C][C](NA )[/C][C](NA )[/C][/ROW]
[ROW][C]Estimates ( 8 )[/C][C]NA[/C][C]NA[/C][C]NA[/C][C]NA[/C][C]NA[/C][C]NA[/C][C]NA[/C][/ROW]
[ROW][C](p-val)[/C][C](NA )[/C][C](NA )[/C][C](NA )[/C][C](NA )[/C][C](NA )[/C][C](NA )[/C][C](NA )[/C][/ROW]
[ROW][C]Estimates ( 9 )[/C][C]NA[/C][C]NA[/C][C]NA[/C][C]NA[/C][C]NA[/C][C]NA[/C][C]NA[/C][/ROW]
[ROW][C](p-val)[/C][C](NA )[/C][C](NA )[/C][C](NA )[/C][C](NA )[/C][C](NA )[/C][C](NA )[/C][C](NA )[/C][/ROW]
[ROW][C]Estimates ( 10 )[/C][C]NA[/C][C]NA[/C][C]NA[/C][C]NA[/C][C]NA[/C][C]NA[/C][C]NA[/C][/ROW]
[ROW][C](p-val)[/C][C](NA )[/C][C](NA )[/C][C](NA )[/C][C](NA )[/C][C](NA )[/C][C](NA )[/C][C](NA )[/C][/ROW]
[ROW][C]Estimates ( 11 )[/C][C]NA[/C][C]NA[/C][C]NA[/C][C]NA[/C][C]NA[/C][C]NA[/C][C]NA[/C][/ROW]
[ROW][C](p-val)[/C][C](NA )[/C][C](NA )[/C][C](NA )[/C][C](NA )[/C][C](NA )[/C][C](NA )[/C][C](NA )[/C][/ROW]
[ROW][C]Estimates ( 12 )[/C][C]NA[/C][C]NA[/C][C]NA[/C][C]NA[/C][C]NA[/C][C]NA[/C][C]NA[/C][/ROW]
[ROW][C](p-val)[/C][C](NA )[/C][C](NA )[/C][C](NA )[/C][C](NA )[/C][C](NA )[/C][C](NA )[/C][C](NA )[/C][/ROW]
[ROW][C]Estimates ( 13 )[/C][C]NA[/C][C]NA[/C][C]NA[/C][C]NA[/C][C]NA[/C][C]NA[/C][C]NA[/C][/ROW]
[ROW][C](p-val)[/C][C](NA )[/C][C](NA )[/C][C](NA )[/C][C](NA )[/C][C](NA )[/C][C](NA )[/C][C](NA )[/C][/ROW]
[/TABLE]
Source: https://freestatistics.org/blog/index.php?pk=30339&T=1

Globally Unique Identifier (entire table): ba.freestatistics.org/blog/index.php?pk=30339&T=1

As an alternative you can also use a QR Code:  

The GUIDs for individual cells are displayed in the table below:

ARIMA Parameter Estimation and Backward Selection
Iterationar1ar2ar3ma1sar1sar2sma1
Estimates ( 1 )0.80510.01410.1528-0.62450.2640.0163-0.9995
(p-val)(0 )(0.9202 )(0.2636 )(1e-04 )(0.0415 )(0.9016 )(0 )
Estimates ( 2 )0.81600.1568-0.62890.26390.0138-1.0003
(p-val)(0 )(NA )(0.2289 )(0 )(0.0414 )(0.9155 )(0 )
Estimates ( 3 )0.818600.1552-0.63050.26220-0.9999
(p-val)(0 )(NA )(0.2294 )(0 )(0.0402 )(NA )(0 )
Estimates ( 4 )0.984700-0.75250.27320-1
(p-val)(0 )(NA )(NA )(0 )(0.0326 )(NA )(0 )
Estimates ( 5 )NANANANANANANA
(p-val)(NA )(NA )(NA )(NA )(NA )(NA )(NA )
Estimates ( 6 )NANANANANANANA
(p-val)(NA )(NA )(NA )(NA )(NA )(NA )(NA )
Estimates ( 7 )NANANANANANANA
(p-val)(NA )(NA )(NA )(NA )(NA )(NA )(NA )
Estimates ( 8 )NANANANANANANA
(p-val)(NA )(NA )(NA )(NA )(NA )(NA )(NA )
Estimates ( 9 )NANANANANANANA
(p-val)(NA )(NA )(NA )(NA )(NA )(NA )(NA )
Estimates ( 10 )NANANANANANANA
(p-val)(NA )(NA )(NA )(NA )(NA )(NA )(NA )
Estimates ( 11 )NANANANANANANA
(p-val)(NA )(NA )(NA )(NA )(NA )(NA )(NA )
Estimates ( 12 )NANANANANANANA
(p-val)(NA )(NA )(NA )(NA )(NA )(NA )(NA )
Estimates ( 13 )NANANANANANANA
(p-val)(NA )(NA )(NA )(NA )(NA )(NA )(NA )


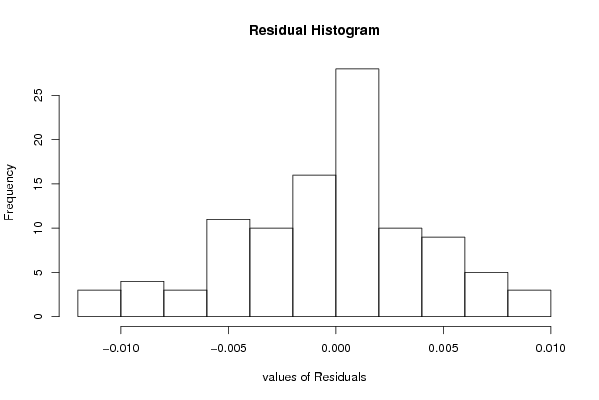
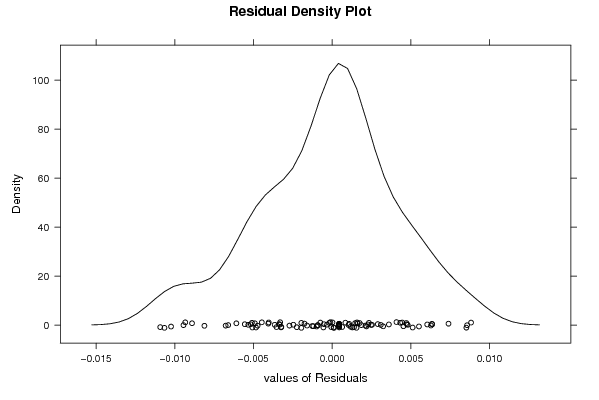
Estimated ARIMA Residuals
Value
0.000449887185009588
0.00185503888068061
0.00308539492951456
-0.00330587510912438
-0.00225131102171607
-0.000115756293464558
0.00408424717894479
-0.000527736456366855
0.00627560427258418
-0.000328612433607889
-0.00403202704923039
0.00323845922374389
-0.000560512838350229
0.00738992445642743
-0.00507107244253496
0.00852604515858902
-0.00473993168960609
0.00233213936032160
-0.00890685268351728
-0.00660753498536723
-0.00175903079691573
-0.00491036678590955
0.00603890539880496
-0.000989590174115737
-0.00516905774905421
-0.00159643305621610
0.00882352259612918
-0.000929792575597486
-0.00195916804161987
0.00108133731882605
-0.00608830609766038
0.00217594778240898
0.000835733390292865
-0.00195971158226969
-0.000906536556011546
-0.00126948360807039
-0.0102399612633098
-0.0109260685759958
0.00104070577290341
-0.00509854902625212
0.00857027596616438
0.00138976742236154
-0.00933499903979932
0.00474272756070633
0.0045257562704951
0.00117133428234323
-0.00484224875781198
-0.00532897291659572
-0.00119386694653864
0.00360186530947196
-0.000755308050074806
-0.000183851632135357
-0.00405919526732557
-0.0106575504250819
-0.00246775719719446
0.00444598250766363
-0.00325302696781075
-0.00365419939724158
0.00157275516582692
-0.00271725137461838
-0.0081179903911494
-0.00676840272137547
0.00161592999644908
0.000112247093387052
0.0063311591895705
0.00211593867301858
0.000633421849935659
0.00145945795780325
0.00246813637007686
9.06764556809039e-05
-0.00334031164847741
0.00174308636842029
0.00289561245193932
0.00252926360405524
0.00551352827742111
0.00228011345172249
0.00471230577578706
0.00479626545967227
-0.0033669996140277
1.88981611964996e-05
-0.00353618838231739
0.00635880998666197
-0.009449977712233
-0.00447198799227104
0.00432409126531971
0.00128142725927096
-0.00555300795318135
0.00511318631607781
-0.00323082702819812
0.00154405894654853
-5.99034645342635e-05

\begin{tabular}{lllllllll}
\hline
Estimated ARIMA Residuals \tabularnewline
Value \tabularnewline
0.000449887185009588 \tabularnewline
0.00185503888068061 \tabularnewline
0.00308539492951456 \tabularnewline
-0.00330587510912438 \tabularnewline
-0.00225131102171607 \tabularnewline
-0.000115756293464558 \tabularnewline
0.00408424717894479 \tabularnewline
-0.000527736456366855 \tabularnewline
0.00627560427258418 \tabularnewline
-0.000328612433607889 \tabularnewline
-0.00403202704923039 \tabularnewline
0.00323845922374389 \tabularnewline
-0.000560512838350229 \tabularnewline
0.00738992445642743 \tabularnewline
-0.00507107244253496 \tabularnewline
0.00852604515858902 \tabularnewline
-0.00473993168960609 \tabularnewline
0.00233213936032160 \tabularnewline
-0.00890685268351728 \tabularnewline
-0.00660753498536723 \tabularnewline
-0.00175903079691573 \tabularnewline
-0.00491036678590955 \tabularnewline
0.00603890539880496 \tabularnewline
-0.000989590174115737 \tabularnewline
-0.00516905774905421 \tabularnewline
-0.00159643305621610 \tabularnewline
0.00882352259612918 \tabularnewline
-0.000929792575597486 \tabularnewline
-0.00195916804161987 \tabularnewline
0.00108133731882605 \tabularnewline
-0.00608830609766038 \tabularnewline
0.00217594778240898 \tabularnewline
0.000835733390292865 \tabularnewline
-0.00195971158226969 \tabularnewline
-0.000906536556011546 \tabularnewline
-0.00126948360807039 \tabularnewline
-0.0102399612633098 \tabularnewline
-0.0109260685759958 \tabularnewline
0.00104070577290341 \tabularnewline
-0.00509854902625212 \tabularnewline
0.00857027596616438 \tabularnewline
0.00138976742236154 \tabularnewline
-0.00933499903979932 \tabularnewline
0.00474272756070633 \tabularnewline
0.0045257562704951 \tabularnewline
0.00117133428234323 \tabularnewline
-0.00484224875781198 \tabularnewline
-0.00532897291659572 \tabularnewline
-0.00119386694653864 \tabularnewline
0.00360186530947196 \tabularnewline
-0.000755308050074806 \tabularnewline
-0.000183851632135357 \tabularnewline
-0.00405919526732557 \tabularnewline
-0.0106575504250819 \tabularnewline
-0.00246775719719446 \tabularnewline
0.00444598250766363 \tabularnewline
-0.00325302696781075 \tabularnewline
-0.00365419939724158 \tabularnewline
0.00157275516582692 \tabularnewline
-0.00271725137461838 \tabularnewline
-0.0081179903911494 \tabularnewline
-0.00676840272137547 \tabularnewline
0.00161592999644908 \tabularnewline
0.000112247093387052 \tabularnewline
0.0063311591895705 \tabularnewline
0.00211593867301858 \tabularnewline
0.000633421849935659 \tabularnewline
0.00145945795780325 \tabularnewline
0.00246813637007686 \tabularnewline
9.06764556809039e-05 \tabularnewline
-0.00334031164847741 \tabularnewline
0.00174308636842029 \tabularnewline
0.00289561245193932 \tabularnewline
0.00252926360405524 \tabularnewline
0.00551352827742111 \tabularnewline
0.00228011345172249 \tabularnewline
0.00471230577578706 \tabularnewline
0.00479626545967227 \tabularnewline
-0.0033669996140277 \tabularnewline
1.88981611964996e-05 \tabularnewline
-0.00353618838231739 \tabularnewline
0.00635880998666197 \tabularnewline
-0.009449977712233 \tabularnewline
-0.00447198799227104 \tabularnewline
0.00432409126531971 \tabularnewline
0.00128142725927096 \tabularnewline
-0.00555300795318135 \tabularnewline
0.00511318631607781 \tabularnewline
-0.00323082702819812 \tabularnewline
0.00154405894654853 \tabularnewline
-5.99034645342635e-05 \tabularnewline
\hline
\end{tabular}
%Source: https://freestatistics.org/blog/index.php?pk=30339&T=2

[TABLE]
[ROW][C]Estimated ARIMA Residuals[/C][/ROW]
[ROW][C]Value[/C][/ROW]
[ROW][C]0.000449887185009588[/C][/ROW]
[ROW][C]0.00185503888068061[/C][/ROW]
[ROW][C]0.00308539492951456[/C][/ROW]
[ROW][C]-0.00330587510912438[/C][/ROW]
[ROW][C]-0.00225131102171607[/C][/ROW]
[ROW][C]-0.000115756293464558[/C][/ROW]
[ROW][C]0.00408424717894479[/C][/ROW]
[ROW][C]-0.000527736456366855[/C][/ROW]
[ROW][C]0.00627560427258418[/C][/ROW]
[ROW][C]-0.000328612433607889[/C][/ROW]
[ROW][C]-0.00403202704923039[/C][/ROW]
[ROW][C]0.00323845922374389[/C][/ROW]
[ROW][C]-0.000560512838350229[/C][/ROW]
[ROW][C]0.00738992445642743[/C][/ROW]
[ROW][C]-0.00507107244253496[/C][/ROW]
[ROW][C]0.00852604515858902[/C][/ROW]
[ROW][C]-0.00473993168960609[/C][/ROW]
[ROW][C]0.00233213936032160[/C][/ROW]
[ROW][C]-0.00890685268351728[/C][/ROW]
[ROW][C]-0.00660753498536723[/C][/ROW]
[ROW][C]-0.00175903079691573[/C][/ROW]
[ROW][C]-0.00491036678590955[/C][/ROW]
[ROW][C]0.00603890539880496[/C][/ROW]
[ROW][C]-0.000989590174115737[/C][/ROW]
[ROW][C]-0.00516905774905421[/C][/ROW]
[ROW][C]-0.00159643305621610[/C][/ROW]
[ROW][C]0.00882352259612918[/C][/ROW]
[ROW][C]-0.000929792575597486[/C][/ROW]
[ROW][C]-0.00195916804161987[/C][/ROW]
[ROW][C]0.00108133731882605[/C][/ROW]
[ROW][C]-0.00608830609766038[/C][/ROW]
[ROW][C]0.00217594778240898[/C][/ROW]
[ROW][C]0.000835733390292865[/C][/ROW]
[ROW][C]-0.00195971158226969[/C][/ROW]
[ROW][C]-0.000906536556011546[/C][/ROW]
[ROW][C]-0.00126948360807039[/C][/ROW]
[ROW][C]-0.0102399612633098[/C][/ROW]
[ROW][C]-0.0109260685759958[/C][/ROW]
[ROW][C]0.00104070577290341[/C][/ROW]
[ROW][C]-0.00509854902625212[/C][/ROW]
[ROW][C]0.00857027596616438[/C][/ROW]
[ROW][C]0.00138976742236154[/C][/ROW]
[ROW][C]-0.00933499903979932[/C][/ROW]
[ROW][C]0.00474272756070633[/C][/ROW]
[ROW][C]0.0045257562704951[/C][/ROW]
[ROW][C]0.00117133428234323[/C][/ROW]
[ROW][C]-0.00484224875781198[/C][/ROW]
[ROW][C]-0.00532897291659572[/C][/ROW]
[ROW][C]-0.00119386694653864[/C][/ROW]
[ROW][C]0.00360186530947196[/C][/ROW]
[ROW][C]-0.000755308050074806[/C][/ROW]
[ROW][C]-0.000183851632135357[/C][/ROW]
[ROW][C]-0.00405919526732557[/C][/ROW]
[ROW][C]-0.0106575504250819[/C][/ROW]
[ROW][C]-0.00246775719719446[/C][/ROW]
[ROW][C]0.00444598250766363[/C][/ROW]
[ROW][C]-0.00325302696781075[/C][/ROW]
[ROW][C]-0.00365419939724158[/C][/ROW]
[ROW][C]0.00157275516582692[/C][/ROW]
[ROW][C]-0.00271725137461838[/C][/ROW]
[ROW][C]-0.0081179903911494[/C][/ROW]
[ROW][C]-0.00676840272137547[/C][/ROW]
[ROW][C]0.00161592999644908[/C][/ROW]
[ROW][C]0.000112247093387052[/C][/ROW]
[ROW][C]0.0063311591895705[/C][/ROW]
[ROW][C]0.00211593867301858[/C][/ROW]
[ROW][C]0.000633421849935659[/C][/ROW]
[ROW][C]0.00145945795780325[/C][/ROW]
[ROW][C]0.00246813637007686[/C][/ROW]
[ROW][C]9.06764556809039e-05[/C][/ROW]
[ROW][C]-0.00334031164847741[/C][/ROW]
[ROW][C]0.00174308636842029[/C][/ROW]
[ROW][C]0.00289561245193932[/C][/ROW]
[ROW][C]0.00252926360405524[/C][/ROW]
[ROW][C]0.00551352827742111[/C][/ROW]
[ROW][C]0.00228011345172249[/C][/ROW]
[ROW][C]0.00471230577578706[/C][/ROW]
[ROW][C]0.00479626545967227[/C][/ROW]
[ROW][C]-0.0033669996140277[/C][/ROW]
[ROW][C]1.88981611964996e-05[/C][/ROW]
[ROW][C]-0.00353618838231739[/C][/ROW]
[ROW][C]0.00635880998666197[/C][/ROW]
[ROW][C]-0.009449977712233[/C][/ROW]
[ROW][C]-0.00447198799227104[/C][/ROW]
[ROW][C]0.00432409126531971[/C][/ROW]
[ROW][C]0.00128142725927096[/C][/ROW]
[ROW][C]-0.00555300795318135[/C][/ROW]
[ROW][C]0.00511318631607781[/C][/ROW]
[ROW][C]-0.00323082702819812[/C][/ROW]
[ROW][C]0.00154405894654853[/C][/ROW]
[ROW][C]-5.99034645342635e-05[/C][/ROW]
[/TABLE]
Source: https://freestatistics.org/blog/index.php?pk=30339&T=2

Globally Unique Identifier (entire table): ba.freestatistics.org/blog/index.php?pk=30339&T=2

As an alternative you can also use a QR Code:  

The GUIDs for individual cells are displayed in the table below:

Estimated ARIMA Residuals
Value
0.000449887185009588
0.00185503888068061
0.00308539492951456
-0.00330587510912438
-0.00225131102171607
-0.000115756293464558
0.00408424717894479
-0.000527736456366855
0.00627560427258418
-0.000328612433607889
-0.00403202704923039
0.00323845922374389
-0.000560512838350229
0.00738992445642743
-0.00507107244253496
0.00852604515858902
-0.00473993168960609
0.00233213936032160
-0.00890685268351728
-0.00660753498536723
-0.00175903079691573
-0.00491036678590955
0.00603890539880496
-0.000989590174115737
-0.00516905774905421
-0.00159643305621610
0.00882352259612918
-0.000929792575597486
-0.00195916804161987
0.00108133731882605
-0.00608830609766038
0.00217594778240898
0.000835733390292865
-0.00195971158226969
-0.000906536556011546
-0.00126948360807039
-0.0102399612633098
-0.0109260685759958
0.00104070577290341
-0.00509854902625212
0.00857027596616438
0.00138976742236154
-0.00933499903979932
0.00474272756070633
0.0045257562704951
0.00117133428234323
-0.00484224875781198
-0.00532897291659572
-0.00119386694653864
0.00360186530947196
-0.000755308050074806
-0.000183851632135357
-0.00405919526732557
-0.0106575504250819
-0.00246775719719446
0.00444598250766363
-0.00325302696781075
-0.00365419939724158
0.00157275516582692
-0.00271725137461838
-0.0081179903911494
-0.00676840272137547
0.00161592999644908
0.000112247093387052
0.0063311591895705
0.00211593867301858
0.000633421849935659
0.00145945795780325
0.00246813637007686
9.06764556809039e-05
-0.00334031164847741
0.00174308636842029
0.00289561245193932
0.00252926360405524
0.00551352827742111
0.00228011345172249
0.00471230577578706
0.00479626545967227
-0.0033669996140277
1.88981611964996e-05
-0.00353618838231739
0.00635880998666197
-0.009449977712233
-0.00447198799227104
0.00432409126531971
0.00128142725927096
-0.00555300795318135
0.00511318631607781
-0.00323082702819812
0.00154405894654853
-5.99034645342635e-05


Parameters (Session):
par1 = FALSE ; par2 = -0.1 ; par3 = 0 ; par4 = 1 ; par5 = 12 ; par6 = 3 ; par7 = 1 ; par8 = 2 ; par9 = 1 ;
Parameters (R input):
par1 = FALSE ; par2 = -0.1 ; par3 = 0 ; par4 = 1 ; par5 = 12 ; par6 = 3 ; par7 = 1 ; par8 = 2 ; par9 = 1 ;
R code (references can be found in the software module):
library(lattice)
if (par1 == 'TRUE') par1 <- TRUE
if (par1 == 'FALSE') par1 <- FALSE
par2 <- as.numeric(par2) #Box-Cox lambda transformation parameter
par3 <- as.numeric(par3) #degree of non-seasonal differencing
par4 <- as.numeric(par4) #degree of seasonal differencing
par5 <- as.numeric(par5) #seasonal period
par6 <- as.numeric(par6) #degree (p) of the non-seasonal AR(p) polynomial
par7 <- as.numeric(par7) #degree (q) of the non-seasonal MA(q) polynomial
par8 <- as.numeric(par8) #degree (P) of the seasonal AR(P) polynomial
par9 <- as.numeric(par9) #degree (Q) of the seasonal MA(Q) polynomial
armaGR <- function(arima.out, names, n){
try1 <- arima.out$coef
try2 <- sqrt(diag(arima.out$var.coef))
try.data.frame <- data.frame(matrix(NA,ncol=4,nrow=length(names)))
dimnames(try.data.frame) <- list(names,c('coef','std','tstat','pv'))
try.data.frame[,1] <- try1
for(i in 1:length(try2)) try.data.frame[which(rownames(try.data.frame)==names(try2)[i]),2] <- try2[i]
try.data.frame[,3] <- try.data.frame[,1] / try.data.frame[,2]
try.data.frame[,4] <- round((1-pt(abs(try.data.frame[,3]),df=n-(length(try2)+1)))*2,5)
vector <- rep(NA,length(names))
vector[is.na(try.data.frame[,4])] <- 0
maxi <- which.max(try.data.frame[,4])
continue <- max(try.data.frame[,4],na.rm=TRUE) > .05
vector[maxi] <- 0
list(summary=try.data.frame,next.vector=vector,continue=continue)
}
arimaSelect <- function(series, order=c(13,0,0), seasonal=list(order=c(2,0,0),period=12), include.mean=F){
nrc <- order[1]+order[3]+seasonal$order[1]+seasonal$order[3]
coeff <- matrix(NA, nrow=nrc*2, ncol=nrc)
pval <- matrix(NA, nrow=nrc*2, ncol=nrc)
mylist <- rep(list(NULL), nrc)
names <- NULL
if(order[1] > 0) names <- paste('ar',1:order[1],sep='')
if(order[3] > 0) names <- c( names , paste('ma',1:order[3],sep='') )
if(seasonal$order[1] > 0) names <- c(names, paste('sar',1:seasonal$order[1],sep=''))
if(seasonal$order[3] > 0) names <- c(names, paste('sma',1:seasonal$order[3],sep=''))
arima.out <- arima(series, order=order, seasonal=seasonal, include.mean=include.mean, method='ML')
mylist[[1]] <- arima.out
last.arma <- armaGR(arima.out, names, length(series))
mystop <- FALSE
i <- 1
coeff[i,] <- last.arma[[1]][,1]
pval [i,] <- last.arma[[1]][,4]
i <- 2
aic <- arima.out$aic
while(!mystop){
mylist[[i]] <- arima.out
arima.out <- arima(series, order=order, seasonal=seasonal, include.mean=include.mean, method='ML', fixed=last.arma$next.vector)
aic <- c(aic, arima.out$aic)
last.arma <- armaGR(arima.out, names, length(series))
mystop <- !last.arma$continue
coeff[i,] <- last.arma[[1]][,1]
pval [i,] <- last.arma[[1]][,4]
i <- i+1
}
list(coeff, pval, mylist, aic=aic)
}
arimaSelectplot <- function(arimaSelect.out,noms,choix){
noms <- names(arimaSelect.out[[3]][[1]]$coef)
coeff <- arimaSelect.out[[1]]
k <- min(which(is.na(coeff[,1])))-1
coeff <- coeff[1:k,]
pval <- arimaSelect.out[[2]][1:k,]
aic <- arimaSelect.out$aic[1:k]
coeff[coeff==0] <- NA
n <- ncol(coeff)
if(missing(choix)) choix <- k
layout(matrix(c(1,1,1,2,
3,3,3,2,
3,3,3,4,
5,6,7,7),nr=4),
widths=c(10,35,45,15),
heights=c(30,30,15,15))
couleurs <- rainbow(75)[1:50]#(50)
ticks <- pretty(coeff)
par(mar=c(1,1,3,1))
plot(aic,k:1-.5,type='o',pch=21,bg='blue',cex=2,axes=F,lty=2,xpd=NA)
points(aic[choix],k-choix+.5,pch=21,cex=4,bg=2,xpd=NA)
title('aic',line=2)
par(mar=c(3,0,0,0))
plot(0,axes=F,xlab='',ylab='',xlim=range(ticks),ylim=c(.1,1))
rect(xleft = min(ticks) + (0:49)/50*(max(ticks)-min(ticks)),
xright = min(ticks) + (1:50)/50*(max(ticks)-min(ticks)),
ytop = rep(1,50),
ybottom= rep(0,50),col=couleurs,border=NA)
axis(1,ticks)
rect(xleft=min(ticks),xright=max(ticks),ytop=1,ybottom=0)
text(mean(coeff,na.rm=T),.5,'coefficients',cex=2,font=2)
par(mar=c(1,1,3,1))
image(1:n,1:k,t(coeff[k:1,]),axes=F,col=couleurs,zlim=range(ticks))
for(i in 1:n) for(j in 1:k) if(!is.na(coeff[j,i])) {
if(pval[j,i]<.01) symb = 'green'
else if( (pval[j,i]<.05) & (pval[j,i]>=.01)) symb = 'orange'
else if( (pval[j,i]<.1) & (pval[j,i]>=.05)) symb = 'red'
else symb = 'black'
polygon(c(i+.5 ,i+.2 ,i+.5 ,i+.5),
c(k-j+0.5,k-j+0.5,k-j+0.8,k-j+0.5),
col=symb)
if(j==choix) {
rect(xleft=i-.5,
xright=i+.5,
ybottom=k-j+1.5,
ytop=k-j+.5,
lwd=4)
text(i,
k-j+1,
round(coeff[j,i],2),
cex=1.2,
font=2)
}
else{
rect(xleft=i-.5,xright=i+.5,ybottom=k-j+1.5,ytop=k-j+.5)
text(i,k-j+1,round(coeff[j,i],2),cex=1.2,font=1)
}
}
axis(3,1:n,noms)
par(mar=c(0.5,0,0,0.5))
plot(0,axes=F,xlab='',ylab='',type='n',xlim=c(0,8),ylim=c(-.2,.8))
cols <- c('green','orange','red','black')
niv <- c('0','0.01','0.05','0.1')
for(i in 0:3){
polygon(c(1+2*i ,1+2*i ,1+2*i-.5 ,1+2*i),
c(.4 ,.7 , .4 , .4),
col=cols[i+1])
text(2*i,0.5,niv[i+1],cex=1.5)
}
text(8,.5,1,cex=1.5)
text(4,0,'p-value',cex=2)
box()
residus <- arimaSelect.out[[3]][[choix]]$res
par(mar=c(1,2,4,1))
acf(residus,main='')
title('acf',line=.5)
par(mar=c(1,2,4,1))
pacf(residus,main='')
title('pacf',line=.5)
par(mar=c(2,2,4,1))
qqnorm(residus,main='')
title('qq-norm',line=.5)
qqline(residus)
residus
}
if (par2 == 0) x <- log(x)
if (par2 != 0) x <- x^par2
(selection <- arimaSelect(x, order=c(par6,par3,par7), seasonal=list(order=c(par8,par4,par9), period=par5)))
bitmap(file='test1.png')
resid <- arimaSelectplot(selection)
dev.off()
resid
bitmap(file='test2.png')
acf(resid,length(resid)/2, main='Residual Autocorrelation Function')
dev.off()
bitmap(file='test3.png')
pacf(resid,length(resid)/2, main='Residual Partial Autocorrelation Function')
dev.off()
bitmap(file='test4.png')
cpgram(resid, main='Residual Cumulative Periodogram')
dev.off()
bitmap(file='test5.png')
hist(resid, main='Residual Histogram', xlab='values of Residuals')
dev.off()
bitmap(file='test6.png')
densityplot(~resid,col='black',main='Residual Density Plot', xlab='values of Residuals')
dev.off()
bitmap(file='test7.png')
qqnorm(resid, main='Residual Normal Q-Q Plot')
qqline(resid)
dev.off()
ncols <- length(selection[[1]][1,])
nrows <- length(selection[[2]][,1])-1
load(file='createtable')
a<-table.start()
a<-table.row.start(a)
a<-table.element(a,'ARIMA Parameter Estimation and Backward Selection', ncols+1,TRUE)
a<-table.row.end(a)
a<-table.row.start(a)
a<-table.element(a,'Iteration', header=TRUE)
for (i in 1:ncols) {
a<-table.element(a,names(selection[[3]][[1]]$coef)[i],header=TRUE)
}
a<-table.row.end(a)
for (j in 1:nrows) {
a<-table.row.start(a)
mydum <- 'Estimates ('
mydum <- paste(mydum,j)
mydum <- paste(mydum,')')
a<-table.element(a,mydum, header=TRUE)
for (i in 1:ncols) {
a<-table.element(a,round(selection[[1]][j,i],4))
}
a<-table.row.end(a)
a<-table.row.start(a)
a<-table.element(a,'(p-val)', header=TRUE)
for (i in 1:ncols) {
mydum <- '('
mydum <- paste(mydum,round(selection[[2]][j,i],4),sep='')
mydum <- paste(mydum,')')
a<-table.element(a,mydum)
}
a<-table.row.end(a)
}
a<-table.end(a)
table.save(a,file='mytable.tab')
a<-table.start()
a<-table.row.start(a)
a<-table.element(a,'Estimated ARIMA Residuals', 1,TRUE)
a<-table.row.end(a)
a<-table.row.start(a)
a<-table.element(a,'Value', 1,TRUE)
a<-table.row.end(a)
for (i in (par4*par5+par3):length(resid)) {
a<-table.row.start(a)
a<-table.element(a,resid[i])
a<-table.row.end(a)
}
a<-table.end(a)
table.save(a,file='mytable1.tab')