Free Statistics

of Irreproducible Research!

Author's title

Author*The author of this computation has been verified*
R Software Modulerwasp_multipleregression.wasp
Title produced by softwareMultiple Regression
Date of computationSun, 07 Dec 2008 15:00:11 -0700
Cite this page as followsStatistical Computations at FreeStatistics.org, Office for Research Development and Education, URL https://freestatistics.org/blog/index.php?v=date/2008/Dec/07/t1228687522vuz1hnjh3ujsiys.htm/, Retrieved Wed, 22 May 2024 06:42:17 +0000
Statistical Computations at FreeStatistics.org, Office for Research Development and Education, URL https://freestatistics.org/blog/index.php?pk=30320, Retrieved Wed, 22 May 2024 06:42:17 +0000
QR Codes:

Original text written by user:
IsPrivate?No (this computation is public)
User-defined keywords
Estimated Impact185
Family? (F = Feedback message, R = changed R code, M = changed R Module, P = changed Parameters, D = changed Data)
-     [Multiple Regression] [Paper - Multiple ...] [2008-12-05 16:55:46] [fce9014b1ad8484790f3b34d6ba09f7b]
-   P     [Multiple Regression] [Paper - Multiple ...] [2008-12-07 22:00:11] [7957bb37a64ed417bbed8444b0b0ea8a] [Current]
Feedback Forum

Post a new message
Dataseries X:
0	0
9	0
1	0
4	0
6	0
21	0
24	0
23	0
22	0
21	0
20	0
16	0
18	0
18	0
24	0
16	0
15	0
24	0
18	0
15	0
4	0
3	0
6	0
5	0
12	0
12	0
12	0
14	0
12	0
17	0
12	0
20	0
21	0
15	0
22	0
19	0
19	0
26	0
25	0
19	0
20	0
30	0
31	0
35	0
33	0
26	0
25	0
17	0
14	0
8	0
12	0
7	0
4	0
10	0
8	0
16	1
14	1
20	1
9	1
10	1


Summary of computational transaction
Raw Inputview raw input (R code)
Raw Outputview raw output of R engine
Computing time4 seconds
R Server'Gwilym Jenkins' @ 72.249.127.135

\begin{tabular}{lllllllll}
\hline
Summary of computational transaction \tabularnewline
Raw Input & view raw input (R code)  \tabularnewline
Raw Output & view raw output of R engine  \tabularnewline
Computing time & 4 seconds \tabularnewline
R Server & 'Gwilym Jenkins' @ 72.249.127.135 \tabularnewline
\hline
\end{tabular}
%Source: https://freestatistics.org/blog/index.php?pk=30320&T=0

[TABLE]
[ROW][C]Summary of computational transaction[/C][/ROW]
[ROW][C]Raw Input[/C][C]view raw input (R code) [/C][/ROW]
[ROW][C]Raw Output[/C][C]view raw output of R engine [/C][/ROW]
[ROW][C]Computing time[/C][C]4 seconds[/C][/ROW]
[ROW][C]R Server[/C][C]'Gwilym Jenkins' @ 72.249.127.135[/C][/ROW]
[/TABLE]
Source: https://freestatistics.org/blog/index.php?pk=30320&T=0

Globally Unique Identifier (entire table): ba.freestatistics.org/blog/index.php?pk=30320&T=0

As an alternative you can also use a QR Code:  

The GUIDs for individual cells are displayed in the table below:

Summary of computational transaction
Raw Inputview raw input (R code)
Raw Outputview raw output of R engine
Computing time4 seconds
R Server'Gwilym Jenkins' @ 72.249.127.135


Multiple Linear Regression - Estimated Regression Equation
Val[t] = + 0.0399112517118016 -0.0077177040095967Spa[t] -0.125658446480324M1[t] -0.117542649072708M2[t] -0.123318718882366M3[t] -0.152247900720814M4[t] -0.16419813373815M5[t] -0.102058408263357M6[t] -0.123269886092209M7[t] + 0.0941071561269228M8[t] + 0.0636344334865551M9[t] + 0.0424229556577034M10[t] + 0.0304727226403677M11[t] + 0.00731961061157762t + e[t]

\begin{tabular}{lllllllll}
\hline
Multiple Linear Regression - Estimated Regression Equation \tabularnewline
Val[t] =  +  0.0399112517118016 -0.0077177040095967Spa[t] -0.125658446480324M1[t] -0.117542649072708M2[t] -0.123318718882366M3[t] -0.152247900720814M4[t] -0.16419813373815M5[t] -0.102058408263357M6[t] -0.123269886092209M7[t] +  0.0941071561269228M8[t] +  0.0636344334865551M9[t] +  0.0424229556577034M10[t] +  0.0304727226403677M11[t] +  0.00731961061157762t  + e[t] \tabularnewline
\hline
\end{tabular}
%Source: https://freestatistics.org/blog/index.php?pk=30320&T=1

[TABLE]
[ROW][C]Multiple Linear Regression - Estimated Regression Equation[/C][/ROW]
[ROW][C]Val[t] =  +  0.0399112517118016 -0.0077177040095967Spa[t] -0.125658446480324M1[t] -0.117542649072708M2[t] -0.123318718882366M3[t] -0.152247900720814M4[t] -0.16419813373815M5[t] -0.102058408263357M6[t] -0.123269886092209M7[t] +  0.0941071561269228M8[t] +  0.0636344334865551M9[t] +  0.0424229556577034M10[t] +  0.0304727226403677M11[t] +  0.00731961061157762t  + e[t][/C][/ROW]
[/TABLE]
Source: https://freestatistics.org/blog/index.php?pk=30320&T=1

Globally Unique Identifier (entire table): ba.freestatistics.org/blog/index.php?pk=30320&T=1

As an alternative you can also use a QR Code:  

The GUIDs for individual cells are displayed in the table below:

Multiple Linear Regression - Estimated Regression Equation
Val[t] = + 0.0399112517118016 -0.0077177040095967Spa[t] -0.125658446480324M1[t] -0.117542649072708M2[t] -0.123318718882366M3[t] -0.152247900720814M4[t] -0.16419813373815M5[t] -0.102058408263357M6[t] -0.123269886092209M7[t] + 0.0941071561269228M8[t] + 0.0636344334865551M9[t] + 0.0424229556577034M10[t] + 0.0304727226403677M11[t] + 0.00731961061157762t + e[t]


Multiple Linear Regression - Ordinary Least Squares
VariableParameterS.D.T-STATH0: parameter = 02-tail p-value1-tail p-value
(Intercept)0.03991125171180160.1435720.2780.7822670.391134
Spa-0.00771770400959670.004542-1.69920.0960330.048017
M1-0.1256584464803240.162373-0.77390.4429560.221478
M2-0.1175426490727080.162307-0.72420.4726090.236305
M3-0.1233187188823660.162121-0.76070.4507430.225371
M4-0.1522479007208140.161774-0.94110.3515630.175782
M5-0.164198133738150.161711-1.01540.3152360.157618
M6-0.1020584082633570.164747-0.61950.5386540.269327
M7-0.1232698860922090.16314-0.75560.4537380.226869
M80.09410715612692280.1658120.56760.5730980.286549
M90.06363443348655510.1630280.39030.6980960.349048
M100.04242295565770340.1618850.26210.7944490.397224
M110.03047272264036770.1615720.18860.8512340.425617
t0.007319610611577620.0019493.75620.0004840.000242

\begin{tabular}{lllllllll}
\hline
Multiple Linear Regression - Ordinary Least Squares \tabularnewline
Variable & Parameter & S.D. & T-STATH0: parameter = 0 & 2-tail p-value & 1-tail p-value \tabularnewline
(Intercept) & 0.0399112517118016 & 0.143572 & 0.278 & 0.782267 & 0.391134 \tabularnewline
Spa & -0.0077177040095967 & 0.004542 & -1.6992 & 0.096033 & 0.048017 \tabularnewline
M1 & -0.125658446480324 & 0.162373 & -0.7739 & 0.442956 & 0.221478 \tabularnewline
M2 & -0.117542649072708 & 0.162307 & -0.7242 & 0.472609 & 0.236305 \tabularnewline
M3 & -0.123318718882366 & 0.162121 & -0.7607 & 0.450743 & 0.225371 \tabularnewline
M4 & -0.152247900720814 & 0.161774 & -0.9411 & 0.351563 & 0.175782 \tabularnewline
M5 & -0.16419813373815 & 0.161711 & -1.0154 & 0.315236 & 0.157618 \tabularnewline
M6 & -0.102058408263357 & 0.164747 & -0.6195 & 0.538654 & 0.269327 \tabularnewline
M7 & -0.123269886092209 & 0.16314 & -0.7556 & 0.453738 & 0.226869 \tabularnewline
M8 & 0.0941071561269228 & 0.165812 & 0.5676 & 0.573098 & 0.286549 \tabularnewline
M9 & 0.0636344334865551 & 0.163028 & 0.3903 & 0.698096 & 0.349048 \tabularnewline
M10 & 0.0424229556577034 & 0.161885 & 0.2621 & 0.794449 & 0.397224 \tabularnewline
M11 & 0.0304727226403677 & 0.161572 & 0.1886 & 0.851234 & 0.425617 \tabularnewline
t & 0.00731961061157762 & 0.001949 & 3.7562 & 0.000484 & 0.000242 \tabularnewline
\hline
\end{tabular}
%Source: https://freestatistics.org/blog/index.php?pk=30320&T=2

[TABLE]
[ROW][C]Multiple Linear Regression - Ordinary Least Squares[/C][/ROW]
[ROW][C]Variable[/C][C]Parameter[/C][C]S.D.[/C][C]T-STATH0: parameter = 0[/C][C]2-tail p-value[/C][C]1-tail p-value[/C][/ROW]
[ROW][C](Intercept)[/C][C]0.0399112517118016[/C][C]0.143572[/C][C]0.278[/C][C]0.782267[/C][C]0.391134[/C][/ROW]
[ROW][C]Spa[/C][C]-0.0077177040095967[/C][C]0.004542[/C][C]-1.6992[/C][C]0.096033[/C][C]0.048017[/C][/ROW]
[ROW][C]M1[/C][C]-0.125658446480324[/C][C]0.162373[/C][C]-0.7739[/C][C]0.442956[/C][C]0.221478[/C][/ROW]
[ROW][C]M2[/C][C]-0.117542649072708[/C][C]0.162307[/C][C]-0.7242[/C][C]0.472609[/C][C]0.236305[/C][/ROW]
[ROW][C]M3[/C][C]-0.123318718882366[/C][C]0.162121[/C][C]-0.7607[/C][C]0.450743[/C][C]0.225371[/C][/ROW]
[ROW][C]M4[/C][C]-0.152247900720814[/C][C]0.161774[/C][C]-0.9411[/C][C]0.351563[/C][C]0.175782[/C][/ROW]
[ROW][C]M5[/C][C]-0.16419813373815[/C][C]0.161711[/C][C]-1.0154[/C][C]0.315236[/C][C]0.157618[/C][/ROW]
[ROW][C]M6[/C][C]-0.102058408263357[/C][C]0.164747[/C][C]-0.6195[/C][C]0.538654[/C][C]0.269327[/C][/ROW]
[ROW][C]M7[/C][C]-0.123269886092209[/C][C]0.16314[/C][C]-0.7556[/C][C]0.453738[/C][C]0.226869[/C][/ROW]
[ROW][C]M8[/C][C]0.0941071561269228[/C][C]0.165812[/C][C]0.5676[/C][C]0.573098[/C][C]0.286549[/C][/ROW]
[ROW][C]M9[/C][C]0.0636344334865551[/C][C]0.163028[/C][C]0.3903[/C][C]0.698096[/C][C]0.349048[/C][/ROW]
[ROW][C]M10[/C][C]0.0424229556577034[/C][C]0.161885[/C][C]0.2621[/C][C]0.794449[/C][C]0.397224[/C][/ROW]
[ROW][C]M11[/C][C]0.0304727226403677[/C][C]0.161572[/C][C]0.1886[/C][C]0.851234[/C][C]0.425617[/C][/ROW]
[ROW][C]t[/C][C]0.00731961061157762[/C][C]0.001949[/C][C]3.7562[/C][C]0.000484[/C][C]0.000242[/C][/ROW]
[/TABLE]
Source: https://freestatistics.org/blog/index.php?pk=30320&T=2

Globally Unique Identifier (entire table): ba.freestatistics.org/blog/index.php?pk=30320&T=2

As an alternative you can also use a QR Code:  

The GUIDs for individual cells are displayed in the table below:

Multiple Linear Regression - Ordinary Least Squares
VariableParameterS.D.T-STATH0: parameter = 02-tail p-value1-tail p-value
(Intercept)0.03991125171180160.1435720.2780.7822670.391134
Spa-0.00771770400959670.004542-1.69920.0960330.048017
M1-0.1256584464803240.162373-0.77390.4429560.221478
M2-0.1175426490727080.162307-0.72420.4726090.236305
M3-0.1233187188823660.162121-0.76070.4507430.225371
M4-0.1522479007208140.161774-0.94110.3515630.175782
M5-0.164198133738150.161711-1.01540.3152360.157618
M6-0.1020584082633570.164747-0.61950.5386540.269327
M7-0.1232698860922090.16314-0.75560.4537380.226869
M80.09410715612692280.1658120.56760.5730980.286549
M90.06363443348655510.1630280.39030.6980960.349048
M100.04242295565770340.1618850.26210.7944490.397224
M110.03047272264036770.1615720.18860.8512340.425617
t0.007319610611577620.0019493.75620.0004840.000242


Multiple Linear Regression - Regression Statistics
Multiple R0.591520511071267
R-squared0.349896515018013
Adjusted R-squared0.166171617088321
F-TEST (value)1.90445888913713
F-TEST (DF numerator)13
F-TEST (DF denominator)46
p-value0.054827258663043
Multiple Linear Regression - Residual Statistics
Residual Standard Deviation0.254508946320681
Sum Squared Residuals2.97964097283411

\begin{tabular}{lllllllll}
\hline
Multiple Linear Regression - Regression Statistics \tabularnewline
Multiple R & 0.591520511071267 \tabularnewline
R-squared & 0.349896515018013 \tabularnewline
Adjusted R-squared & 0.166171617088321 \tabularnewline
F-TEST (value) & 1.90445888913713 \tabularnewline
F-TEST (DF numerator) & 13 \tabularnewline
F-TEST (DF denominator) & 46 \tabularnewline
p-value & 0.054827258663043 \tabularnewline
Multiple Linear Regression - Residual Statistics \tabularnewline
Residual Standard Deviation & 0.254508946320681 \tabularnewline
Sum Squared Residuals & 2.97964097283411 \tabularnewline
\hline
\end{tabular}
%Source: https://freestatistics.org/blog/index.php?pk=30320&T=3

[TABLE]
[ROW][C]Multiple Linear Regression - Regression Statistics[/C][/ROW]
[ROW][C]Multiple R[/C][C]0.591520511071267[/C][/ROW]
[ROW][C]R-squared[/C][C]0.349896515018013[/C][/ROW]
[ROW][C]Adjusted R-squared[/C][C]0.166171617088321[/C][/ROW]
[ROW][C]F-TEST (value)[/C][C]1.90445888913713[/C][/ROW]
[ROW][C]F-TEST (DF numerator)[/C][C]13[/C][/ROW]
[ROW][C]F-TEST (DF denominator)[/C][C]46[/C][/ROW]
[ROW][C]p-value[/C][C]0.054827258663043[/C][/ROW]
[ROW][C]Multiple Linear Regression - Residual Statistics[/C][/ROW]
[ROW][C]Residual Standard Deviation[/C][C]0.254508946320681[/C][/ROW]
[ROW][C]Sum Squared Residuals[/C][C]2.97964097283411[/C][/ROW]
[/TABLE]
Source: https://freestatistics.org/blog/index.php?pk=30320&T=3

Globally Unique Identifier (entire table): ba.freestatistics.org/blog/index.php?pk=30320&T=3

As an alternative you can also use a QR Code:  

The GUIDs for individual cells are displayed in the table below:

Multiple Linear Regression - Regression Statistics
Multiple R0.591520511071267
R-squared0.349896515018013
Adjusted R-squared0.166171617088321
F-TEST (value)1.90445888913713
F-TEST (DF numerator)13
F-TEST (DF denominator)46
p-value0.054827258663043
Multiple Linear Regression - Residual Statistics
Residual Standard Deviation0.254508946320681
Sum Squared Residuals2.97964097283411


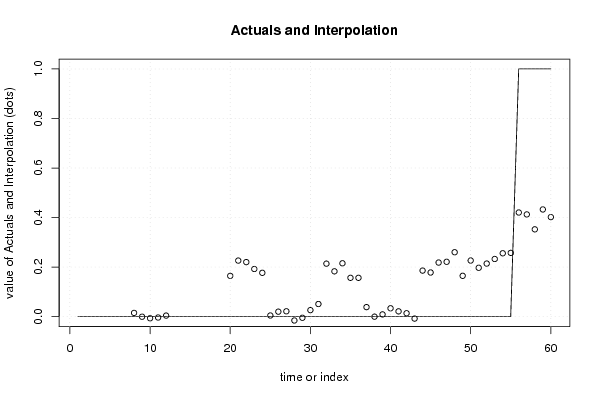
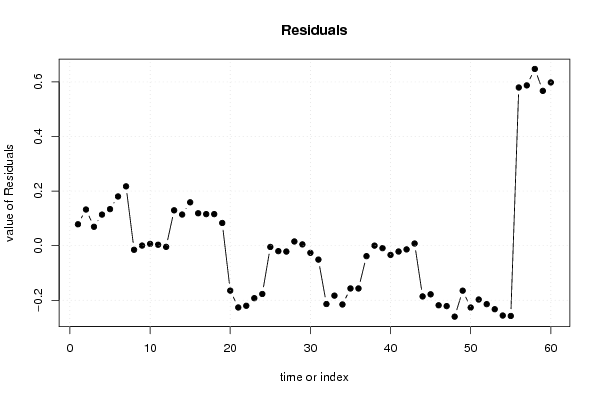
Multiple Linear Regression - Actuals, Interpolation, and Residuals
Time or IndexActualsInterpolationForecastResidualsPrediction Error
10-0.07842758415694410.0784275841569441
20-0.1324515122241210.132451512224121
30-0.06916633934542830.0691663393454283
40-0.1139290226010890.113929022601089
50-0.1339950530260410.133995053026041
60-0.1803012770836210.180301277083621
70-0.2173462563296850.217346256329685
800.0150681005106211-0.0150681005106211
90-0.0003673075085724540.000367307508572454
100-0.006541470716249670.00654147071624967
110-0.003454389112410790.00345438911241079
1200.00426331489718572-0.00426331489718572
130-0.1295109289907540.129510928990754
140-0.1140755209715610.114075520971561
150-0.1588382042272210.158838204227221
160-0.1187061433773180.118706143377318
170-0.1156190617734800.115619061773480
180-0.1156190617734790.115619061773479
190-0.08320470493317330.0832047049331733
2000.164645059926326-0.164645059926326
2100.2263866920031-0.2263866920031
2200.220212528795422-0.220212528795422
2300.192428794360874-0.192428794360874
2400.176993386341681-0.176993386341681
2500.00463062240575796-0.00463062240575796
2600.0200660304249515-0.0200660304249515
2700.0216095712268708-0.0216095712268708
280-0.01543540801919330.0154354080191933
290-0.004630622405758110.00463062240575811
3000.0262401936326288-0.0262401936326288
3100.0509368464633383-0.0509368464633383
3200.213891867217274-0.213891867217274
3300.183021051178887-0.183021051178887
3400.215435408019193-0.215435408019193
3500.156780857546258-0.156780857546258
3600.156780857546258-0.156780857546258
3700.0384420216775124-0.0384420216775124
380-0.0001464983704709960.000146498370470996
3900.00911474644104501-0.00911474644104501
4000.0338113992717546-0.0338113992717546
4100.0214630728563997-0.0214630728563997
4200.0137453688468031-0.0137453688468031
430-0.00786420238006770.0078642023800677
4400.185961634412255-0.185961634412255
4500.178243930402658-0.178243930402658
4600.218375991252561-0.218375991252561
4700.221463072856400-0.221463072856400
4800.260051592904383-0.260051592904383
4900.164865869064427-0.164865869064427
5000.226607501141201-0.226607501141201
5100.197280225904734-0.197280225904734
5200.214259174725847-0.214259174725847
5300.232781664348878-0.232781664348878
5400.255934776377669-0.255934776377669
5500.257478317179588-0.257478317179588
5610.4204333379335230.579566662066477
5710.4127156339239270.587284366076073
5810.3525175426490730.647482457350927
5910.4327816643488780.567218335651122
6010.4019108483104920.598089151689508

\begin{tabular}{lllllllll}
\hline
Multiple Linear Regression - Actuals, Interpolation, and Residuals \tabularnewline
Time or Index & Actuals & InterpolationForecast & ResidualsPrediction Error \tabularnewline
1 & 0 & -0.0784275841569441 & 0.0784275841569441 \tabularnewline
2 & 0 & -0.132451512224121 & 0.132451512224121 \tabularnewline
3 & 0 & -0.0691663393454283 & 0.0691663393454283 \tabularnewline
4 & 0 & -0.113929022601089 & 0.113929022601089 \tabularnewline
5 & 0 & -0.133995053026041 & 0.133995053026041 \tabularnewline
6 & 0 & -0.180301277083621 & 0.180301277083621 \tabularnewline
7 & 0 & -0.217346256329685 & 0.217346256329685 \tabularnewline
8 & 0 & 0.0150681005106211 & -0.0150681005106211 \tabularnewline
9 & 0 & -0.000367307508572454 & 0.000367307508572454 \tabularnewline
10 & 0 & -0.00654147071624967 & 0.00654147071624967 \tabularnewline
11 & 0 & -0.00345438911241079 & 0.00345438911241079 \tabularnewline
12 & 0 & 0.00426331489718572 & -0.00426331489718572 \tabularnewline
13 & 0 & -0.129510928990754 & 0.129510928990754 \tabularnewline
14 & 0 & -0.114075520971561 & 0.114075520971561 \tabularnewline
15 & 0 & -0.158838204227221 & 0.158838204227221 \tabularnewline
16 & 0 & -0.118706143377318 & 0.118706143377318 \tabularnewline
17 & 0 & -0.115619061773480 & 0.115619061773480 \tabularnewline
18 & 0 & -0.115619061773479 & 0.115619061773479 \tabularnewline
19 & 0 & -0.0832047049331733 & 0.0832047049331733 \tabularnewline
20 & 0 & 0.164645059926326 & -0.164645059926326 \tabularnewline
21 & 0 & 0.2263866920031 & -0.2263866920031 \tabularnewline
22 & 0 & 0.220212528795422 & -0.220212528795422 \tabularnewline
23 & 0 & 0.192428794360874 & -0.192428794360874 \tabularnewline
24 & 0 & 0.176993386341681 & -0.176993386341681 \tabularnewline
25 & 0 & 0.00463062240575796 & -0.00463062240575796 \tabularnewline
26 & 0 & 0.0200660304249515 & -0.0200660304249515 \tabularnewline
27 & 0 & 0.0216095712268708 & -0.0216095712268708 \tabularnewline
28 & 0 & -0.0154354080191933 & 0.0154354080191933 \tabularnewline
29 & 0 & -0.00463062240575811 & 0.00463062240575811 \tabularnewline
30 & 0 & 0.0262401936326288 & -0.0262401936326288 \tabularnewline
31 & 0 & 0.0509368464633383 & -0.0509368464633383 \tabularnewline
32 & 0 & 0.213891867217274 & -0.213891867217274 \tabularnewline
33 & 0 & 0.183021051178887 & -0.183021051178887 \tabularnewline
34 & 0 & 0.215435408019193 & -0.215435408019193 \tabularnewline
35 & 0 & 0.156780857546258 & -0.156780857546258 \tabularnewline
36 & 0 & 0.156780857546258 & -0.156780857546258 \tabularnewline
37 & 0 & 0.0384420216775124 & -0.0384420216775124 \tabularnewline
38 & 0 & -0.000146498370470996 & 0.000146498370470996 \tabularnewline
39 & 0 & 0.00911474644104501 & -0.00911474644104501 \tabularnewline
40 & 0 & 0.0338113992717546 & -0.0338113992717546 \tabularnewline
41 & 0 & 0.0214630728563997 & -0.0214630728563997 \tabularnewline
42 & 0 & 0.0137453688468031 & -0.0137453688468031 \tabularnewline
43 & 0 & -0.0078642023800677 & 0.0078642023800677 \tabularnewline
44 & 0 & 0.185961634412255 & -0.185961634412255 \tabularnewline
45 & 0 & 0.178243930402658 & -0.178243930402658 \tabularnewline
46 & 0 & 0.218375991252561 & -0.218375991252561 \tabularnewline
47 & 0 & 0.221463072856400 & -0.221463072856400 \tabularnewline
48 & 0 & 0.260051592904383 & -0.260051592904383 \tabularnewline
49 & 0 & 0.164865869064427 & -0.164865869064427 \tabularnewline
50 & 0 & 0.226607501141201 & -0.226607501141201 \tabularnewline
51 & 0 & 0.197280225904734 & -0.197280225904734 \tabularnewline
52 & 0 & 0.214259174725847 & -0.214259174725847 \tabularnewline
53 & 0 & 0.232781664348878 & -0.232781664348878 \tabularnewline
54 & 0 & 0.255934776377669 & -0.255934776377669 \tabularnewline
55 & 0 & 0.257478317179588 & -0.257478317179588 \tabularnewline
56 & 1 & 0.420433337933523 & 0.579566662066477 \tabularnewline
57 & 1 & 0.412715633923927 & 0.587284366076073 \tabularnewline
58 & 1 & 0.352517542649073 & 0.647482457350927 \tabularnewline
59 & 1 & 0.432781664348878 & 0.567218335651122 \tabularnewline
60 & 1 & 0.401910848310492 & 0.598089151689508 \tabularnewline
\hline
\end{tabular}
%Source: https://freestatistics.org/blog/index.php?pk=30320&T=4

[TABLE]
[ROW][C]Multiple Linear Regression - Actuals, Interpolation, and Residuals[/C][/ROW]
[ROW][C]Time or Index[/C][C]Actuals[/C][C]InterpolationForecast[/C][C]ResidualsPrediction Error[/C][/ROW]
[ROW][C]1[/C][C]0[/C][C]-0.0784275841569441[/C][C]0.0784275841569441[/C][/ROW]
[ROW][C]2[/C][C]0[/C][C]-0.132451512224121[/C][C]0.132451512224121[/C][/ROW]
[ROW][C]3[/C][C]0[/C][C]-0.0691663393454283[/C][C]0.0691663393454283[/C][/ROW]
[ROW][C]4[/C][C]0[/C][C]-0.113929022601089[/C][C]0.113929022601089[/C][/ROW]
[ROW][C]5[/C][C]0[/C][C]-0.133995053026041[/C][C]0.133995053026041[/C][/ROW]
[ROW][C]6[/C][C]0[/C][C]-0.180301277083621[/C][C]0.180301277083621[/C][/ROW]
[ROW][C]7[/C][C]0[/C][C]-0.217346256329685[/C][C]0.217346256329685[/C][/ROW]
[ROW][C]8[/C][C]0[/C][C]0.0150681005106211[/C][C]-0.0150681005106211[/C][/ROW]
[ROW][C]9[/C][C]0[/C][C]-0.000367307508572454[/C][C]0.000367307508572454[/C][/ROW]
[ROW][C]10[/C][C]0[/C][C]-0.00654147071624967[/C][C]0.00654147071624967[/C][/ROW]
[ROW][C]11[/C][C]0[/C][C]-0.00345438911241079[/C][C]0.00345438911241079[/C][/ROW]
[ROW][C]12[/C][C]0[/C][C]0.00426331489718572[/C][C]-0.00426331489718572[/C][/ROW]
[ROW][C]13[/C][C]0[/C][C]-0.129510928990754[/C][C]0.129510928990754[/C][/ROW]
[ROW][C]14[/C][C]0[/C][C]-0.114075520971561[/C][C]0.114075520971561[/C][/ROW]
[ROW][C]15[/C][C]0[/C][C]-0.158838204227221[/C][C]0.158838204227221[/C][/ROW]
[ROW][C]16[/C][C]0[/C][C]-0.118706143377318[/C][C]0.118706143377318[/C][/ROW]
[ROW][C]17[/C][C]0[/C][C]-0.115619061773480[/C][C]0.115619061773480[/C][/ROW]
[ROW][C]18[/C][C]0[/C][C]-0.115619061773479[/C][C]0.115619061773479[/C][/ROW]
[ROW][C]19[/C][C]0[/C][C]-0.0832047049331733[/C][C]0.0832047049331733[/C][/ROW]
[ROW][C]20[/C][C]0[/C][C]0.164645059926326[/C][C]-0.164645059926326[/C][/ROW]
[ROW][C]21[/C][C]0[/C][C]0.2263866920031[/C][C]-0.2263866920031[/C][/ROW]
[ROW][C]22[/C][C]0[/C][C]0.220212528795422[/C][C]-0.220212528795422[/C][/ROW]
[ROW][C]23[/C][C]0[/C][C]0.192428794360874[/C][C]-0.192428794360874[/C][/ROW]
[ROW][C]24[/C][C]0[/C][C]0.176993386341681[/C][C]-0.176993386341681[/C][/ROW]
[ROW][C]25[/C][C]0[/C][C]0.00463062240575796[/C][C]-0.00463062240575796[/C][/ROW]
[ROW][C]26[/C][C]0[/C][C]0.0200660304249515[/C][C]-0.0200660304249515[/C][/ROW]
[ROW][C]27[/C][C]0[/C][C]0.0216095712268708[/C][C]-0.0216095712268708[/C][/ROW]
[ROW][C]28[/C][C]0[/C][C]-0.0154354080191933[/C][C]0.0154354080191933[/C][/ROW]
[ROW][C]29[/C][C]0[/C][C]-0.00463062240575811[/C][C]0.00463062240575811[/C][/ROW]
[ROW][C]30[/C][C]0[/C][C]0.0262401936326288[/C][C]-0.0262401936326288[/C][/ROW]
[ROW][C]31[/C][C]0[/C][C]0.0509368464633383[/C][C]-0.0509368464633383[/C][/ROW]
[ROW][C]32[/C][C]0[/C][C]0.213891867217274[/C][C]-0.213891867217274[/C][/ROW]
[ROW][C]33[/C][C]0[/C][C]0.183021051178887[/C][C]-0.183021051178887[/C][/ROW]
[ROW][C]34[/C][C]0[/C][C]0.215435408019193[/C][C]-0.215435408019193[/C][/ROW]
[ROW][C]35[/C][C]0[/C][C]0.156780857546258[/C][C]-0.156780857546258[/C][/ROW]
[ROW][C]36[/C][C]0[/C][C]0.156780857546258[/C][C]-0.156780857546258[/C][/ROW]
[ROW][C]37[/C][C]0[/C][C]0.0384420216775124[/C][C]-0.0384420216775124[/C][/ROW]
[ROW][C]38[/C][C]0[/C][C]-0.000146498370470996[/C][C]0.000146498370470996[/C][/ROW]
[ROW][C]39[/C][C]0[/C][C]0.00911474644104501[/C][C]-0.00911474644104501[/C][/ROW]
[ROW][C]40[/C][C]0[/C][C]0.0338113992717546[/C][C]-0.0338113992717546[/C][/ROW]
[ROW][C]41[/C][C]0[/C][C]0.0214630728563997[/C][C]-0.0214630728563997[/C][/ROW]
[ROW][C]42[/C][C]0[/C][C]0.0137453688468031[/C][C]-0.0137453688468031[/C][/ROW]
[ROW][C]43[/C][C]0[/C][C]-0.0078642023800677[/C][C]0.0078642023800677[/C][/ROW]
[ROW][C]44[/C][C]0[/C][C]0.185961634412255[/C][C]-0.185961634412255[/C][/ROW]
[ROW][C]45[/C][C]0[/C][C]0.178243930402658[/C][C]-0.178243930402658[/C][/ROW]
[ROW][C]46[/C][C]0[/C][C]0.218375991252561[/C][C]-0.218375991252561[/C][/ROW]
[ROW][C]47[/C][C]0[/C][C]0.221463072856400[/C][C]-0.221463072856400[/C][/ROW]
[ROW][C]48[/C][C]0[/C][C]0.260051592904383[/C][C]-0.260051592904383[/C][/ROW]
[ROW][C]49[/C][C]0[/C][C]0.164865869064427[/C][C]-0.164865869064427[/C][/ROW]
[ROW][C]50[/C][C]0[/C][C]0.226607501141201[/C][C]-0.226607501141201[/C][/ROW]
[ROW][C]51[/C][C]0[/C][C]0.197280225904734[/C][C]-0.197280225904734[/C][/ROW]
[ROW][C]52[/C][C]0[/C][C]0.214259174725847[/C][C]-0.214259174725847[/C][/ROW]
[ROW][C]53[/C][C]0[/C][C]0.232781664348878[/C][C]-0.232781664348878[/C][/ROW]
[ROW][C]54[/C][C]0[/C][C]0.255934776377669[/C][C]-0.255934776377669[/C][/ROW]
[ROW][C]55[/C][C]0[/C][C]0.257478317179588[/C][C]-0.257478317179588[/C][/ROW]
[ROW][C]56[/C][C]1[/C][C]0.420433337933523[/C][C]0.579566662066477[/C][/ROW]
[ROW][C]57[/C][C]1[/C][C]0.412715633923927[/C][C]0.587284366076073[/C][/ROW]
[ROW][C]58[/C][C]1[/C][C]0.352517542649073[/C][C]0.647482457350927[/C][/ROW]
[ROW][C]59[/C][C]1[/C][C]0.432781664348878[/C][C]0.567218335651122[/C][/ROW]
[ROW][C]60[/C][C]1[/C][C]0.401910848310492[/C][C]0.598089151689508[/C][/ROW]
[/TABLE]
Source: https://freestatistics.org/blog/index.php?pk=30320&T=4

Globally Unique Identifier (entire table): ba.freestatistics.org/blog/index.php?pk=30320&T=4

As an alternative you can also use a QR Code:  

The GUIDs for individual cells are displayed in the table below:

Multiple Linear Regression - Actuals, Interpolation, and Residuals
Time or IndexActualsInterpolationForecastResidualsPrediction Error
10-0.07842758415694410.0784275841569441
20-0.1324515122241210.132451512224121
30-0.06916633934542830.0691663393454283
40-0.1139290226010890.113929022601089
50-0.1339950530260410.133995053026041
60-0.1803012770836210.180301277083621
70-0.2173462563296850.217346256329685
800.0150681005106211-0.0150681005106211
90-0.0003673075085724540.000367307508572454
100-0.006541470716249670.00654147071624967
110-0.003454389112410790.00345438911241079
1200.00426331489718572-0.00426331489718572
130-0.1295109289907540.129510928990754
140-0.1140755209715610.114075520971561
150-0.1588382042272210.158838204227221
160-0.1187061433773180.118706143377318
170-0.1156190617734800.115619061773480
180-0.1156190617734790.115619061773479
190-0.08320470493317330.0832047049331733
2000.164645059926326-0.164645059926326
2100.2263866920031-0.2263866920031
2200.220212528795422-0.220212528795422
2300.192428794360874-0.192428794360874
2400.176993386341681-0.176993386341681
2500.00463062240575796-0.00463062240575796
2600.0200660304249515-0.0200660304249515
2700.0216095712268708-0.0216095712268708
280-0.01543540801919330.0154354080191933
290-0.004630622405758110.00463062240575811
3000.0262401936326288-0.0262401936326288
3100.0509368464633383-0.0509368464633383
3200.213891867217274-0.213891867217274
3300.183021051178887-0.183021051178887
3400.215435408019193-0.215435408019193
3500.156780857546258-0.156780857546258
3600.156780857546258-0.156780857546258
3700.0384420216775124-0.0384420216775124
380-0.0001464983704709960.000146498370470996
3900.00911474644104501-0.00911474644104501
4000.0338113992717546-0.0338113992717546
4100.0214630728563997-0.0214630728563997
4200.0137453688468031-0.0137453688468031
430-0.00786420238006770.0078642023800677
4400.185961634412255-0.185961634412255
4500.178243930402658-0.178243930402658
4600.218375991252561-0.218375991252561
4700.221463072856400-0.221463072856400
4800.260051592904383-0.260051592904383
4900.164865869064427-0.164865869064427
5000.226607501141201-0.226607501141201
5100.197280225904734-0.197280225904734
5200.214259174725847-0.214259174725847
5300.232781664348878-0.232781664348878
5400.255934776377669-0.255934776377669
5500.257478317179588-0.257478317179588
5610.4204333379335230.579566662066477
5710.4127156339239270.587284366076073
5810.3525175426490730.647482457350927
5910.4327816643488780.567218335651122
6010.4019108483104920.598089151689508


Goldfeld-Quandt test for Heteroskedasticity
p-valuesAlternative Hypothesis
breakpoint indexgreater2-sidedless
17001
18001
19001
20001
21001
22001
23001
24001
25001
26001
27001
28001
29001
30001
31001
32001
33001
34001
35001
36001
37001
38001
39001
40001
41001
42001
43001

\begin{tabular}{lllllllll}
\hline
Goldfeld-Quandt test for Heteroskedasticity \tabularnewline
p-values & Alternative Hypothesis \tabularnewline
breakpoint index & greater & 2-sided & less \tabularnewline
17 & 0 & 0 & 1 \tabularnewline
18 & 0 & 0 & 1 \tabularnewline
19 & 0 & 0 & 1 \tabularnewline
20 & 0 & 0 & 1 \tabularnewline
21 & 0 & 0 & 1 \tabularnewline
22 & 0 & 0 & 1 \tabularnewline
23 & 0 & 0 & 1 \tabularnewline
24 & 0 & 0 & 1 \tabularnewline
25 & 0 & 0 & 1 \tabularnewline
26 & 0 & 0 & 1 \tabularnewline
27 & 0 & 0 & 1 \tabularnewline
28 & 0 & 0 & 1 \tabularnewline
29 & 0 & 0 & 1 \tabularnewline
30 & 0 & 0 & 1 \tabularnewline
31 & 0 & 0 & 1 \tabularnewline
32 & 0 & 0 & 1 \tabularnewline
33 & 0 & 0 & 1 \tabularnewline
34 & 0 & 0 & 1 \tabularnewline
35 & 0 & 0 & 1 \tabularnewline
36 & 0 & 0 & 1 \tabularnewline
37 & 0 & 0 & 1 \tabularnewline
38 & 0 & 0 & 1 \tabularnewline
39 & 0 & 0 & 1 \tabularnewline
40 & 0 & 0 & 1 \tabularnewline
41 & 0 & 0 & 1 \tabularnewline
42 & 0 & 0 & 1 \tabularnewline
43 & 0 & 0 & 1 \tabularnewline
\hline
\end{tabular}
%Source: https://freestatistics.org/blog/index.php?pk=30320&T=5

[TABLE]
[ROW][C]Goldfeld-Quandt test for Heteroskedasticity[/C][/ROW]
[ROW][C]p-values[/C][C]Alternative Hypothesis[/C][/ROW]
[ROW][C]breakpoint index[/C][C]greater[/C][C]2-sided[/C][C]less[/C][/ROW]
[ROW][C]17[/C][C]0[/C][C]0[/C][C]1[/C][/ROW]
[ROW][C]18[/C][C]0[/C][C]0[/C][C]1[/C][/ROW]
[ROW][C]19[/C][C]0[/C][C]0[/C][C]1[/C][/ROW]
[ROW][C]20[/C][C]0[/C][C]0[/C][C]1[/C][/ROW]
[ROW][C]21[/C][C]0[/C][C]0[/C][C]1[/C][/ROW]
[ROW][C]22[/C][C]0[/C][C]0[/C][C]1[/C][/ROW]
[ROW][C]23[/C][C]0[/C][C]0[/C][C]1[/C][/ROW]
[ROW][C]24[/C][C]0[/C][C]0[/C][C]1[/C][/ROW]
[ROW][C]25[/C][C]0[/C][C]0[/C][C]1[/C][/ROW]
[ROW][C]26[/C][C]0[/C][C]0[/C][C]1[/C][/ROW]
[ROW][C]27[/C][C]0[/C][C]0[/C][C]1[/C][/ROW]
[ROW][C]28[/C][C]0[/C][C]0[/C][C]1[/C][/ROW]
[ROW][C]29[/C][C]0[/C][C]0[/C][C]1[/C][/ROW]
[ROW][C]30[/C][C]0[/C][C]0[/C][C]1[/C][/ROW]
[ROW][C]31[/C][C]0[/C][C]0[/C][C]1[/C][/ROW]
[ROW][C]32[/C][C]0[/C][C]0[/C][C]1[/C][/ROW]
[ROW][C]33[/C][C]0[/C][C]0[/C][C]1[/C][/ROW]
[ROW][C]34[/C][C]0[/C][C]0[/C][C]1[/C][/ROW]
[ROW][C]35[/C][C]0[/C][C]0[/C][C]1[/C][/ROW]
[ROW][C]36[/C][C]0[/C][C]0[/C][C]1[/C][/ROW]
[ROW][C]37[/C][C]0[/C][C]0[/C][C]1[/C][/ROW]
[ROW][C]38[/C][C]0[/C][C]0[/C][C]1[/C][/ROW]
[ROW][C]39[/C][C]0[/C][C]0[/C][C]1[/C][/ROW]
[ROW][C]40[/C][C]0[/C][C]0[/C][C]1[/C][/ROW]
[ROW][C]41[/C][C]0[/C][C]0[/C][C]1[/C][/ROW]
[ROW][C]42[/C][C]0[/C][C]0[/C][C]1[/C][/ROW]
[ROW][C]43[/C][C]0[/C][C]0[/C][C]1[/C][/ROW]
[/TABLE]
Source: https://freestatistics.org/blog/index.php?pk=30320&T=5

Globally Unique Identifier (entire table): ba.freestatistics.org/blog/index.php?pk=30320&T=5

As an alternative you can also use a QR Code:  

The GUIDs for individual cells are displayed in the table below:

Goldfeld-Quandt test for Heteroskedasticity
p-valuesAlternative Hypothesis
breakpoint indexgreater2-sidedless
17001
18001
19001
20001
21001
22001
23001
24001
25001
26001
27001
28001
29001
30001
31001
32001
33001
34001
35001
36001
37001
38001
39001
40001
41001
42001
43001


Meta Analysis of Goldfeld-Quandt test for Heteroskedasticity
Description# significant tests% significant testsOK/NOK
1% type I error level271NOK
5% type I error level271NOK
10% type I error level271NOK

\begin{tabular}{lllllllll}
\hline
Meta Analysis of Goldfeld-Quandt test for Heteroskedasticity \tabularnewline
Description & # significant tests & % significant tests & OK/NOK \tabularnewline
1% type I error level & 27 & 1 & NOK \tabularnewline
5% type I error level & 27 & 1 & NOK \tabularnewline
10% type I error level & 27 & 1 & NOK \tabularnewline
\hline
\end{tabular}
%Source: https://freestatistics.org/blog/index.php?pk=30320&T=6

[TABLE]
[ROW][C]Meta Analysis of Goldfeld-Quandt test for Heteroskedasticity[/C][/ROW]
[ROW][C]Description[/C][C]# significant tests[/C][C]% significant tests[/C][C]OK/NOK[/C][/ROW]
[ROW][C]1% type I error level[/C][C]27[/C][C]1[/C][C]NOK[/C][/ROW]
[ROW][C]5% type I error level[/C][C]27[/C][C]1[/C][C]NOK[/C][/ROW]
[ROW][C]10% type I error level[/C][C]27[/C][C]1[/C][C]NOK[/C][/ROW]
[/TABLE]
Source: https://freestatistics.org/blog/index.php?pk=30320&T=6

Globally Unique Identifier (entire table): ba.freestatistics.org/blog/index.php?pk=30320&T=6

As an alternative you can also use a QR Code:  

The GUIDs for individual cells are displayed in the table below:

Meta Analysis of Goldfeld-Quandt test for Heteroskedasticity
Description# significant tests% significant testsOK/NOK
1% type I error level271NOK
5% type I error level271NOK
10% type I error level271NOK


Parameters (Session):
par1 = 2 ; par2 = Include Monthly Dummies ; par3 = Linear Trend ;
Parameters (R input):
par1 = 2 ; par2 = Include Monthly Dummies ; par3 = Linear Trend ;
R code (references can be found in the software module):
library(lattice)
library(lmtest)
n25 <- 25 #minimum number of obs. for Goldfeld-Quandt test
par1 <- as.numeric(par1)
x <- t(y)
k <- length(x[1,])
n <- length(x[,1])
x1 <- cbind(x[,par1], x[,1:k!=par1])
mycolnames <- c(colnames(x)[par1], colnames(x)[1:k!=par1])
colnames(x1) <- mycolnames #colnames(x)[par1]
x <- x1
if (par3 == 'First Differences'){
x2 <- array(0, dim=c(n-1,k), dimnames=list(1:(n-1), paste('(1-B)',colnames(x),sep='')))
for (i in 1:n-1) {
for (j in 1:k) {
x2[i,j] <- x[i+1,j] - x[i,j]
}
}
x <- x2
}
if (par2 == 'Include Monthly Dummies'){
x2 <- array(0, dim=c(n,11), dimnames=list(1:n, paste('M', seq(1:11), sep ='')))
for (i in 1:11){
x2[seq(i,n,12),i] <- 1
}
x <- cbind(x, x2)
}
if (par2 == 'Include Quarterly Dummies'){
x2 <- array(0, dim=c(n,3), dimnames=list(1:n, paste('Q', seq(1:3), sep ='')))
for (i in 1:3){
x2[seq(i,n,4),i] <- 1
}
x <- cbind(x, x2)
}
k <- length(x[1,])
if (par3 == 'Linear Trend'){
x <- cbind(x, c(1:n))
colnames(x)[k+1] <- 't'
}
x
k <- length(x[1,])
df <- as.data.frame(x)
(mylm <- lm(df))
(mysum <- summary(mylm))
if (n > n25) {
kp3 <- k + 3
nmkm3 <- n - k - 3
gqarr <- array(NA, dim=c(nmkm3-kp3+1,3))
numgqtests <- 0
numsignificant1 <- 0
numsignificant5 <- 0
numsignificant10 <- 0
for (mypoint in kp3:nmkm3) {
j <- 0
numgqtests <- numgqtests + 1
for (myalt in c('greater', 'two.sided', 'less')) {
j <- j + 1
gqarr[mypoint-kp3+1,j] <- gqtest(mylm, point=mypoint, alternative=myalt)$p.value
}
if (gqarr[mypoint-kp3+1,2] < 0.01) numsignificant1 <- numsignificant1 + 1
if (gqarr[mypoint-kp3+1,2] < 0.05) numsignificant5 <- numsignificant5 + 1
if (gqarr[mypoint-kp3+1,2] < 0.10) numsignificant10 <- numsignificant10 + 1
}
gqarr
}
bitmap(file='test0.png')
plot(x[,1], type='l', main='Actuals and Interpolation', ylab='value of Actuals and Interpolation (dots)', xlab='time or index')
points(x[,1]-mysum$resid)
grid()
dev.off()
bitmap(file='test1.png')
plot(mysum$resid, type='b', pch=19, main='Residuals', ylab='value of Residuals', xlab='time or index')
grid()
dev.off()
bitmap(file='test2.png')
hist(mysum$resid, main='Residual Histogram', xlab='values of Residuals')
grid()
dev.off()
bitmap(file='test3.png')
densityplot(~mysum$resid,col='black',main='Residual Density Plot', xlab='values of Residuals')
dev.off()
bitmap(file='test4.png')
qqnorm(mysum$resid, main='Residual Normal Q-Q Plot')
qqline(mysum$resid)
grid()
dev.off()
(myerror <- as.ts(mysum$resid))
bitmap(file='test5.png')
dum <- cbind(lag(myerror,k=1),myerror)
dum
dum1 <- dum[2:length(myerror),]
dum1
z <- as.data.frame(dum1)
z
plot(z,main=paste('Residual Lag plot, lowess, and regression line'), ylab='values of Residuals', xlab='lagged values of Residuals')
lines(lowess(z))
abline(lm(z))
grid()
dev.off()
bitmap(file='test6.png')
acf(mysum$resid, lag.max=length(mysum$resid)/2, main='Residual Autocorrelation Function')
grid()
dev.off()
bitmap(file='test7.png')
pacf(mysum$resid, lag.max=length(mysum$resid)/2, main='Residual Partial Autocorrelation Function')
grid()
dev.off()
bitmap(file='test8.png')
opar <- par(mfrow = c(2,2), oma = c(0, 0, 1.1, 0))
plot(mylm, las = 1, sub='Residual Diagnostics')
par(opar)
dev.off()
if (n > n25) {
bitmap(file='test9.png')
plot(kp3:nmkm3,gqarr[,2], main='Goldfeld-Quandt test',ylab='2-sided p-value',xlab='breakpoint')
grid()
dev.off()
}
load(file='createtable')
a<-table.start()
a<-table.row.start(a)
a<-table.element(a, 'Multiple Linear Regression - Estimated Regression Equation', 1, TRUE)
a<-table.row.end(a)
myeq <- colnames(x)[1]
myeq <- paste(myeq, '[t] = ', sep='')
for (i in 1:k){
if (mysum$coefficients[i,1] > 0) myeq <- paste(myeq, '+', '')
myeq <- paste(myeq, mysum$coefficients[i,1], sep=' ')
if (rownames(mysum$coefficients)[i] != '(Intercept)') {
myeq <- paste(myeq, rownames(mysum$coefficients)[i], sep='')
if (rownames(mysum$coefficients)[i] != 't') myeq <- paste(myeq, '[t]', sep='')
}
}
myeq <- paste(myeq, ' + e[t]')
a<-table.row.start(a)
a<-table.element(a, myeq)
a<-table.row.end(a)
a<-table.end(a)
table.save(a,file='mytable1.tab')
a<-table.start()
a<-table.row.start(a)
a<-table.element(a,hyperlink('ols1.htm','Multiple Linear Regression - Ordinary Least Squares',''), 6, TRUE)
a<-table.row.end(a)
a<-table.row.start(a)
a<-table.element(a,'Variable',header=TRUE)
a<-table.element(a,'Parameter',header=TRUE)
a<-table.element(a,'S.D.',header=TRUE)
a<-table.element(a,'T-STAT
H0: parameter = 0',header=TRUE)
a<-table.element(a,'2-tail p-value',header=TRUE)
a<-table.element(a,'1-tail p-value',header=TRUE)
a<-table.row.end(a)
for (i in 1:k){
a<-table.row.start(a)
a<-table.element(a,rownames(mysum$coefficients)[i],header=TRUE)
a<-table.element(a,mysum$coefficients[i,1])
a<-table.element(a, round(mysum$coefficients[i,2],6))
a<-table.element(a, round(mysum$coefficients[i,3],4))
a<-table.element(a, round(mysum$coefficients[i,4],6))
a<-table.element(a, round(mysum$coefficients[i,4]/2,6))
a<-table.row.end(a)
}
a<-table.end(a)
table.save(a,file='mytable2.tab')
a<-table.start()
a<-table.row.start(a)
a<-table.element(a, 'Multiple Linear Regression - Regression Statistics', 2, TRUE)
a<-table.row.end(a)
a<-table.row.start(a)
a<-table.element(a, 'Multiple R',1,TRUE)
a<-table.element(a, sqrt(mysum$r.squared))
a<-table.row.end(a)
a<-table.row.start(a)
a<-table.element(a, 'R-squared',1,TRUE)
a<-table.element(a, mysum$r.squared)
a<-table.row.end(a)
a<-table.row.start(a)
a<-table.element(a, 'Adjusted R-squared',1,TRUE)
a<-table.element(a, mysum$adj.r.squared)
a<-table.row.end(a)
a<-table.row.start(a)
a<-table.element(a, 'F-TEST (value)',1,TRUE)
a<-table.element(a, mysum$fstatistic[1])
a<-table.row.end(a)
a<-table.row.start(a)
a<-table.element(a, 'F-TEST (DF numerator)',1,TRUE)
a<-table.element(a, mysum$fstatistic[2])
a<-table.row.end(a)
a<-table.row.start(a)
a<-table.element(a, 'F-TEST (DF denominator)',1,TRUE)
a<-table.element(a, mysum$fstatistic[3])
a<-table.row.end(a)
a<-table.row.start(a)
a<-table.element(a, 'p-value',1,TRUE)
a<-table.element(a, 1-pf(mysum$fstatistic[1],mysum$fstatistic[2],mysum$fstatistic[3]))
a<-table.row.end(a)
a<-table.row.start(a)
a<-table.element(a, 'Multiple Linear Regression - Residual Statistics', 2, TRUE)
a<-table.row.end(a)
a<-table.row.start(a)
a<-table.element(a, 'Residual Standard Deviation',1,TRUE)
a<-table.element(a, mysum$sigma)
a<-table.row.end(a)
a<-table.row.start(a)
a<-table.element(a, 'Sum Squared Residuals',1,TRUE)
a<-table.element(a, sum(myerror*myerror))
a<-table.row.end(a)
a<-table.end(a)
table.save(a,file='mytable3.tab')
a<-table.start()
a<-table.row.start(a)
a<-table.element(a, 'Multiple Linear Regression - Actuals, Interpolation, and Residuals', 4, TRUE)
a<-table.row.end(a)
a<-table.row.start(a)
a<-table.element(a, 'Time or Index', 1, TRUE)
a<-table.element(a, 'Actuals', 1, TRUE)
a<-table.element(a, 'Interpolation
Forecast', 1, TRUE)
a<-table.element(a, 'Residuals
Prediction Error', 1, TRUE)
a<-table.row.end(a)
for (i in 1:n) {
a<-table.row.start(a)
a<-table.element(a,i, 1, TRUE)
a<-table.element(a,x[i])
a<-table.element(a,x[i]-mysum$resid[i])
a<-table.element(a,mysum$resid[i])
a<-table.row.end(a)
}
a<-table.end(a)
table.save(a,file='mytable4.tab')
if (n > n25) {
a<-table.start()
a<-table.row.start(a)
a<-table.element(a,'Goldfeld-Quandt test for Heteroskedasticity',4,TRUE)
a<-table.row.end(a)
a<-table.row.start(a)
a<-table.element(a,'p-values',header=TRUE)
a<-table.element(a,'Alternative Hypothesis',3,header=TRUE)
a<-table.row.end(a)
a<-table.row.start(a)
a<-table.element(a,'breakpoint index',header=TRUE)
a<-table.element(a,'greater',header=TRUE)
a<-table.element(a,'2-sided',header=TRUE)
a<-table.element(a,'less',header=TRUE)
a<-table.row.end(a)
for (mypoint in kp3:nmkm3) {
a<-table.row.start(a)
a<-table.element(a,mypoint,header=TRUE)
a<-table.element(a,gqarr[mypoint-kp3+1,1])
a<-table.element(a,gqarr[mypoint-kp3+1,2])
a<-table.element(a,gqarr[mypoint-kp3+1,3])
a<-table.row.end(a)
}
a<-table.end(a)
table.save(a,file='mytable5.tab')
a<-table.start()
a<-table.row.start(a)
a<-table.element(a,'Meta Analysis of Goldfeld-Quandt test for Heteroskedasticity',4,TRUE)
a<-table.row.end(a)
a<-table.row.start(a)
a<-table.element(a,'Description',header=TRUE)
a<-table.element(a,'# significant tests',header=TRUE)
a<-table.element(a,'% significant tests',header=TRUE)
a<-table.element(a,'OK/NOK',header=TRUE)
a<-table.row.end(a)
a<-table.row.start(a)
a<-table.element(a,'1% type I error level',header=TRUE)
a<-table.element(a,numsignificant1)
a<-table.element(a,numsignificant1/numgqtests)
if (numsignificant1/numgqtests < 0.01) dum <- 'OK' else dum <- 'NOK'
a<-table.element(a,dum)
a<-table.row.end(a)
a<-table.row.start(a)
a<-table.element(a,'5% type I error level',header=TRUE)
a<-table.element(a,numsignificant5)
a<-table.element(a,numsignificant5/numgqtests)
if (numsignificant5/numgqtests < 0.05) dum <- 'OK' else dum <- 'NOK'
a<-table.element(a,dum)
a<-table.row.end(a)
a<-table.row.start(a)
a<-table.element(a,'10% type I error level',header=TRUE)
a<-table.element(a,numsignificant10)
a<-table.element(a,numsignificant10/numgqtests)
if (numsignificant10/numgqtests < 0.1) dum <- 'OK' else dum <- 'NOK'
a<-table.element(a,dum)
a<-table.row.end(a)
a<-table.end(a)
table.save(a,file='mytable6.tab')
}