Free Statistics

of Irreproducible Research!

Author's title

Author*The author of this computation has been verified*
R Software Modulerwasp_autocorrelation.wasp
Title produced by software(Partial) Autocorrelation Function
Date of computationSat, 06 Dec 2008 06:59:00 -0700
Cite this page as followsStatistical Computations at FreeStatistics.org, Office for Research Development and Education, URL https://freestatistics.org/blog/index.php?v=date/2008/Dec/06/t1228572006qbqvj0l2pmkb42c.htm/, Retrieved Fri, 17 May 2024 01:42:28 +0000
Statistical Computations at FreeStatistics.org, Office for Research Development and Education, URL https://freestatistics.org/blog/index.php?pk=29615, Retrieved Fri, 17 May 2024 01:42:28 +0000
QR Codes:

Original text written by user:
IsPrivate?No (this computation is public)
User-defined keywords
Estimated Impact161
Family? (F = Feedback message, R = changed R code, M = changed R Module, P = changed Parameters, D = changed Data)
-     [(Partial) Autocorrelation Function] [Autocorrelatie En...] [2008-12-06 13:45:25] [4300be8b33fd3dcdacd2aa9800ceba23]
-   PD    [(Partial) Autocorrelation Function] [Autocorrelation E...] [2008-12-06 13:59:00] [6912578025c824de531bc660dd61b996] [Current]
Feedback Forum

Post a new message
Dataseries X:
109
109
109.2
113.3
112.3
112.3
116.3
118.3
119.4
119.4
119.4
120.1
121.7
123.7
123.7
128.5
127.1
122.6
119.8
122.7
123.4
123.8
121.8
121.2
121.2
121.2
121.2
129.6
131
131
129.8
129.8
134.9
131.2
127.1
130.5
130.5
131.7
131.7
131.7
131.7
128.7
125
124.5
123
122.8
123.1
124.8
126.9
131.7
136.8
143.7
150.1
152.7
152.6
150.5
154.9
158
158.1
160.6
160.6


Summary of computational transaction
Raw Inputview raw input (R code)
Raw Outputview raw output of R engine
Computing time2 seconds
R Server'Sir Ronald Aylmer Fisher' @ 193.190.124.24

\begin{tabular}{lllllllll}
\hline
Summary of computational transaction \tabularnewline
Raw Input & view raw input (R code)  \tabularnewline
Raw Output & view raw output of R engine  \tabularnewline
Computing time & 2 seconds \tabularnewline
R Server & 'Sir Ronald Aylmer Fisher' @ 193.190.124.24 \tabularnewline
\hline
\end{tabular}
%Source: https://freestatistics.org/blog/index.php?pk=29615&T=0

[TABLE]
[ROW][C]Summary of computational transaction[/C][/ROW]
[ROW][C]Raw Input[/C][C]view raw input (R code) [/C][/ROW]
[ROW][C]Raw Output[/C][C]view raw output of R engine [/C][/ROW]
[ROW][C]Computing time[/C][C]2 seconds[/C][/ROW]
[ROW][C]R Server[/C][C]'Sir Ronald Aylmer Fisher' @ 193.190.124.24[/C][/ROW]
[/TABLE]
Source: https://freestatistics.org/blog/index.php?pk=29615&T=0

Globally Unique Identifier (entire table): ba.freestatistics.org/blog/index.php?pk=29615&T=0

As an alternative you can also use a QR Code:  

The GUIDs for individual cells are displayed in the table below:

Summary of computational transaction
Raw Inputview raw input (R code)
Raw Outputview raw output of R engine
Computing time2 seconds
R Server'Sir Ronald Aylmer Fisher' @ 193.190.124.24


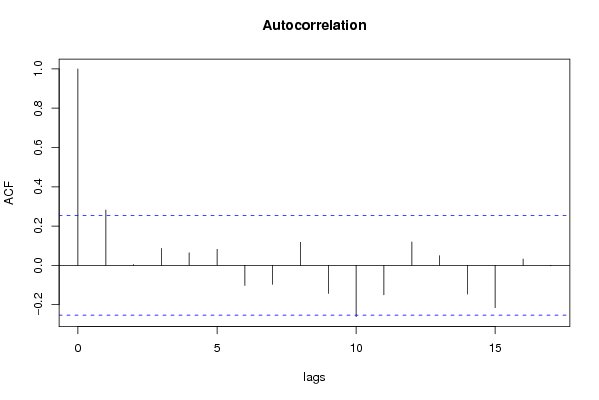
Autocorrelation Function
Time lag kACF(k)T-STATP-value
10.281292.17890.01664
20.0046380.03590.48573
30.0856030.66310.25491
40.0635810.49250.312084
50.0813560.63020.265484
6-0.102216-0.79180.21581
7-0.096463-0.74720.228931
80.1170760.90690.184052
9-0.142903-1.10690.136373
10-0.261273-2.02380.023725
11-0.149666-1.15930.125462
120.1194610.92530.179248
130.0489990.37950.352813
14-0.146274-1.1330.130854
15-0.215522-1.66940.050121
160.0317780.24610.403204
17-0.002468-0.01910.492406

\begin{tabular}{lllllllll}
\hline
Autocorrelation Function \tabularnewline
Time lag k & ACF(k) & T-STAT & P-value \tabularnewline
1 & 0.28129 & 2.1789 & 0.01664 \tabularnewline
2 & 0.004638 & 0.0359 & 0.48573 \tabularnewline
3 & 0.085603 & 0.6631 & 0.25491 \tabularnewline
4 & 0.063581 & 0.4925 & 0.312084 \tabularnewline
5 & 0.081356 & 0.6302 & 0.265484 \tabularnewline
6 & -0.102216 & -0.7918 & 0.21581 \tabularnewline
7 & -0.096463 & -0.7472 & 0.228931 \tabularnewline
8 & 0.117076 & 0.9069 & 0.184052 \tabularnewline
9 & -0.142903 & -1.1069 & 0.136373 \tabularnewline
10 & -0.261273 & -2.0238 & 0.023725 \tabularnewline
11 & -0.149666 & -1.1593 & 0.125462 \tabularnewline
12 & 0.119461 & 0.9253 & 0.179248 \tabularnewline
13 & 0.048999 & 0.3795 & 0.352813 \tabularnewline
14 & -0.146274 & -1.133 & 0.130854 \tabularnewline
15 & -0.215522 & -1.6694 & 0.050121 \tabularnewline
16 & 0.031778 & 0.2461 & 0.403204 \tabularnewline
17 & -0.002468 & -0.0191 & 0.492406 \tabularnewline
\hline
\end{tabular}
%Source: https://freestatistics.org/blog/index.php?pk=29615&T=1

[TABLE]
[ROW][C]Autocorrelation Function[/C][/ROW]
[ROW][C]Time lag k[/C][C]ACF(k)[/C][C]T-STAT[/C][C]P-value[/C][/ROW]
[ROW][C]1[/C][C]0.28129[/C][C]2.1789[/C][C]0.01664[/C][/ROW]
[ROW][C]2[/C][C]0.004638[/C][C]0.0359[/C][C]0.48573[/C][/ROW]
[ROW][C]3[/C][C]0.085603[/C][C]0.6631[/C][C]0.25491[/C][/ROW]
[ROW][C]4[/C][C]0.063581[/C][C]0.4925[/C][C]0.312084[/C][/ROW]
[ROW][C]5[/C][C]0.081356[/C][C]0.6302[/C][C]0.265484[/C][/ROW]
[ROW][C]6[/C][C]-0.102216[/C][C]-0.7918[/C][C]0.21581[/C][/ROW]
[ROW][C]7[/C][C]-0.096463[/C][C]-0.7472[/C][C]0.228931[/C][/ROW]
[ROW][C]8[/C][C]0.117076[/C][C]0.9069[/C][C]0.184052[/C][/ROW]
[ROW][C]9[/C][C]-0.142903[/C][C]-1.1069[/C][C]0.136373[/C][/ROW]
[ROW][C]10[/C][C]-0.261273[/C][C]-2.0238[/C][C]0.023725[/C][/ROW]
[ROW][C]11[/C][C]-0.149666[/C][C]-1.1593[/C][C]0.125462[/C][/ROW]
[ROW][C]12[/C][C]0.119461[/C][C]0.9253[/C][C]0.179248[/C][/ROW]
[ROW][C]13[/C][C]0.048999[/C][C]0.3795[/C][C]0.352813[/C][/ROW]
[ROW][C]14[/C][C]-0.146274[/C][C]-1.133[/C][C]0.130854[/C][/ROW]
[ROW][C]15[/C][C]-0.215522[/C][C]-1.6694[/C][C]0.050121[/C][/ROW]
[ROW][C]16[/C][C]0.031778[/C][C]0.2461[/C][C]0.403204[/C][/ROW]
[ROW][C]17[/C][C]-0.002468[/C][C]-0.0191[/C][C]0.492406[/C][/ROW]
[/TABLE]
Source: https://freestatistics.org/blog/index.php?pk=29615&T=1

Globally Unique Identifier (entire table): ba.freestatistics.org/blog/index.php?pk=29615&T=1

As an alternative you can also use a QR Code:  

The GUIDs for individual cells are displayed in the table below:

Autocorrelation Function
Time lag kACF(k)T-STATP-value
10.281292.17890.01664
20.0046380.03590.48573
30.0856030.66310.25491
40.0635810.49250.312084
50.0813560.63020.265484
6-0.102216-0.79180.21581
7-0.096463-0.74720.228931
80.1170760.90690.184052
9-0.142903-1.10690.136373
10-0.261273-2.02380.023725
11-0.149666-1.15930.125462
120.1194610.92530.179248
130.0489990.37950.352813
14-0.146274-1.1330.130854
15-0.215522-1.66940.050121
160.0317780.24610.403204
17-0.002468-0.01910.492406


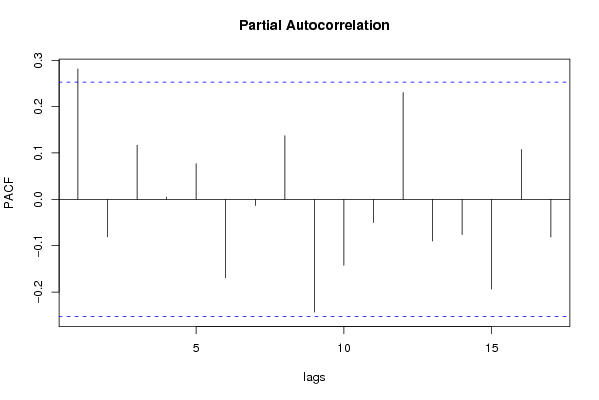
Partial Autocorrelation Function
Time lag kPACF(k)T-STATP-value
10.281292.17890.01664
2-0.080886-0.62650.266669
30.1168990.90550.184413
40.0048780.03780.484992
50.076990.59640.276587
6-0.169368-1.31190.097272
7-0.013219-0.10240.459391
80.1372161.06290.14605
9-0.243177-1.88360.032231
10-0.142263-1.1020.137438
11-0.050075-0.38790.349739
120.2302661.78360.039771
13-0.090022-0.69730.244151
14-0.07607-0.58920.278957
15-0.193301-1.49730.069779
160.107680.83410.203772
17-0.081389-0.63040.265402

\begin{tabular}{lllllllll}
\hline
Partial Autocorrelation Function \tabularnewline
Time lag k & PACF(k) & T-STAT & P-value \tabularnewline
1 & 0.28129 & 2.1789 & 0.01664 \tabularnewline
2 & -0.080886 & -0.6265 & 0.266669 \tabularnewline
3 & 0.116899 & 0.9055 & 0.184413 \tabularnewline
4 & 0.004878 & 0.0378 & 0.484992 \tabularnewline
5 & 0.07699 & 0.5964 & 0.276587 \tabularnewline
6 & -0.169368 & -1.3119 & 0.097272 \tabularnewline
7 & -0.013219 & -0.1024 & 0.459391 \tabularnewline
8 & 0.137216 & 1.0629 & 0.14605 \tabularnewline
9 & -0.243177 & -1.8836 & 0.032231 \tabularnewline
10 & -0.142263 & -1.102 & 0.137438 \tabularnewline
11 & -0.050075 & -0.3879 & 0.349739 \tabularnewline
12 & 0.230266 & 1.7836 & 0.039771 \tabularnewline
13 & -0.090022 & -0.6973 & 0.244151 \tabularnewline
14 & -0.07607 & -0.5892 & 0.278957 \tabularnewline
15 & -0.193301 & -1.4973 & 0.069779 \tabularnewline
16 & 0.10768 & 0.8341 & 0.203772 \tabularnewline
17 & -0.081389 & -0.6304 & 0.265402 \tabularnewline
\hline
\end{tabular}
%Source: https://freestatistics.org/blog/index.php?pk=29615&T=2

[TABLE]
[ROW][C]Partial Autocorrelation Function[/C][/ROW]
[ROW][C]Time lag k[/C][C]PACF(k)[/C][C]T-STAT[/C][C]P-value[/C][/ROW]
[ROW][C]1[/C][C]0.28129[/C][C]2.1789[/C][C]0.01664[/C][/ROW]
[ROW][C]2[/C][C]-0.080886[/C][C]-0.6265[/C][C]0.266669[/C][/ROW]
[ROW][C]3[/C][C]0.116899[/C][C]0.9055[/C][C]0.184413[/C][/ROW]
[ROW][C]4[/C][C]0.004878[/C][C]0.0378[/C][C]0.484992[/C][/ROW]
[ROW][C]5[/C][C]0.07699[/C][C]0.5964[/C][C]0.276587[/C][/ROW]
[ROW][C]6[/C][C]-0.169368[/C][C]-1.3119[/C][C]0.097272[/C][/ROW]
[ROW][C]7[/C][C]-0.013219[/C][C]-0.1024[/C][C]0.459391[/C][/ROW]
[ROW][C]8[/C][C]0.137216[/C][C]1.0629[/C][C]0.14605[/C][/ROW]
[ROW][C]9[/C][C]-0.243177[/C][C]-1.8836[/C][C]0.032231[/C][/ROW]
[ROW][C]10[/C][C]-0.142263[/C][C]-1.102[/C][C]0.137438[/C][/ROW]
[ROW][C]11[/C][C]-0.050075[/C][C]-0.3879[/C][C]0.349739[/C][/ROW]
[ROW][C]12[/C][C]0.230266[/C][C]1.7836[/C][C]0.039771[/C][/ROW]
[ROW][C]13[/C][C]-0.090022[/C][C]-0.6973[/C][C]0.244151[/C][/ROW]
[ROW][C]14[/C][C]-0.07607[/C][C]-0.5892[/C][C]0.278957[/C][/ROW]
[ROW][C]15[/C][C]-0.193301[/C][C]-1.4973[/C][C]0.069779[/C][/ROW]
[ROW][C]16[/C][C]0.10768[/C][C]0.8341[/C][C]0.203772[/C][/ROW]
[ROW][C]17[/C][C]-0.081389[/C][C]-0.6304[/C][C]0.265402[/C][/ROW]
[/TABLE]
Source: https://freestatistics.org/blog/index.php?pk=29615&T=2

Globally Unique Identifier (entire table): ba.freestatistics.org/blog/index.php?pk=29615&T=2

As an alternative you can also use a QR Code:  

The GUIDs for individual cells are displayed in the table below:

Partial Autocorrelation Function
Time lag kPACF(k)T-STATP-value
10.281292.17890.01664
2-0.080886-0.62650.266669
30.1168990.90550.184413
40.0048780.03780.484992
50.076990.59640.276587
6-0.169368-1.31190.097272
7-0.013219-0.10240.459391
80.1372161.06290.14605
9-0.243177-1.88360.032231
10-0.142263-1.1020.137438
11-0.050075-0.38790.349739
120.2302661.78360.039771
13-0.090022-0.69730.244151
14-0.07607-0.58920.278957
15-0.193301-1.49730.069779
160.107680.83410.203772
17-0.081389-0.63040.265402


Parameters (Session):
par1 = Default ; par2 = 1 ; par3 = 1 ; par4 = 0 ; par5 = 12 ;
Parameters (R input):
par1 = Default ; par2 = 1 ; par3 = 1 ; par4 = 0 ; par5 = 12 ;
R code (references can be found in the software module):
if (par1 == 'Default') {
par1 = 10*log10(length(x))
} else {
par1 <- as.numeric(par1)
}
par2 <- as.numeric(par2)
par3 <- as.numeric(par3)
par4 <- as.numeric(par4)
par5 <- as.numeric(par5)
if (par2 == 0) {
x <- log(x)
} else {
x <- (x ^ par2 - 1) / par2
}
if (par3 > 0) x <- diff(x,lag=1,difference=par3)
if (par4 > 0) x <- diff(x,lag=par5,difference=par4)
bitmap(file='pic1.png')
racf <- acf(x,par1,main='Autocorrelation',xlab='lags',ylab='ACF')
dev.off()
bitmap(file='pic2.png')
rpacf <- pacf(x,par1,main='Partial Autocorrelation',xlab='lags',ylab='PACF')
dev.off()
(myacf <- c(racf$acf))
(mypacf <- c(rpacf$acf))
lengthx <- length(x)
sqrtn <- sqrt(lengthx)
load(file='createtable')
a<-table.start()
a<-table.row.start(a)
a<-table.element(a,'Autocorrelation Function',4,TRUE)
a<-table.row.end(a)
a<-table.row.start(a)
a<-table.element(a,'Time lag k',header=TRUE)
a<-table.element(a,hyperlink('basics.htm','ACF(k)','click here for more information about the Autocorrelation Function'),header=TRUE)
a<-table.element(a,'T-STAT',header=TRUE)
a<-table.element(a,'P-value',header=TRUE)
a<-table.row.end(a)
for (i in 2:(par1+1)) {
a<-table.row.start(a)
a<-table.element(a,i-1,header=TRUE)
a<-table.element(a,round(myacf[i],6))
mytstat <- myacf[i]*sqrtn
a<-table.element(a,round(mytstat,4))
a<-table.element(a,round(1-pt(abs(mytstat),lengthx),6))
a<-table.row.end(a)
}
a<-table.end(a)
table.save(a,file='mytable.tab')
a<-table.start()
a<-table.row.start(a)
a<-table.element(a,'Partial Autocorrelation Function',4,TRUE)
a<-table.row.end(a)
a<-table.row.start(a)
a<-table.element(a,'Time lag k',header=TRUE)
a<-table.element(a,hyperlink('basics.htm','PACF(k)','click here for more information about the Partial Autocorrelation Function'),header=TRUE)
a<-table.element(a,'T-STAT',header=TRUE)
a<-table.element(a,'P-value',header=TRUE)
a<-table.row.end(a)
for (i in 1:par1) {
a<-table.row.start(a)
a<-table.element(a,i,header=TRUE)
a<-table.element(a,round(mypacf[i],6))
mytstat <- mypacf[i]*sqrtn
a<-table.element(a,round(mytstat,4))
a<-table.element(a,round(1-pt(abs(mytstat),lengthx),6))
a<-table.row.end(a)
}
a<-table.end(a)
table.save(a,file='mytable1.tab')