Free Statistics

of Irreproducible Research!

Author's title

Author*The author of this computation has been verified*
R Software Modulerwasp_autocorrelation.wasp
Title produced by software(Partial) Autocorrelation Function
Date of computationFri, 05 Dec 2008 12:34:37 -0700
Cite this page as followsStatistical Computations at FreeStatistics.org, Office for Research Development and Education, URL https://freestatistics.org/blog/index.php?v=date/2008/Dec/05/t1228505700yjidmtybjkqbv9q.htm/, Retrieved Thu, 16 May 2024 05:11:14 +0000
Statistical Computations at FreeStatistics.org, Office for Research Development and Education, URL https://freestatistics.org/blog/index.php?pk=29408, Retrieved Thu, 16 May 2024 05:11:14 +0000
QR Codes:

Original text written by user:
IsPrivate?No (this computation is public)
User-defined keywordsjulie
Estimated Impact162
Family? (F = Feedback message, R = changed R code, M = changed R Module, P = changed Parameters, D = changed Data)
-     [Univariate Data Series] [data set] [2008-12-01 19:54:57] [b98453cac15ba1066b407e146608df68]
F RMP   [Variance Reduction Matrix] [vrm] [2008-12-05 18:40:07] [74be16979710d4c4e7c6647856088456]
F RMPD      [(Partial) Autocorrelation Function] [eigen data] [2008-12-05 19:34:37] [ff1af8c6f1c2f1c0e8def9bfc9355be9] [Current]
Feedback Forum
2008-12-11 15:49:36 [Katrijn Truyman] [reply
De seizonaliteit is verdwenen, dus de tijdreeks is stationair gemaakt.

Post a new message
Dataseries X:
97.3
101
113.2
101
105.7
113.9
86.4
96.5
103.3
114.9
105.8
94.2
98.4
99.4
108.8
112.6
104.4
112.2
81.1
97.1
112.6
113.8
107.8
103.2
103.3
101.2
107.7
110.4
101.9
115.9
89.9
88.6
117.2
123.9
100
103.6
94.1
98.7
119.5
112.7
104.4
124.7
89.1
97
121.6
118.8
114
111.5
97.2
102.5
113.4
109.8
104.9
126.1
80
96.8
117.2
112.3
117.3
111.1
102.2
104.3
122.9
107.6
121.3
131.5
89
104.4
128.9
135.9
133.3
121.3
120.5
120.4
137.9
126.1
133.2
146.6
103.4
117.2


Summary of computational transaction
Raw Inputview raw input (R code)
Raw Outputview raw output of R engine
Computing time2 seconds
R Server'Herman Ole Andreas Wold' @ 193.190.124.10:1001

\begin{tabular}{lllllllll}
\hline
Summary of computational transaction \tabularnewline
Raw Input & view raw input (R code)  \tabularnewline
Raw Output & view raw output of R engine  \tabularnewline
Computing time & 2 seconds \tabularnewline
R Server & 'Herman Ole Andreas Wold' @ 193.190.124.10:1001 \tabularnewline
\hline
\end{tabular}
%Source: https://freestatistics.org/blog/index.php?pk=29408&T=0

[TABLE]
[ROW][C]Summary of computational transaction[/C][/ROW]
[ROW][C]Raw Input[/C][C]view raw input (R code) [/C][/ROW]
[ROW][C]Raw Output[/C][C]view raw output of R engine [/C][/ROW]
[ROW][C]Computing time[/C][C]2 seconds[/C][/ROW]
[ROW][C]R Server[/C][C]'Herman Ole Andreas Wold' @ 193.190.124.10:1001[/C][/ROW]
[/TABLE]
Source: https://freestatistics.org/blog/index.php?pk=29408&T=0

Globally Unique Identifier (entire table): ba.freestatistics.org/blog/index.php?pk=29408&T=0

As an alternative you can also use a QR Code:  

The GUIDs for individual cells are displayed in the table below:

Summary of computational transaction
Raw Inputview raw input (R code)
Raw Outputview raw output of R engine
Computing time2 seconds
R Server'Herman Ole Andreas Wold' @ 193.190.124.10:1001


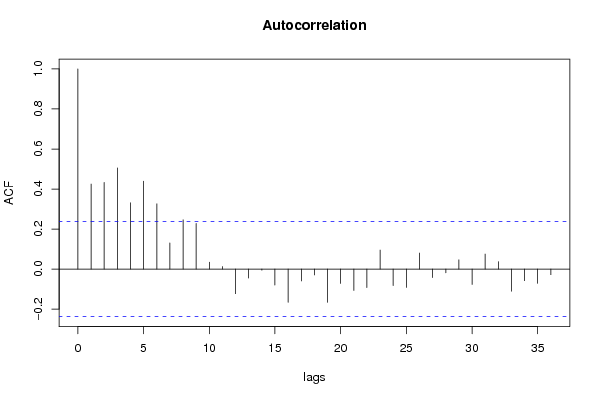
Autocorrelation Function
Time lag kACF(k)T-STATP-value
10.4249393.50410.000408
20.4332123.57240.000328
30.505284.16664.5e-05
40.3311812.7310.004018
50.4394453.62380.000278
60.3260052.68830.004511
70.1307781.07840.142329
80.2461982.03020.023125
90.227981.880.032198
100.0346380.28560.388015
110.0122960.10140.459766
12-0.122691-1.01170.157626
13-0.044929-0.37050.356083
14-0.005245-0.04330.482813
15-0.079797-0.6580.256373
16-0.165913-1.36820.087884
17-0.059546-0.4910.312494
18-0.029259-0.24130.405033
19-0.166309-1.37140.087376
20-0.071463-0.58930.278807
21-0.10679-0.88060.190815
22-0.092179-0.76010.224902
230.0948130.78180.218509
24-0.08242-0.67970.249516
25-0.091787-0.75690.225865
260.0801460.66090.255454
27-0.042271-0.34860.364243
28-0.018782-0.15490.438688
290.0463160.38190.351851
30-0.076749-0.63290.264466
310.0749330.61790.269349
320.0368440.30380.381095
33-0.110634-0.91230.182414
34-0.057742-0.47620.317747
35-0.071389-0.58870.279009
36-0.027697-0.22840.410012

\begin{tabular}{lllllllll}
\hline
Autocorrelation Function \tabularnewline
Time lag k & ACF(k) & T-STAT & P-value \tabularnewline
1 & 0.424939 & 3.5041 & 0.000408 \tabularnewline
2 & 0.433212 & 3.5724 & 0.000328 \tabularnewline
3 & 0.50528 & 4.1666 & 4.5e-05 \tabularnewline
4 & 0.331181 & 2.731 & 0.004018 \tabularnewline
5 & 0.439445 & 3.6238 & 0.000278 \tabularnewline
6 & 0.326005 & 2.6883 & 0.004511 \tabularnewline
7 & 0.130778 & 1.0784 & 0.142329 \tabularnewline
8 & 0.246198 & 2.0302 & 0.023125 \tabularnewline
9 & 0.22798 & 1.88 & 0.032198 \tabularnewline
10 & 0.034638 & 0.2856 & 0.388015 \tabularnewline
11 & 0.012296 & 0.1014 & 0.459766 \tabularnewline
12 & -0.122691 & -1.0117 & 0.157626 \tabularnewline
13 & -0.044929 & -0.3705 & 0.356083 \tabularnewline
14 & -0.005245 & -0.0433 & 0.482813 \tabularnewline
15 & -0.079797 & -0.658 & 0.256373 \tabularnewline
16 & -0.165913 & -1.3682 & 0.087884 \tabularnewline
17 & -0.059546 & -0.491 & 0.312494 \tabularnewline
18 & -0.029259 & -0.2413 & 0.405033 \tabularnewline
19 & -0.166309 & -1.3714 & 0.087376 \tabularnewline
20 & -0.071463 & -0.5893 & 0.278807 \tabularnewline
21 & -0.10679 & -0.8806 & 0.190815 \tabularnewline
22 & -0.092179 & -0.7601 & 0.224902 \tabularnewline
23 & 0.094813 & 0.7818 & 0.218509 \tabularnewline
24 & -0.08242 & -0.6797 & 0.249516 \tabularnewline
25 & -0.091787 & -0.7569 & 0.225865 \tabularnewline
26 & 0.080146 & 0.6609 & 0.255454 \tabularnewline
27 & -0.042271 & -0.3486 & 0.364243 \tabularnewline
28 & -0.018782 & -0.1549 & 0.438688 \tabularnewline
29 & 0.046316 & 0.3819 & 0.351851 \tabularnewline
30 & -0.076749 & -0.6329 & 0.264466 \tabularnewline
31 & 0.074933 & 0.6179 & 0.269349 \tabularnewline
32 & 0.036844 & 0.3038 & 0.381095 \tabularnewline
33 & -0.110634 & -0.9123 & 0.182414 \tabularnewline
34 & -0.057742 & -0.4762 & 0.317747 \tabularnewline
35 & -0.071389 & -0.5887 & 0.279009 \tabularnewline
36 & -0.027697 & -0.2284 & 0.410012 \tabularnewline
\hline
\end{tabular}
%Source: https://freestatistics.org/blog/index.php?pk=29408&T=1

[TABLE]
[ROW][C]Autocorrelation Function[/C][/ROW]
[ROW][C]Time lag k[/C][C]ACF(k)[/C][C]T-STAT[/C][C]P-value[/C][/ROW]
[ROW][C]1[/C][C]0.424939[/C][C]3.5041[/C][C]0.000408[/C][/ROW]
[ROW][C]2[/C][C]0.433212[/C][C]3.5724[/C][C]0.000328[/C][/ROW]
[ROW][C]3[/C][C]0.50528[/C][C]4.1666[/C][C]4.5e-05[/C][/ROW]
[ROW][C]4[/C][C]0.331181[/C][C]2.731[/C][C]0.004018[/C][/ROW]
[ROW][C]5[/C][C]0.439445[/C][C]3.6238[/C][C]0.000278[/C][/ROW]
[ROW][C]6[/C][C]0.326005[/C][C]2.6883[/C][C]0.004511[/C][/ROW]
[ROW][C]7[/C][C]0.130778[/C][C]1.0784[/C][C]0.142329[/C][/ROW]
[ROW][C]8[/C][C]0.246198[/C][C]2.0302[/C][C]0.023125[/C][/ROW]
[ROW][C]9[/C][C]0.22798[/C][C]1.88[/C][C]0.032198[/C][/ROW]
[ROW][C]10[/C][C]0.034638[/C][C]0.2856[/C][C]0.388015[/C][/ROW]
[ROW][C]11[/C][C]0.012296[/C][C]0.1014[/C][C]0.459766[/C][/ROW]
[ROW][C]12[/C][C]-0.122691[/C][C]-1.0117[/C][C]0.157626[/C][/ROW]
[ROW][C]13[/C][C]-0.044929[/C][C]-0.3705[/C][C]0.356083[/C][/ROW]
[ROW][C]14[/C][C]-0.005245[/C][C]-0.0433[/C][C]0.482813[/C][/ROW]
[ROW][C]15[/C][C]-0.079797[/C][C]-0.658[/C][C]0.256373[/C][/ROW]
[ROW][C]16[/C][C]-0.165913[/C][C]-1.3682[/C][C]0.087884[/C][/ROW]
[ROW][C]17[/C][C]-0.059546[/C][C]-0.491[/C][C]0.312494[/C][/ROW]
[ROW][C]18[/C][C]-0.029259[/C][C]-0.2413[/C][C]0.405033[/C][/ROW]
[ROW][C]19[/C][C]-0.166309[/C][C]-1.3714[/C][C]0.087376[/C][/ROW]
[ROW][C]20[/C][C]-0.071463[/C][C]-0.5893[/C][C]0.278807[/C][/ROW]
[ROW][C]21[/C][C]-0.10679[/C][C]-0.8806[/C][C]0.190815[/C][/ROW]
[ROW][C]22[/C][C]-0.092179[/C][C]-0.7601[/C][C]0.224902[/C][/ROW]
[ROW][C]23[/C][C]0.094813[/C][C]0.7818[/C][C]0.218509[/C][/ROW]
[ROW][C]24[/C][C]-0.08242[/C][C]-0.6797[/C][C]0.249516[/C][/ROW]
[ROW][C]25[/C][C]-0.091787[/C][C]-0.7569[/C][C]0.225865[/C][/ROW]
[ROW][C]26[/C][C]0.080146[/C][C]0.6609[/C][C]0.255454[/C][/ROW]
[ROW][C]27[/C][C]-0.042271[/C][C]-0.3486[/C][C]0.364243[/C][/ROW]
[ROW][C]28[/C][C]-0.018782[/C][C]-0.1549[/C][C]0.438688[/C][/ROW]
[ROW][C]29[/C][C]0.046316[/C][C]0.3819[/C][C]0.351851[/C][/ROW]
[ROW][C]30[/C][C]-0.076749[/C][C]-0.6329[/C][C]0.264466[/C][/ROW]
[ROW][C]31[/C][C]0.074933[/C][C]0.6179[/C][C]0.269349[/C][/ROW]
[ROW][C]32[/C][C]0.036844[/C][C]0.3038[/C][C]0.381095[/C][/ROW]
[ROW][C]33[/C][C]-0.110634[/C][C]-0.9123[/C][C]0.182414[/C][/ROW]
[ROW][C]34[/C][C]-0.057742[/C][C]-0.4762[/C][C]0.317747[/C][/ROW]
[ROW][C]35[/C][C]-0.071389[/C][C]-0.5887[/C][C]0.279009[/C][/ROW]
[ROW][C]36[/C][C]-0.027697[/C][C]-0.2284[/C][C]0.410012[/C][/ROW]
[/TABLE]
Source: https://freestatistics.org/blog/index.php?pk=29408&T=1

Globally Unique Identifier (entire table): ba.freestatistics.org/blog/index.php?pk=29408&T=1

As an alternative you can also use a QR Code:  

The GUIDs for individual cells are displayed in the table below:

Autocorrelation Function
Time lag kACF(k)T-STATP-value
10.4249393.50410.000408
20.4332123.57240.000328
30.505284.16664.5e-05
40.3311812.7310.004018
50.4394453.62380.000278
60.3260052.68830.004511
70.1307781.07840.142329
80.2461982.03020.023125
90.227981.880.032198
100.0346380.28560.388015
110.0122960.10140.459766
12-0.122691-1.01170.157626
13-0.044929-0.37050.356083
14-0.005245-0.04330.482813
15-0.079797-0.6580.256373
16-0.165913-1.36820.087884
17-0.059546-0.4910.312494
18-0.029259-0.24130.405033
19-0.166309-1.37140.087376
20-0.071463-0.58930.278807
21-0.10679-0.88060.190815
22-0.092179-0.76010.224902
230.0948130.78180.218509
24-0.08242-0.67970.249516
25-0.091787-0.75690.225865
260.0801460.66090.255454
27-0.042271-0.34860.364243
28-0.018782-0.15490.438688
290.0463160.38190.351851
30-0.076749-0.63290.264466
310.0749330.61790.269349
320.0368440.30380.381095
33-0.110634-0.91230.182414
34-0.057742-0.47620.317747
35-0.071389-0.58870.279009
36-0.027697-0.22840.410012


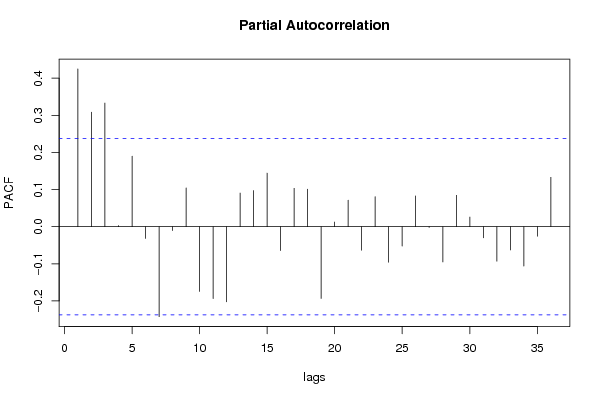
Partial Autocorrelation Function
Time lag kPACF(k)T-STATP-value
10.4249393.50410.000408
20.3083112.54240.006646
30.3330042.7460.003856
40.0028440.02340.49068
50.1898361.56540.061062
6-0.031606-0.26060.397582
7-0.242502-1.99970.024764
8-0.010644-0.08780.465158
90.1043350.86040.196305
10-0.17467-1.44040.077176
11-0.193848-1.59850.057283
12-0.202423-1.66920.049835
130.0905290.74650.228964
140.0972290.80180.212739
150.1442341.18940.119212
16-0.064551-0.53230.298127
170.1032960.85180.198656
180.1010310.83310.203845
19-0.19347-1.59540.057631
200.0123930.10220.459451
210.0711720.58690.279608
22-0.06344-0.52310.30129
230.0808650.66680.253568
24-0.095595-0.78830.216632
25-0.052149-0.430.334266
260.0826420.68150.24894
27-0.001993-0.01640.493468
28-0.094917-0.78270.218258
290.0845950.69760.243907
300.0257930.21270.416101
31-0.030155-0.24870.402186
32-0.093153-0.76820.222526
33-0.062626-0.51640.303614
34-0.106346-0.87690.191801
35-0.025605-0.21110.416703
360.1331091.09760.138115

\begin{tabular}{lllllllll}
\hline
Partial Autocorrelation Function \tabularnewline
Time lag k & PACF(k) & T-STAT & P-value \tabularnewline
1 & 0.424939 & 3.5041 & 0.000408 \tabularnewline
2 & 0.308311 & 2.5424 & 0.006646 \tabularnewline
3 & 0.333004 & 2.746 & 0.003856 \tabularnewline
4 & 0.002844 & 0.0234 & 0.49068 \tabularnewline
5 & 0.189836 & 1.5654 & 0.061062 \tabularnewline
6 & -0.031606 & -0.2606 & 0.397582 \tabularnewline
7 & -0.242502 & -1.9997 & 0.024764 \tabularnewline
8 & -0.010644 & -0.0878 & 0.465158 \tabularnewline
9 & 0.104335 & 0.8604 & 0.196305 \tabularnewline
10 & -0.17467 & -1.4404 & 0.077176 \tabularnewline
11 & -0.193848 & -1.5985 & 0.057283 \tabularnewline
12 & -0.202423 & -1.6692 & 0.049835 \tabularnewline
13 & 0.090529 & 0.7465 & 0.228964 \tabularnewline
14 & 0.097229 & 0.8018 & 0.212739 \tabularnewline
15 & 0.144234 & 1.1894 & 0.119212 \tabularnewline
16 & -0.064551 & -0.5323 & 0.298127 \tabularnewline
17 & 0.103296 & 0.8518 & 0.198656 \tabularnewline
18 & 0.101031 & 0.8331 & 0.203845 \tabularnewline
19 & -0.19347 & -1.5954 & 0.057631 \tabularnewline
20 & 0.012393 & 0.1022 & 0.459451 \tabularnewline
21 & 0.071172 & 0.5869 & 0.279608 \tabularnewline
22 & -0.06344 & -0.5231 & 0.30129 \tabularnewline
23 & 0.080865 & 0.6668 & 0.253568 \tabularnewline
24 & -0.095595 & -0.7883 & 0.216632 \tabularnewline
25 & -0.052149 & -0.43 & 0.334266 \tabularnewline
26 & 0.082642 & 0.6815 & 0.24894 \tabularnewline
27 & -0.001993 & -0.0164 & 0.493468 \tabularnewline
28 & -0.094917 & -0.7827 & 0.218258 \tabularnewline
29 & 0.084595 & 0.6976 & 0.243907 \tabularnewline
30 & 0.025793 & 0.2127 & 0.416101 \tabularnewline
31 & -0.030155 & -0.2487 & 0.402186 \tabularnewline
32 & -0.093153 & -0.7682 & 0.222526 \tabularnewline
33 & -0.062626 & -0.5164 & 0.303614 \tabularnewline
34 & -0.106346 & -0.8769 & 0.191801 \tabularnewline
35 & -0.025605 & -0.2111 & 0.416703 \tabularnewline
36 & 0.133109 & 1.0976 & 0.138115 \tabularnewline
\hline
\end{tabular}
%Source: https://freestatistics.org/blog/index.php?pk=29408&T=2

[TABLE]
[ROW][C]Partial Autocorrelation Function[/C][/ROW]
[ROW][C]Time lag k[/C][C]PACF(k)[/C][C]T-STAT[/C][C]P-value[/C][/ROW]
[ROW][C]1[/C][C]0.424939[/C][C]3.5041[/C][C]0.000408[/C][/ROW]
[ROW][C]2[/C][C]0.308311[/C][C]2.5424[/C][C]0.006646[/C][/ROW]
[ROW][C]3[/C][C]0.333004[/C][C]2.746[/C][C]0.003856[/C][/ROW]
[ROW][C]4[/C][C]0.002844[/C][C]0.0234[/C][C]0.49068[/C][/ROW]
[ROW][C]5[/C][C]0.189836[/C][C]1.5654[/C][C]0.061062[/C][/ROW]
[ROW][C]6[/C][C]-0.031606[/C][C]-0.2606[/C][C]0.397582[/C][/ROW]
[ROW][C]7[/C][C]-0.242502[/C][C]-1.9997[/C][C]0.024764[/C][/ROW]
[ROW][C]8[/C][C]-0.010644[/C][C]-0.0878[/C][C]0.465158[/C][/ROW]
[ROW][C]9[/C][C]0.104335[/C][C]0.8604[/C][C]0.196305[/C][/ROW]
[ROW][C]10[/C][C]-0.17467[/C][C]-1.4404[/C][C]0.077176[/C][/ROW]
[ROW][C]11[/C][C]-0.193848[/C][C]-1.5985[/C][C]0.057283[/C][/ROW]
[ROW][C]12[/C][C]-0.202423[/C][C]-1.6692[/C][C]0.049835[/C][/ROW]
[ROW][C]13[/C][C]0.090529[/C][C]0.7465[/C][C]0.228964[/C][/ROW]
[ROW][C]14[/C][C]0.097229[/C][C]0.8018[/C][C]0.212739[/C][/ROW]
[ROW][C]15[/C][C]0.144234[/C][C]1.1894[/C][C]0.119212[/C][/ROW]
[ROW][C]16[/C][C]-0.064551[/C][C]-0.5323[/C][C]0.298127[/C][/ROW]
[ROW][C]17[/C][C]0.103296[/C][C]0.8518[/C][C]0.198656[/C][/ROW]
[ROW][C]18[/C][C]0.101031[/C][C]0.8331[/C][C]0.203845[/C][/ROW]
[ROW][C]19[/C][C]-0.19347[/C][C]-1.5954[/C][C]0.057631[/C][/ROW]
[ROW][C]20[/C][C]0.012393[/C][C]0.1022[/C][C]0.459451[/C][/ROW]
[ROW][C]21[/C][C]0.071172[/C][C]0.5869[/C][C]0.279608[/C][/ROW]
[ROW][C]22[/C][C]-0.06344[/C][C]-0.5231[/C][C]0.30129[/C][/ROW]
[ROW][C]23[/C][C]0.080865[/C][C]0.6668[/C][C]0.253568[/C][/ROW]
[ROW][C]24[/C][C]-0.095595[/C][C]-0.7883[/C][C]0.216632[/C][/ROW]
[ROW][C]25[/C][C]-0.052149[/C][C]-0.43[/C][C]0.334266[/C][/ROW]
[ROW][C]26[/C][C]0.082642[/C][C]0.6815[/C][C]0.24894[/C][/ROW]
[ROW][C]27[/C][C]-0.001993[/C][C]-0.0164[/C][C]0.493468[/C][/ROW]
[ROW][C]28[/C][C]-0.094917[/C][C]-0.7827[/C][C]0.218258[/C][/ROW]
[ROW][C]29[/C][C]0.084595[/C][C]0.6976[/C][C]0.243907[/C][/ROW]
[ROW][C]30[/C][C]0.025793[/C][C]0.2127[/C][C]0.416101[/C][/ROW]
[ROW][C]31[/C][C]-0.030155[/C][C]-0.2487[/C][C]0.402186[/C][/ROW]
[ROW][C]32[/C][C]-0.093153[/C][C]-0.7682[/C][C]0.222526[/C][/ROW]
[ROW][C]33[/C][C]-0.062626[/C][C]-0.5164[/C][C]0.303614[/C][/ROW]
[ROW][C]34[/C][C]-0.106346[/C][C]-0.8769[/C][C]0.191801[/C][/ROW]
[ROW][C]35[/C][C]-0.025605[/C][C]-0.2111[/C][C]0.416703[/C][/ROW]
[ROW][C]36[/C][C]0.133109[/C][C]1.0976[/C][C]0.138115[/C][/ROW]
[/TABLE]
Source: https://freestatistics.org/blog/index.php?pk=29408&T=2

Globally Unique Identifier (entire table): ba.freestatistics.org/blog/index.php?pk=29408&T=2

As an alternative you can also use a QR Code:  

The GUIDs for individual cells are displayed in the table below:

Partial Autocorrelation Function
Time lag kPACF(k)T-STATP-value
10.4249393.50410.000408
20.3083112.54240.006646
30.3330042.7460.003856
40.0028440.02340.49068
50.1898361.56540.061062
6-0.031606-0.26060.397582
7-0.242502-1.99970.024764
8-0.010644-0.08780.465158
90.1043350.86040.196305
10-0.17467-1.44040.077176
11-0.193848-1.59850.057283
12-0.202423-1.66920.049835
130.0905290.74650.228964
140.0972290.80180.212739
150.1442341.18940.119212
16-0.064551-0.53230.298127
170.1032960.85180.198656
180.1010310.83310.203845
19-0.19347-1.59540.057631
200.0123930.10220.459451
210.0711720.58690.279608
22-0.06344-0.52310.30129
230.0808650.66680.253568
24-0.095595-0.78830.216632
25-0.052149-0.430.334266
260.0826420.68150.24894
27-0.001993-0.01640.493468
28-0.094917-0.78270.218258
290.0845950.69760.243907
300.0257930.21270.416101
31-0.030155-0.24870.402186
32-0.093153-0.76820.222526
33-0.062626-0.51640.303614
34-0.106346-0.87690.191801
35-0.025605-0.21110.416703
360.1331091.09760.138115


Parameters (Session):
par1 = 36 ; par2 = 1 ; par3 = 0 ; par4 = 1 ; par5 = 12 ;
Parameters (R input):
par1 = 36 ; par2 = 1 ; par3 = 0 ; par4 = 1 ; par5 = 12 ;
R code (references can be found in the software module):
if (par1 == 'Default') {
par1 = 10*log10(length(x))
} else {
par1 <- as.numeric(par1)
}
par2 <- as.numeric(par2)
par3 <- as.numeric(par3)
par4 <- as.numeric(par4)
par5 <- as.numeric(par5)
if (par2 == 0) {
x <- log(x)
} else {
x <- (x ^ par2 - 1) / par2
}
if (par3 > 0) x <- diff(x,lag=1,difference=par3)
if (par4 > 0) x <- diff(x,lag=par5,difference=par4)
bitmap(file='pic1.png')
racf <- acf(x,par1,main='Autocorrelation',xlab='lags',ylab='ACF')
dev.off()
bitmap(file='pic2.png')
rpacf <- pacf(x,par1,main='Partial Autocorrelation',xlab='lags',ylab='PACF')
dev.off()
(myacf <- c(racf$acf))
(mypacf <- c(rpacf$acf))
lengthx <- length(x)
sqrtn <- sqrt(lengthx)
load(file='createtable')
a<-table.start()
a<-table.row.start(a)
a<-table.element(a,'Autocorrelation Function',4,TRUE)
a<-table.row.end(a)
a<-table.row.start(a)
a<-table.element(a,'Time lag k',header=TRUE)
a<-table.element(a,hyperlink('basics.htm','ACF(k)','click here for more information about the Autocorrelation Function'),header=TRUE)
a<-table.element(a,'T-STAT',header=TRUE)
a<-table.element(a,'P-value',header=TRUE)
a<-table.row.end(a)
for (i in 2:(par1+1)) {
a<-table.row.start(a)
a<-table.element(a,i-1,header=TRUE)
a<-table.element(a,round(myacf[i],6))
mytstat <- myacf[i]*sqrtn
a<-table.element(a,round(mytstat,4))
a<-table.element(a,round(1-pt(abs(mytstat),lengthx),6))
a<-table.row.end(a)
}
a<-table.end(a)
table.save(a,file='mytable.tab')
a<-table.start()
a<-table.row.start(a)
a<-table.element(a,'Partial Autocorrelation Function',4,TRUE)
a<-table.row.end(a)
a<-table.row.start(a)
a<-table.element(a,'Time lag k',header=TRUE)
a<-table.element(a,hyperlink('basics.htm','PACF(k)','click here for more information about the Partial Autocorrelation Function'),header=TRUE)
a<-table.element(a,'T-STAT',header=TRUE)
a<-table.element(a,'P-value',header=TRUE)
a<-table.row.end(a)
for (i in 1:par1) {
a<-table.row.start(a)
a<-table.element(a,i,header=TRUE)
a<-table.element(a,round(mypacf[i],6))
mytstat <- mypacf[i]*sqrtn
a<-table.element(a,round(mytstat,4))
a<-table.element(a,round(1-pt(abs(mytstat),lengthx),6))
a<-table.row.end(a)
}
a<-table.end(a)
table.save(a,file='mytable1.tab')