Free Statistics

of Irreproducible Research!

Author's title

Author*The author of this computation has been verified*
R Software Modulerwasp_autocorrelation.wasp
Title produced by software(Partial) Autocorrelation Function
Date of computationFri, 05 Dec 2008 12:28:02 -0700
Cite this page as followsStatistical Computations at FreeStatistics.org, Office for Research Development and Education, URL https://freestatistics.org/blog/index.php?v=date/2008/Dec/05/t1228505342keavvhtt79fikxr.htm/, Retrieved Thu, 16 May 2024 22:58:16 +0000
Statistical Computations at FreeStatistics.org, Office for Research Development and Education, URL https://freestatistics.org/blog/index.php?pk=29407, Retrieved Thu, 16 May 2024 22:58:16 +0000
QR Codes:

Original text written by user:
IsPrivate?No (this computation is public)
User-defined keywordsjulie
Estimated Impact172
Family? (F = Feedback message, R = changed R code, M = changed R Module, P = changed Parameters, D = changed Data)
-     [Univariate Data Series] [data set] [2008-12-01 19:54:57] [b98453cac15ba1066b407e146608df68]
F RMP   [Variance Reduction Matrix] [vrm] [2008-12-05 18:40:07] [74be16979710d4c4e7c6647856088456]
F RMPD      [(Partial) Autocorrelation Function] [eigen data] [2008-12-05 19:28:02] [ff1af8c6f1c2f1c0e8def9bfc9355be9] [Current]
Feedback Forum
2008-12-11 15:48:43 [Katrijn Truyman] [reply
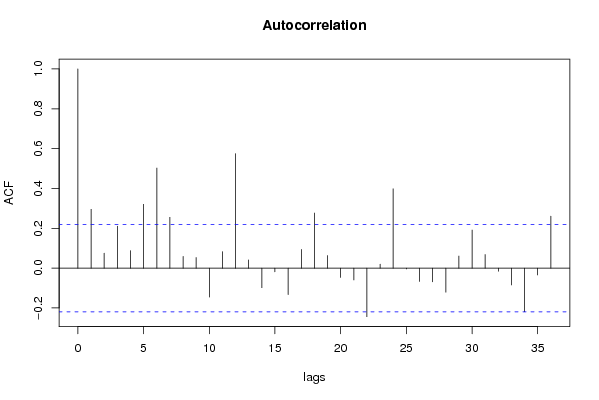
In de ACF is geen langzaam dalend patroon te zien,dus er is geen LT-trend aanwezig in de gegevens. we zien wel seizonaliteit:bij lags 12, 24 en 36. Om dit weg te werken moet er seizonaal gedifferentieerd worden: D=1.

Post a new message
Dataseries X:
97.3
101
113.2
101
105.7
113.9
86.4
96.5
103.3
114.9
105.8
94.2
98.4
99.4
108.8
112.6
104.4
112.2
81.1
97.1
112.6
113.8
107.8
103.2
103.3
101.2
107.7
110.4
101.9
115.9
89.9
88.6
117.2
123.9
100
103.6
94.1
98.7
119.5
112.7
104.4
124.7
89.1
97
121.6
118.8
114
111.5
97.2
102.5
113.4
109.8
104.9
126.1
80
96.8
117.2
112.3
117.3
111.1
102.2
104.3
122.9
107.6
121.3
131.5
89
104.4
128.9
135.9
133.3
121.3
120.5
120.4
137.9
126.1
133.2
146.6
103.4
117.2


Summary of computational transaction
Raw Inputview raw input (R code)
Raw Outputview raw output of R engine
Computing time1 seconds
R Server'Gwilym Jenkins' @ 72.249.127.135

\begin{tabular}{lllllllll}
\hline
Summary of computational transaction \tabularnewline
Raw Input & view raw input (R code)  \tabularnewline
Raw Output & view raw output of R engine  \tabularnewline
Computing time & 1 seconds \tabularnewline
R Server & 'Gwilym Jenkins' @ 72.249.127.135 \tabularnewline
\hline
\end{tabular}
%Source: https://freestatistics.org/blog/index.php?pk=29407&T=0

[TABLE]
[ROW][C]Summary of computational transaction[/C][/ROW]
[ROW][C]Raw Input[/C][C]view raw input (R code) [/C][/ROW]
[ROW][C]Raw Output[/C][C]view raw output of R engine [/C][/ROW]
[ROW][C]Computing time[/C][C]1 seconds[/C][/ROW]
[ROW][C]R Server[/C][C]'Gwilym Jenkins' @ 72.249.127.135[/C][/ROW]
[/TABLE]
Source: https://freestatistics.org/blog/index.php?pk=29407&T=0

Globally Unique Identifier (entire table): ba.freestatistics.org/blog/index.php?pk=29407&T=0

As an alternative you can also use a QR Code:  

The GUIDs for individual cells are displayed in the table below:

Summary of computational transaction
Raw Inputview raw input (R code)
Raw Outputview raw output of R engine
Computing time1 seconds
R Server'Gwilym Jenkins' @ 72.249.127.135


Autocorrelation Function
Time lag kACF(k)T-STATP-value
10.2955232.64320.004939
20.0751170.67190.251802
30.2106711.88430.031578
40.0878420.78570.217188
50.3201712.86370.002673
60.5022844.49261.2e-05
70.2552592.28310.012539
80.0588720.52660.299974
90.0528520.47270.31885
10-0.144946-1.29640.099276
110.082460.73750.231475
120.5748135.14131e-06
130.0413170.36960.356346
14-0.097886-0.87550.191957
15-0.018504-0.16550.434484
16-0.132805-1.18780.119205
170.0937240.83830.202181
180.2762742.47110.007798
190.0631570.56490.286863
20-0.04648-0.41570.339359
21-0.059516-0.53230.297986
22-0.243581-2.17870.01615
230.0200390.17920.429103
240.3981113.56080.000313
25-0.0038-0.0340.486485
26-0.06687-0.59810.275731
27-0.068616-0.61370.270572
28-0.120498-1.07780.142189
290.0605660.54170.29476
300.1910711.7090.045665
310.0681590.60960.271916
32-0.01518-0.13580.446169
33-0.084146-0.75260.226941
34-0.218514-1.95440.027071
35-0.034263-0.30650.380027
360.2607542.33230.011101

\begin{tabular}{lllllllll}
\hline
Autocorrelation Function \tabularnewline
Time lag k & ACF(k) & T-STAT & P-value \tabularnewline
1 & 0.295523 & 2.6432 & 0.004939 \tabularnewline
2 & 0.075117 & 0.6719 & 0.251802 \tabularnewline
3 & 0.210671 & 1.8843 & 0.031578 \tabularnewline
4 & 0.087842 & 0.7857 & 0.217188 \tabularnewline
5 & 0.320171 & 2.8637 & 0.002673 \tabularnewline
6 & 0.502284 & 4.4926 & 1.2e-05 \tabularnewline
7 & 0.255259 & 2.2831 & 0.012539 \tabularnewline
8 & 0.058872 & 0.5266 & 0.299974 \tabularnewline
9 & 0.052852 & 0.4727 & 0.31885 \tabularnewline
10 & -0.144946 & -1.2964 & 0.099276 \tabularnewline
11 & 0.08246 & 0.7375 & 0.231475 \tabularnewline
12 & 0.574813 & 5.1413 & 1e-06 \tabularnewline
13 & 0.041317 & 0.3696 & 0.356346 \tabularnewline
14 & -0.097886 & -0.8755 & 0.191957 \tabularnewline
15 & -0.018504 & -0.1655 & 0.434484 \tabularnewline
16 & -0.132805 & -1.1878 & 0.119205 \tabularnewline
17 & 0.093724 & 0.8383 & 0.202181 \tabularnewline
18 & 0.276274 & 2.4711 & 0.007798 \tabularnewline
19 & 0.063157 & 0.5649 & 0.286863 \tabularnewline
20 & -0.04648 & -0.4157 & 0.339359 \tabularnewline
21 & -0.059516 & -0.5323 & 0.297986 \tabularnewline
22 & -0.243581 & -2.1787 & 0.01615 \tabularnewline
23 & 0.020039 & 0.1792 & 0.429103 \tabularnewline
24 & 0.398111 & 3.5608 & 0.000313 \tabularnewline
25 & -0.0038 & -0.034 & 0.486485 \tabularnewline
26 & -0.06687 & -0.5981 & 0.275731 \tabularnewline
27 & -0.068616 & -0.6137 & 0.270572 \tabularnewline
28 & -0.120498 & -1.0778 & 0.142189 \tabularnewline
29 & 0.060566 & 0.5417 & 0.29476 \tabularnewline
30 & 0.191071 & 1.709 & 0.045665 \tabularnewline
31 & 0.068159 & 0.6096 & 0.271916 \tabularnewline
32 & -0.01518 & -0.1358 & 0.446169 \tabularnewline
33 & -0.084146 & -0.7526 & 0.226941 \tabularnewline
34 & -0.218514 & -1.9544 & 0.027071 \tabularnewline
35 & -0.034263 & -0.3065 & 0.380027 \tabularnewline
36 & 0.260754 & 2.3323 & 0.011101 \tabularnewline
\hline
\end{tabular}
%Source: https://freestatistics.org/blog/index.php?pk=29407&T=1

[TABLE]
[ROW][C]Autocorrelation Function[/C][/ROW]
[ROW][C]Time lag k[/C][C]ACF(k)[/C][C]T-STAT[/C][C]P-value[/C][/ROW]
[ROW][C]1[/C][C]0.295523[/C][C]2.6432[/C][C]0.004939[/C][/ROW]
[ROW][C]2[/C][C]0.075117[/C][C]0.6719[/C][C]0.251802[/C][/ROW]
[ROW][C]3[/C][C]0.210671[/C][C]1.8843[/C][C]0.031578[/C][/ROW]
[ROW][C]4[/C][C]0.087842[/C][C]0.7857[/C][C]0.217188[/C][/ROW]
[ROW][C]5[/C][C]0.320171[/C][C]2.8637[/C][C]0.002673[/C][/ROW]
[ROW][C]6[/C][C]0.502284[/C][C]4.4926[/C][C]1.2e-05[/C][/ROW]
[ROW][C]7[/C][C]0.255259[/C][C]2.2831[/C][C]0.012539[/C][/ROW]
[ROW][C]8[/C][C]0.058872[/C][C]0.5266[/C][C]0.299974[/C][/ROW]
[ROW][C]9[/C][C]0.052852[/C][C]0.4727[/C][C]0.31885[/C][/ROW]
[ROW][C]10[/C][C]-0.144946[/C][C]-1.2964[/C][C]0.099276[/C][/ROW]
[ROW][C]11[/C][C]0.08246[/C][C]0.7375[/C][C]0.231475[/C][/ROW]
[ROW][C]12[/C][C]0.574813[/C][C]5.1413[/C][C]1e-06[/C][/ROW]
[ROW][C]13[/C][C]0.041317[/C][C]0.3696[/C][C]0.356346[/C][/ROW]
[ROW][C]14[/C][C]-0.097886[/C][C]-0.8755[/C][C]0.191957[/C][/ROW]
[ROW][C]15[/C][C]-0.018504[/C][C]-0.1655[/C][C]0.434484[/C][/ROW]
[ROW][C]16[/C][C]-0.132805[/C][C]-1.1878[/C][C]0.119205[/C][/ROW]
[ROW][C]17[/C][C]0.093724[/C][C]0.8383[/C][C]0.202181[/C][/ROW]
[ROW][C]18[/C][C]0.276274[/C][C]2.4711[/C][C]0.007798[/C][/ROW]
[ROW][C]19[/C][C]0.063157[/C][C]0.5649[/C][C]0.286863[/C][/ROW]
[ROW][C]20[/C][C]-0.04648[/C][C]-0.4157[/C][C]0.339359[/C][/ROW]
[ROW][C]21[/C][C]-0.059516[/C][C]-0.5323[/C][C]0.297986[/C][/ROW]
[ROW][C]22[/C][C]-0.243581[/C][C]-2.1787[/C][C]0.01615[/C][/ROW]
[ROW][C]23[/C][C]0.020039[/C][C]0.1792[/C][C]0.429103[/C][/ROW]
[ROW][C]24[/C][C]0.398111[/C][C]3.5608[/C][C]0.000313[/C][/ROW]
[ROW][C]25[/C][C]-0.0038[/C][C]-0.034[/C][C]0.486485[/C][/ROW]
[ROW][C]26[/C][C]-0.06687[/C][C]-0.5981[/C][C]0.275731[/C][/ROW]
[ROW][C]27[/C][C]-0.068616[/C][C]-0.6137[/C][C]0.270572[/C][/ROW]
[ROW][C]28[/C][C]-0.120498[/C][C]-1.0778[/C][C]0.142189[/C][/ROW]
[ROW][C]29[/C][C]0.060566[/C][C]0.5417[/C][C]0.29476[/C][/ROW]
[ROW][C]30[/C][C]0.191071[/C][C]1.709[/C][C]0.045665[/C][/ROW]
[ROW][C]31[/C][C]0.068159[/C][C]0.6096[/C][C]0.271916[/C][/ROW]
[ROW][C]32[/C][C]-0.01518[/C][C]-0.1358[/C][C]0.446169[/C][/ROW]
[ROW][C]33[/C][C]-0.084146[/C][C]-0.7526[/C][C]0.226941[/C][/ROW]
[ROW][C]34[/C][C]-0.218514[/C][C]-1.9544[/C][C]0.027071[/C][/ROW]
[ROW][C]35[/C][C]-0.034263[/C][C]-0.3065[/C][C]0.380027[/C][/ROW]
[ROW][C]36[/C][C]0.260754[/C][C]2.3323[/C][C]0.011101[/C][/ROW]
[/TABLE]
Source: https://freestatistics.org/blog/index.php?pk=29407&T=1

Globally Unique Identifier (entire table): ba.freestatistics.org/blog/index.php?pk=29407&T=1

As an alternative you can also use a QR Code:  

The GUIDs for individual cells are displayed in the table below:

Autocorrelation Function
Time lag kACF(k)T-STATP-value
10.2955232.64320.004939
20.0751170.67190.251802
30.2106711.88430.031578
40.0878420.78570.217188
50.3201712.86370.002673
60.5022844.49261.2e-05
70.2552592.28310.012539
80.0588720.52660.299974
90.0528520.47270.31885
10-0.144946-1.29640.099276
110.082460.73750.231475
120.5748135.14131e-06
130.0413170.36960.356346
14-0.097886-0.87550.191957
15-0.018504-0.16550.434484
16-0.132805-1.18780.119205
170.0937240.83830.202181
180.2762742.47110.007798
190.0631570.56490.286863
20-0.04648-0.41570.339359
21-0.059516-0.53230.297986
22-0.243581-2.17870.01615
230.0200390.17920.429103
240.3981113.56080.000313
25-0.0038-0.0340.486485
26-0.06687-0.59810.275731
27-0.068616-0.61370.270572
28-0.120498-1.07780.142189
290.0605660.54170.29476
300.1910711.7090.045665
310.0681590.60960.271916
32-0.01518-0.13580.446169
33-0.084146-0.75260.226941
34-0.218514-1.95440.027071
35-0.034263-0.30650.380027
360.2607542.33230.011101


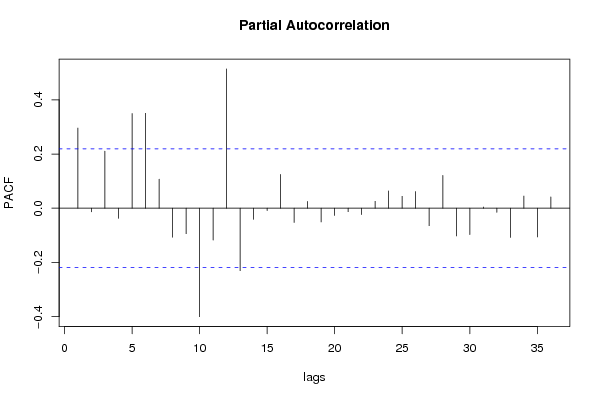
Partial Autocorrelation Function
Time lag kPACF(k)T-STATP-value
10.2955232.64320.004939
2-0.013386-0.11970.452501
30.2105541.88330.03165
4-0.037068-0.33150.37055
50.3490023.12160.001252
60.350233.13250.001211
70.1070990.95790.170495
8-0.106942-0.95650.170846
9-0.094083-0.84150.201288
10-0.399945-3.57720.000297
11-0.117276-1.04890.14868
120.5137164.59488e-06
13-0.230209-2.05910.021371
14-0.040807-0.3650.358042
15-0.008432-0.07540.470037
160.1247331.11560.133956
17-0.052562-0.47010.31977
180.025220.22560.411053
19-0.050628-0.45280.325948
20-0.026622-0.23810.4062
21-0.012875-0.11520.454303
22-0.023423-0.20950.417295
230.0257020.22990.409384
240.063860.57120.284738
250.0440680.39420.347257
260.0613750.5490.292284
27-0.064631-0.57810.282417
280.1211.08230.141194
29-0.10233-0.91530.181401
30-0.097156-0.8690.193727
310.0044570.03990.484151
32-0.01499-0.13410.446841
33-0.107537-0.96180.169514
340.0449450.4020.344377
35-0.105784-0.94620.173459
360.041540.37150.355606

\begin{tabular}{lllllllll}
\hline
Partial Autocorrelation Function \tabularnewline
Time lag k & PACF(k) & T-STAT & P-value \tabularnewline
1 & 0.295523 & 2.6432 & 0.004939 \tabularnewline
2 & -0.013386 & -0.1197 & 0.452501 \tabularnewline
3 & 0.210554 & 1.8833 & 0.03165 \tabularnewline
4 & -0.037068 & -0.3315 & 0.37055 \tabularnewline
5 & 0.349002 & 3.1216 & 0.001252 \tabularnewline
6 & 0.35023 & 3.1325 & 0.001211 \tabularnewline
7 & 0.107099 & 0.9579 & 0.170495 \tabularnewline
8 & -0.106942 & -0.9565 & 0.170846 \tabularnewline
9 & -0.094083 & -0.8415 & 0.201288 \tabularnewline
10 & -0.399945 & -3.5772 & 0.000297 \tabularnewline
11 & -0.117276 & -1.0489 & 0.14868 \tabularnewline
12 & 0.513716 & 4.5948 & 8e-06 \tabularnewline
13 & -0.230209 & -2.0591 & 0.021371 \tabularnewline
14 & -0.040807 & -0.365 & 0.358042 \tabularnewline
15 & -0.008432 & -0.0754 & 0.470037 \tabularnewline
16 & 0.124733 & 1.1156 & 0.133956 \tabularnewline
17 & -0.052562 & -0.4701 & 0.31977 \tabularnewline
18 & 0.02522 & 0.2256 & 0.411053 \tabularnewline
19 & -0.050628 & -0.4528 & 0.325948 \tabularnewline
20 & -0.026622 & -0.2381 & 0.4062 \tabularnewline
21 & -0.012875 & -0.1152 & 0.454303 \tabularnewline
22 & -0.023423 & -0.2095 & 0.417295 \tabularnewline
23 & 0.025702 & 0.2299 & 0.409384 \tabularnewline
24 & 0.06386 & 0.5712 & 0.284738 \tabularnewline
25 & 0.044068 & 0.3942 & 0.347257 \tabularnewline
26 & 0.061375 & 0.549 & 0.292284 \tabularnewline
27 & -0.064631 & -0.5781 & 0.282417 \tabularnewline
28 & 0.121 & 1.0823 & 0.141194 \tabularnewline
29 & -0.10233 & -0.9153 & 0.181401 \tabularnewline
30 & -0.097156 & -0.869 & 0.193727 \tabularnewline
31 & 0.004457 & 0.0399 & 0.484151 \tabularnewline
32 & -0.01499 & -0.1341 & 0.446841 \tabularnewline
33 & -0.107537 & -0.9618 & 0.169514 \tabularnewline
34 & 0.044945 & 0.402 & 0.344377 \tabularnewline
35 & -0.105784 & -0.9462 & 0.173459 \tabularnewline
36 & 0.04154 & 0.3715 & 0.355606 \tabularnewline
\hline
\end{tabular}
%Source: https://freestatistics.org/blog/index.php?pk=29407&T=2

[TABLE]
[ROW][C]Partial Autocorrelation Function[/C][/ROW]
[ROW][C]Time lag k[/C][C]PACF(k)[/C][C]T-STAT[/C][C]P-value[/C][/ROW]
[ROW][C]1[/C][C]0.295523[/C][C]2.6432[/C][C]0.004939[/C][/ROW]
[ROW][C]2[/C][C]-0.013386[/C][C]-0.1197[/C][C]0.452501[/C][/ROW]
[ROW][C]3[/C][C]0.210554[/C][C]1.8833[/C][C]0.03165[/C][/ROW]
[ROW][C]4[/C][C]-0.037068[/C][C]-0.3315[/C][C]0.37055[/C][/ROW]
[ROW][C]5[/C][C]0.349002[/C][C]3.1216[/C][C]0.001252[/C][/ROW]
[ROW][C]6[/C][C]0.35023[/C][C]3.1325[/C][C]0.001211[/C][/ROW]
[ROW][C]7[/C][C]0.107099[/C][C]0.9579[/C][C]0.170495[/C][/ROW]
[ROW][C]8[/C][C]-0.106942[/C][C]-0.9565[/C][C]0.170846[/C][/ROW]
[ROW][C]9[/C][C]-0.094083[/C][C]-0.8415[/C][C]0.201288[/C][/ROW]
[ROW][C]10[/C][C]-0.399945[/C][C]-3.5772[/C][C]0.000297[/C][/ROW]
[ROW][C]11[/C][C]-0.117276[/C][C]-1.0489[/C][C]0.14868[/C][/ROW]
[ROW][C]12[/C][C]0.513716[/C][C]4.5948[/C][C]8e-06[/C][/ROW]
[ROW][C]13[/C][C]-0.230209[/C][C]-2.0591[/C][C]0.021371[/C][/ROW]
[ROW][C]14[/C][C]-0.040807[/C][C]-0.365[/C][C]0.358042[/C][/ROW]
[ROW][C]15[/C][C]-0.008432[/C][C]-0.0754[/C][C]0.470037[/C][/ROW]
[ROW][C]16[/C][C]0.124733[/C][C]1.1156[/C][C]0.133956[/C][/ROW]
[ROW][C]17[/C][C]-0.052562[/C][C]-0.4701[/C][C]0.31977[/C][/ROW]
[ROW][C]18[/C][C]0.02522[/C][C]0.2256[/C][C]0.411053[/C][/ROW]
[ROW][C]19[/C][C]-0.050628[/C][C]-0.4528[/C][C]0.325948[/C][/ROW]
[ROW][C]20[/C][C]-0.026622[/C][C]-0.2381[/C][C]0.4062[/C][/ROW]
[ROW][C]21[/C][C]-0.012875[/C][C]-0.1152[/C][C]0.454303[/C][/ROW]
[ROW][C]22[/C][C]-0.023423[/C][C]-0.2095[/C][C]0.417295[/C][/ROW]
[ROW][C]23[/C][C]0.025702[/C][C]0.2299[/C][C]0.409384[/C][/ROW]
[ROW][C]24[/C][C]0.06386[/C][C]0.5712[/C][C]0.284738[/C][/ROW]
[ROW][C]25[/C][C]0.044068[/C][C]0.3942[/C][C]0.347257[/C][/ROW]
[ROW][C]26[/C][C]0.061375[/C][C]0.549[/C][C]0.292284[/C][/ROW]
[ROW][C]27[/C][C]-0.064631[/C][C]-0.5781[/C][C]0.282417[/C][/ROW]
[ROW][C]28[/C][C]0.121[/C][C]1.0823[/C][C]0.141194[/C][/ROW]
[ROW][C]29[/C][C]-0.10233[/C][C]-0.9153[/C][C]0.181401[/C][/ROW]
[ROW][C]30[/C][C]-0.097156[/C][C]-0.869[/C][C]0.193727[/C][/ROW]
[ROW][C]31[/C][C]0.004457[/C][C]0.0399[/C][C]0.484151[/C][/ROW]
[ROW][C]32[/C][C]-0.01499[/C][C]-0.1341[/C][C]0.446841[/C][/ROW]
[ROW][C]33[/C][C]-0.107537[/C][C]-0.9618[/C][C]0.169514[/C][/ROW]
[ROW][C]34[/C][C]0.044945[/C][C]0.402[/C][C]0.344377[/C][/ROW]
[ROW][C]35[/C][C]-0.105784[/C][C]-0.9462[/C][C]0.173459[/C][/ROW]
[ROW][C]36[/C][C]0.04154[/C][C]0.3715[/C][C]0.355606[/C][/ROW]
[/TABLE]
Source: https://freestatistics.org/blog/index.php?pk=29407&T=2

Globally Unique Identifier (entire table): ba.freestatistics.org/blog/index.php?pk=29407&T=2

As an alternative you can also use a QR Code:  

The GUIDs for individual cells are displayed in the table below:

Partial Autocorrelation Function
Time lag kPACF(k)T-STATP-value
10.2955232.64320.004939
2-0.013386-0.11970.452501
30.2105541.88330.03165
4-0.037068-0.33150.37055
50.3490023.12160.001252
60.350233.13250.001211
70.1070990.95790.170495
8-0.106942-0.95650.170846
9-0.094083-0.84150.201288
10-0.399945-3.57720.000297
11-0.117276-1.04890.14868
120.5137164.59488e-06
13-0.230209-2.05910.021371
14-0.040807-0.3650.358042
15-0.008432-0.07540.470037
160.1247331.11560.133956
17-0.052562-0.47010.31977
180.025220.22560.411053
19-0.050628-0.45280.325948
20-0.026622-0.23810.4062
21-0.012875-0.11520.454303
22-0.023423-0.20950.417295
230.0257020.22990.409384
240.063860.57120.284738
250.0440680.39420.347257
260.0613750.5490.292284
27-0.064631-0.57810.282417
280.1211.08230.141194
29-0.10233-0.91530.181401
30-0.097156-0.8690.193727
310.0044570.03990.484151
32-0.01499-0.13410.446841
33-0.107537-0.96180.169514
340.0449450.4020.344377
35-0.105784-0.94620.173459
360.041540.37150.355606


Parameters (Session):
par1 = 36 ; par2 = 1 ; par3 = 0 ; par4 = 0 ; par5 = 12 ;
Parameters (R input):
par1 = 36 ; par2 = 1 ; par3 = 0 ; par4 = 0 ; par5 = 12 ;
R code (references can be found in the software module):
if (par1 == 'Default') {
par1 = 10*log10(length(x))
} else {
par1 <- as.numeric(par1)
}
par2 <- as.numeric(par2)
par3 <- as.numeric(par3)
par4 <- as.numeric(par4)
par5 <- as.numeric(par5)
if (par2 == 0) {
x <- log(x)
} else {
x <- (x ^ par2 - 1) / par2
}
if (par3 > 0) x <- diff(x,lag=1,difference=par3)
if (par4 > 0) x <- diff(x,lag=par5,difference=par4)
bitmap(file='pic1.png')
racf <- acf(x,par1,main='Autocorrelation',xlab='lags',ylab='ACF')
dev.off()
bitmap(file='pic2.png')
rpacf <- pacf(x,par1,main='Partial Autocorrelation',xlab='lags',ylab='PACF')
dev.off()
(myacf <- c(racf$acf))
(mypacf <- c(rpacf$acf))
lengthx <- length(x)
sqrtn <- sqrt(lengthx)
load(file='createtable')
a<-table.start()
a<-table.row.start(a)
a<-table.element(a,'Autocorrelation Function',4,TRUE)
a<-table.row.end(a)
a<-table.row.start(a)
a<-table.element(a,'Time lag k',header=TRUE)
a<-table.element(a,hyperlink('basics.htm','ACF(k)','click here for more information about the Autocorrelation Function'),header=TRUE)
a<-table.element(a,'T-STAT',header=TRUE)
a<-table.element(a,'P-value',header=TRUE)
a<-table.row.end(a)
for (i in 2:(par1+1)) {
a<-table.row.start(a)
a<-table.element(a,i-1,header=TRUE)
a<-table.element(a,round(myacf[i],6))
mytstat <- myacf[i]*sqrtn
a<-table.element(a,round(mytstat,4))
a<-table.element(a,round(1-pt(abs(mytstat),lengthx),6))
a<-table.row.end(a)
}
a<-table.end(a)
table.save(a,file='mytable.tab')
a<-table.start()
a<-table.row.start(a)
a<-table.element(a,'Partial Autocorrelation Function',4,TRUE)
a<-table.row.end(a)
a<-table.row.start(a)
a<-table.element(a,'Time lag k',header=TRUE)
a<-table.element(a,hyperlink('basics.htm','PACF(k)','click here for more information about the Partial Autocorrelation Function'),header=TRUE)
a<-table.element(a,'T-STAT',header=TRUE)
a<-table.element(a,'P-value',header=TRUE)
a<-table.row.end(a)
for (i in 1:par1) {
a<-table.row.start(a)
a<-table.element(a,i,header=TRUE)
a<-table.element(a,round(mypacf[i],6))
mytstat <- mypacf[i]*sqrtn
a<-table.element(a,round(mytstat,4))
a<-table.element(a,round(1-pt(abs(mytstat),lengthx),6))
a<-table.row.end(a)
}
a<-table.end(a)
table.save(a,file='mytable1.tab')