Free Statistics

of Irreproducible Research!

Author's title

Author*The author of this computation has been verified*
R Software Modulerwasp_autocorrelation.wasp
Title produced by software(Partial) Autocorrelation Function
Date of computationFri, 05 Dec 2008 10:57:52 -0700
Cite this page as followsStatistical Computations at FreeStatistics.org, Office for Research Development and Education, URL https://freestatistics.org/blog/index.php?v=date/2008/Dec/05/t1228499923waojsurj0b52ejj.htm/, Retrieved Thu, 16 May 2024 13:16:14 +0000
Statistical Computations at FreeStatistics.org, Office for Research Development and Education, URL https://freestatistics.org/blog/index.php?pk=29368, Retrieved Thu, 16 May 2024 13:16:14 +0000
QR Codes:

Original text written by user:
IsPrivate?No (this computation is public)
User-defined keywords
Estimated Impact192
Family? (F = Feedback message, R = changed R code, M = changed R Module, P = changed Parameters, D = changed Data)
F     [Variance Reduction Matrix] [step 2 uitvoer] [2008-12-05 17:47:26] [3a9fc6d5b5e0e816787b7dbace57e7cd]
F RMPD    [(Partial) Autocorrelation Function] [step 2 uitvoer] [2008-12-05 17:57:52] [821c4b3d195be8e737cf8c9dc649d3cf] [Current]
Feedback Forum
2008-12-15 15:29:01 [Natalie De Wilde] [reply
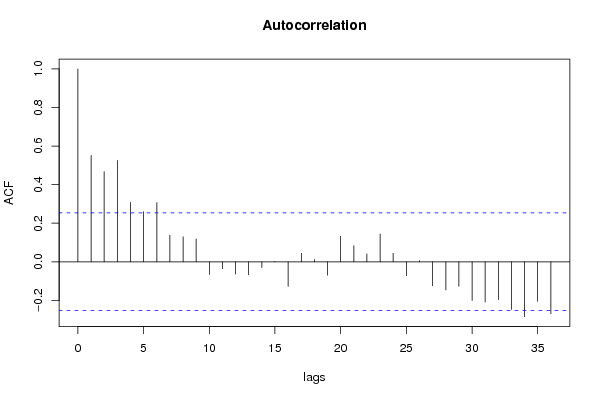
Je gaat alleen maar seizoenaal differentieren en zegt dat je zo de beste tijdreeks uitkomt, maar als je D en d= 1, dan bekom je een nog betere output voor ACF.
Ik heb dit gedaan, zie link voor resultaat: http://www.freestatistics.org/blog/date/2008/Dec/15/t1229354744cpzpshaor7rp1gd.htm
Hier is zeer duidelijk lange termijn trend en het seizoenaal patroon verdwenen, bijna alle coefficienten liggen binnen het 95% betrouwbaarheidsinterval wat bij d = 0 en D=1 niet het geval is!
2008-12-16 19:11:00 [Gert-Jan Geudens] [reply
Niet helemaal correct. we zien hier nog steeds een lineaire trend. In de feeback van Natalie de Wilde, kan je de output na seizonale én niet-seizonale differentiatie terugvinden. Pas na deze beide differtiaties is de tijdreeks stationair.

Post a new message
Dataseries X:
2150.3
2425.7
2642.0
2291.5
2570.7
2526.6
2266.2
1981.9
2630.3
2942.6
2713.4
2437.5
2678.9
2582.0
2780.0
2512.4
2658.4
2708.7
2518.7
2018.3
2579.3
2693.5
2468.8
2122.8
2412.8
2370.6
2642.5
2634.2
2457.5
2579.1
2505.9
1903.2
2660.2
2844.1
2607.1
2356.0
2659.9
2531.4
2845.7
2654.3
2588.2
2789.6
2533.1
1846.5
2796.3
2895.6
2472.2
2584.4
2630.4
2663.1
3176.2
2856.7
2551.4
3088.7
2628.3
2226.2
3023.6
3077.9
3084.1
2990.3
2949.6
3014.7
3517.7
3121.2
3067.4
3174.6
2676.3
2424.0
3195.1
3146.6
3506.7
3528.5


Summary of computational transaction
Raw Inputview raw input (R code)
Raw Outputview raw output of R engine
Computing time1 seconds
R Server'George Udny Yule' @ 72.249.76.132

\begin{tabular}{lllllllll}
\hline
Summary of computational transaction \tabularnewline
Raw Input & view raw input (R code)  \tabularnewline
Raw Output & view raw output of R engine  \tabularnewline
Computing time & 1 seconds \tabularnewline
R Server & 'George Udny Yule' @ 72.249.76.132 \tabularnewline
\hline
\end{tabular}
%Source: https://freestatistics.org/blog/index.php?pk=29368&T=0

[TABLE]
[ROW][C]Summary of computational transaction[/C][/ROW]
[ROW][C]Raw Input[/C][C]view raw input (R code) [/C][/ROW]
[ROW][C]Raw Output[/C][C]view raw output of R engine [/C][/ROW]
[ROW][C]Computing time[/C][C]1 seconds[/C][/ROW]
[ROW][C]R Server[/C][C]'George Udny Yule' @ 72.249.76.132[/C][/ROW]
[/TABLE]
Source: https://freestatistics.org/blog/index.php?pk=29368&T=0

Globally Unique Identifier (entire table): ba.freestatistics.org/blog/index.php?pk=29368&T=0

As an alternative you can also use a QR Code:  

The GUIDs for individual cells are displayed in the table below:

Summary of computational transaction
Raw Inputview raw input (R code)
Raw Outputview raw output of R engine
Computing time1 seconds
R Server'George Udny Yule' @ 72.249.76.132


Autocorrelation Function
Time lag kACF(k)T-STATP-value
10.5516314.27293.5e-05
20.4673983.62050.000303
30.5253724.06957e-05
40.3078942.38490.010129
50.2597562.01210.024355
60.3068372.37680.010336
70.1375481.06540.145473
80.12951.00310.15992
90.1182290.91580.18172
10-0.066014-0.51130.305494
11-0.036163-0.28010.390176
12-0.063538-0.49220.312201
13-0.067725-0.52460.300899
14-0.030051-0.23280.408364
150.0008950.00690.497245
16-0.127496-0.98760.163662
170.0435620.33740.368485
180.0117460.0910.463904
19-0.069484-0.53820.296207
200.1317631.02060.155764
210.083060.64340.261215
220.0405780.31430.377187
230.1435641.1120.135278
240.0438770.33990.367569
25-0.072973-0.56520.287006
260.0060220.04660.481475
27-0.124896-0.96740.168604
28-0.146442-1.13430.130582
29-0.126772-0.9820.165029
30-0.20063-1.55410.062713
31-0.208214-1.61280.056016
32-0.195985-1.51810.067122
33-0.247171-1.91460.030159
34-0.284696-2.20520.01564
35-0.205057-1.58840.05873
36-0.270083-2.09210.020337

\begin{tabular}{lllllllll}
\hline
Autocorrelation Function \tabularnewline
Time lag k & ACF(k) & T-STAT & P-value \tabularnewline
1 & 0.551631 & 4.2729 & 3.5e-05 \tabularnewline
2 & 0.467398 & 3.6205 & 0.000303 \tabularnewline
3 & 0.525372 & 4.0695 & 7e-05 \tabularnewline
4 & 0.307894 & 2.3849 & 0.010129 \tabularnewline
5 & 0.259756 & 2.0121 & 0.024355 \tabularnewline
6 & 0.306837 & 2.3768 & 0.010336 \tabularnewline
7 & 0.137548 & 1.0654 & 0.145473 \tabularnewline
8 & 0.1295 & 1.0031 & 0.15992 \tabularnewline
9 & 0.118229 & 0.9158 & 0.18172 \tabularnewline
10 & -0.066014 & -0.5113 & 0.305494 \tabularnewline
11 & -0.036163 & -0.2801 & 0.390176 \tabularnewline
12 & -0.063538 & -0.4922 & 0.312201 \tabularnewline
13 & -0.067725 & -0.5246 & 0.300899 \tabularnewline
14 & -0.030051 & -0.2328 & 0.408364 \tabularnewline
15 & 0.000895 & 0.0069 & 0.497245 \tabularnewline
16 & -0.127496 & -0.9876 & 0.163662 \tabularnewline
17 & 0.043562 & 0.3374 & 0.368485 \tabularnewline
18 & 0.011746 & 0.091 & 0.463904 \tabularnewline
19 & -0.069484 & -0.5382 & 0.296207 \tabularnewline
20 & 0.131763 & 1.0206 & 0.155764 \tabularnewline
21 & 0.08306 & 0.6434 & 0.261215 \tabularnewline
22 & 0.040578 & 0.3143 & 0.377187 \tabularnewline
23 & 0.143564 & 1.112 & 0.135278 \tabularnewline
24 & 0.043877 & 0.3399 & 0.367569 \tabularnewline
25 & -0.072973 & -0.5652 & 0.287006 \tabularnewline
26 & 0.006022 & 0.0466 & 0.481475 \tabularnewline
27 & -0.124896 & -0.9674 & 0.168604 \tabularnewline
28 & -0.146442 & -1.1343 & 0.130582 \tabularnewline
29 & -0.126772 & -0.982 & 0.165029 \tabularnewline
30 & -0.20063 & -1.5541 & 0.062713 \tabularnewline
31 & -0.208214 & -1.6128 & 0.056016 \tabularnewline
32 & -0.195985 & -1.5181 & 0.067122 \tabularnewline
33 & -0.247171 & -1.9146 & 0.030159 \tabularnewline
34 & -0.284696 & -2.2052 & 0.01564 \tabularnewline
35 & -0.205057 & -1.5884 & 0.05873 \tabularnewline
36 & -0.270083 & -2.0921 & 0.020337 \tabularnewline
\hline
\end{tabular}
%Source: https://freestatistics.org/blog/index.php?pk=29368&T=1

[TABLE]
[ROW][C]Autocorrelation Function[/C][/ROW]
[ROW][C]Time lag k[/C][C]ACF(k)[/C][C]T-STAT[/C][C]P-value[/C][/ROW]
[ROW][C]1[/C][C]0.551631[/C][C]4.2729[/C][C]3.5e-05[/C][/ROW]
[ROW][C]2[/C][C]0.467398[/C][C]3.6205[/C][C]0.000303[/C][/ROW]
[ROW][C]3[/C][C]0.525372[/C][C]4.0695[/C][C]7e-05[/C][/ROW]
[ROW][C]4[/C][C]0.307894[/C][C]2.3849[/C][C]0.010129[/C][/ROW]
[ROW][C]5[/C][C]0.259756[/C][C]2.0121[/C][C]0.024355[/C][/ROW]
[ROW][C]6[/C][C]0.306837[/C][C]2.3768[/C][C]0.010336[/C][/ROW]
[ROW][C]7[/C][C]0.137548[/C][C]1.0654[/C][C]0.145473[/C][/ROW]
[ROW][C]8[/C][C]0.1295[/C][C]1.0031[/C][C]0.15992[/C][/ROW]
[ROW][C]9[/C][C]0.118229[/C][C]0.9158[/C][C]0.18172[/C][/ROW]
[ROW][C]10[/C][C]-0.066014[/C][C]-0.5113[/C][C]0.305494[/C][/ROW]
[ROW][C]11[/C][C]-0.036163[/C][C]-0.2801[/C][C]0.390176[/C][/ROW]
[ROW][C]12[/C][C]-0.063538[/C][C]-0.4922[/C][C]0.312201[/C][/ROW]
[ROW][C]13[/C][C]-0.067725[/C][C]-0.5246[/C][C]0.300899[/C][/ROW]
[ROW][C]14[/C][C]-0.030051[/C][C]-0.2328[/C][C]0.408364[/C][/ROW]
[ROW][C]15[/C][C]0.000895[/C][C]0.0069[/C][C]0.497245[/C][/ROW]
[ROW][C]16[/C][C]-0.127496[/C][C]-0.9876[/C][C]0.163662[/C][/ROW]
[ROW][C]17[/C][C]0.043562[/C][C]0.3374[/C][C]0.368485[/C][/ROW]
[ROW][C]18[/C][C]0.011746[/C][C]0.091[/C][C]0.463904[/C][/ROW]
[ROW][C]19[/C][C]-0.069484[/C][C]-0.5382[/C][C]0.296207[/C][/ROW]
[ROW][C]20[/C][C]0.131763[/C][C]1.0206[/C][C]0.155764[/C][/ROW]
[ROW][C]21[/C][C]0.08306[/C][C]0.6434[/C][C]0.261215[/C][/ROW]
[ROW][C]22[/C][C]0.040578[/C][C]0.3143[/C][C]0.377187[/C][/ROW]
[ROW][C]23[/C][C]0.143564[/C][C]1.112[/C][C]0.135278[/C][/ROW]
[ROW][C]24[/C][C]0.043877[/C][C]0.3399[/C][C]0.367569[/C][/ROW]
[ROW][C]25[/C][C]-0.072973[/C][C]-0.5652[/C][C]0.287006[/C][/ROW]
[ROW][C]26[/C][C]0.006022[/C][C]0.0466[/C][C]0.481475[/C][/ROW]
[ROW][C]27[/C][C]-0.124896[/C][C]-0.9674[/C][C]0.168604[/C][/ROW]
[ROW][C]28[/C][C]-0.146442[/C][C]-1.1343[/C][C]0.130582[/C][/ROW]
[ROW][C]29[/C][C]-0.126772[/C][C]-0.982[/C][C]0.165029[/C][/ROW]
[ROW][C]30[/C][C]-0.20063[/C][C]-1.5541[/C][C]0.062713[/C][/ROW]
[ROW][C]31[/C][C]-0.208214[/C][C]-1.6128[/C][C]0.056016[/C][/ROW]
[ROW][C]32[/C][C]-0.195985[/C][C]-1.5181[/C][C]0.067122[/C][/ROW]
[ROW][C]33[/C][C]-0.247171[/C][C]-1.9146[/C][C]0.030159[/C][/ROW]
[ROW][C]34[/C][C]-0.284696[/C][C]-2.2052[/C][C]0.01564[/C][/ROW]
[ROW][C]35[/C][C]-0.205057[/C][C]-1.5884[/C][C]0.05873[/C][/ROW]
[ROW][C]36[/C][C]-0.270083[/C][C]-2.0921[/C][C]0.020337[/C][/ROW]
[/TABLE]
Source: https://freestatistics.org/blog/index.php?pk=29368&T=1

Globally Unique Identifier (entire table): ba.freestatistics.org/blog/index.php?pk=29368&T=1

As an alternative you can also use a QR Code:  

The GUIDs for individual cells are displayed in the table below:

Autocorrelation Function
Time lag kACF(k)T-STATP-value
10.5516314.27293.5e-05
20.4673983.62050.000303
30.5253724.06957e-05
40.3078942.38490.010129
50.2597562.01210.024355
60.3068372.37680.010336
70.1375481.06540.145473
80.12951.00310.15992
90.1182290.91580.18172
10-0.066014-0.51130.305494
11-0.036163-0.28010.390176
12-0.063538-0.49220.312201
13-0.067725-0.52460.300899
14-0.030051-0.23280.408364
150.0008950.00690.497245
16-0.127496-0.98760.163662
170.0435620.33740.368485
180.0117460.0910.463904
19-0.069484-0.53820.296207
200.1317631.02060.155764
210.083060.64340.261215
220.0405780.31430.377187
230.1435641.1120.135278
240.0438770.33990.367569
25-0.072973-0.56520.287006
260.0060220.04660.481475
27-0.124896-0.96740.168604
28-0.146442-1.13430.130582
29-0.126772-0.9820.165029
30-0.20063-1.55410.062713
31-0.208214-1.61280.056016
32-0.195985-1.51810.067122
33-0.247171-1.91460.030159
34-0.284696-2.20520.01564
35-0.205057-1.58840.05873
36-0.270083-2.09210.020337


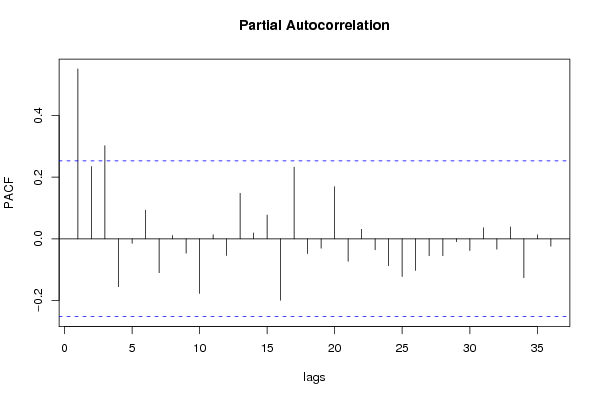
Partial Autocorrelation Function
Time lag kPACF(k)T-STATP-value
10.5516314.27293.5e-05
20.2344411.8160.037186
30.3021642.34050.011299
4-0.156291-1.21060.115393
5-0.014738-0.11420.454746
60.0928190.7190.237474
7-0.110168-0.85340.198428
80.0106130.08220.467378
9-0.04691-0.36340.358806
10-0.177815-1.37730.08676
110.0133070.10310.459122
12-0.054243-0.42020.337932
130.1475231.14270.128849
140.0187580.14530.442482
150.0769560.59610.276676
16-0.199415-1.54470.063843
170.2323661.79990.038452
18-0.048029-0.3720.355591
19-0.030793-0.23850.406144
200.1692571.31110.097416
21-0.073414-0.56870.285854
220.0307420.23810.406298
23-0.036081-0.27950.390417
24-0.087276-0.6760.250808
25-0.122395-0.94810.173449
26-0.103061-0.79830.21392
27-0.054796-0.42440.336378
28-0.054956-0.42570.335928
29-0.009378-0.07260.471166
30-0.038207-0.2960.384144
310.0354280.27440.392351
32-0.033716-0.26120.39743
330.0382410.29620.384046
34-0.126603-0.98070.165348
350.0128430.09950.460545
36-0.02426-0.18790.425789

\begin{tabular}{lllllllll}
\hline
Partial Autocorrelation Function \tabularnewline
Time lag k & PACF(k) & T-STAT & P-value \tabularnewline
1 & 0.551631 & 4.2729 & 3.5e-05 \tabularnewline
2 & 0.234441 & 1.816 & 0.037186 \tabularnewline
3 & 0.302164 & 2.3405 & 0.011299 \tabularnewline
4 & -0.156291 & -1.2106 & 0.115393 \tabularnewline
5 & -0.014738 & -0.1142 & 0.454746 \tabularnewline
6 & 0.092819 & 0.719 & 0.237474 \tabularnewline
7 & -0.110168 & -0.8534 & 0.198428 \tabularnewline
8 & 0.010613 & 0.0822 & 0.467378 \tabularnewline
9 & -0.04691 & -0.3634 & 0.358806 \tabularnewline
10 & -0.177815 & -1.3773 & 0.08676 \tabularnewline
11 & 0.013307 & 0.1031 & 0.459122 \tabularnewline
12 & -0.054243 & -0.4202 & 0.337932 \tabularnewline
13 & 0.147523 & 1.1427 & 0.128849 \tabularnewline
14 & 0.018758 & 0.1453 & 0.442482 \tabularnewline
15 & 0.076956 & 0.5961 & 0.276676 \tabularnewline
16 & -0.199415 & -1.5447 & 0.063843 \tabularnewline
17 & 0.232366 & 1.7999 & 0.038452 \tabularnewline
18 & -0.048029 & -0.372 & 0.355591 \tabularnewline
19 & -0.030793 & -0.2385 & 0.406144 \tabularnewline
20 & 0.169257 & 1.3111 & 0.097416 \tabularnewline
21 & -0.073414 & -0.5687 & 0.285854 \tabularnewline
22 & 0.030742 & 0.2381 & 0.406298 \tabularnewline
23 & -0.036081 & -0.2795 & 0.390417 \tabularnewline
24 & -0.087276 & -0.676 & 0.250808 \tabularnewline
25 & -0.122395 & -0.9481 & 0.173449 \tabularnewline
26 & -0.103061 & -0.7983 & 0.21392 \tabularnewline
27 & -0.054796 & -0.4244 & 0.336378 \tabularnewline
28 & -0.054956 & -0.4257 & 0.335928 \tabularnewline
29 & -0.009378 & -0.0726 & 0.471166 \tabularnewline
30 & -0.038207 & -0.296 & 0.384144 \tabularnewline
31 & 0.035428 & 0.2744 & 0.392351 \tabularnewline
32 & -0.033716 & -0.2612 & 0.39743 \tabularnewline
33 & 0.038241 & 0.2962 & 0.384046 \tabularnewline
34 & -0.126603 & -0.9807 & 0.165348 \tabularnewline
35 & 0.012843 & 0.0995 & 0.460545 \tabularnewline
36 & -0.02426 & -0.1879 & 0.425789 \tabularnewline
\hline
\end{tabular}
%Source: https://freestatistics.org/blog/index.php?pk=29368&T=2

[TABLE]
[ROW][C]Partial Autocorrelation Function[/C][/ROW]
[ROW][C]Time lag k[/C][C]PACF(k)[/C][C]T-STAT[/C][C]P-value[/C][/ROW]
[ROW][C]1[/C][C]0.551631[/C][C]4.2729[/C][C]3.5e-05[/C][/ROW]
[ROW][C]2[/C][C]0.234441[/C][C]1.816[/C][C]0.037186[/C][/ROW]
[ROW][C]3[/C][C]0.302164[/C][C]2.3405[/C][C]0.011299[/C][/ROW]
[ROW][C]4[/C][C]-0.156291[/C][C]-1.2106[/C][C]0.115393[/C][/ROW]
[ROW][C]5[/C][C]-0.014738[/C][C]-0.1142[/C][C]0.454746[/C][/ROW]
[ROW][C]6[/C][C]0.092819[/C][C]0.719[/C][C]0.237474[/C][/ROW]
[ROW][C]7[/C][C]-0.110168[/C][C]-0.8534[/C][C]0.198428[/C][/ROW]
[ROW][C]8[/C][C]0.010613[/C][C]0.0822[/C][C]0.467378[/C][/ROW]
[ROW][C]9[/C][C]-0.04691[/C][C]-0.3634[/C][C]0.358806[/C][/ROW]
[ROW][C]10[/C][C]-0.177815[/C][C]-1.3773[/C][C]0.08676[/C][/ROW]
[ROW][C]11[/C][C]0.013307[/C][C]0.1031[/C][C]0.459122[/C][/ROW]
[ROW][C]12[/C][C]-0.054243[/C][C]-0.4202[/C][C]0.337932[/C][/ROW]
[ROW][C]13[/C][C]0.147523[/C][C]1.1427[/C][C]0.128849[/C][/ROW]
[ROW][C]14[/C][C]0.018758[/C][C]0.1453[/C][C]0.442482[/C][/ROW]
[ROW][C]15[/C][C]0.076956[/C][C]0.5961[/C][C]0.276676[/C][/ROW]
[ROW][C]16[/C][C]-0.199415[/C][C]-1.5447[/C][C]0.063843[/C][/ROW]
[ROW][C]17[/C][C]0.232366[/C][C]1.7999[/C][C]0.038452[/C][/ROW]
[ROW][C]18[/C][C]-0.048029[/C][C]-0.372[/C][C]0.355591[/C][/ROW]
[ROW][C]19[/C][C]-0.030793[/C][C]-0.2385[/C][C]0.406144[/C][/ROW]
[ROW][C]20[/C][C]0.169257[/C][C]1.3111[/C][C]0.097416[/C][/ROW]
[ROW][C]21[/C][C]-0.073414[/C][C]-0.5687[/C][C]0.285854[/C][/ROW]
[ROW][C]22[/C][C]0.030742[/C][C]0.2381[/C][C]0.406298[/C][/ROW]
[ROW][C]23[/C][C]-0.036081[/C][C]-0.2795[/C][C]0.390417[/C][/ROW]
[ROW][C]24[/C][C]-0.087276[/C][C]-0.676[/C][C]0.250808[/C][/ROW]
[ROW][C]25[/C][C]-0.122395[/C][C]-0.9481[/C][C]0.173449[/C][/ROW]
[ROW][C]26[/C][C]-0.103061[/C][C]-0.7983[/C][C]0.21392[/C][/ROW]
[ROW][C]27[/C][C]-0.054796[/C][C]-0.4244[/C][C]0.336378[/C][/ROW]
[ROW][C]28[/C][C]-0.054956[/C][C]-0.4257[/C][C]0.335928[/C][/ROW]
[ROW][C]29[/C][C]-0.009378[/C][C]-0.0726[/C][C]0.471166[/C][/ROW]
[ROW][C]30[/C][C]-0.038207[/C][C]-0.296[/C][C]0.384144[/C][/ROW]
[ROW][C]31[/C][C]0.035428[/C][C]0.2744[/C][C]0.392351[/C][/ROW]
[ROW][C]32[/C][C]-0.033716[/C][C]-0.2612[/C][C]0.39743[/C][/ROW]
[ROW][C]33[/C][C]0.038241[/C][C]0.2962[/C][C]0.384046[/C][/ROW]
[ROW][C]34[/C][C]-0.126603[/C][C]-0.9807[/C][C]0.165348[/C][/ROW]
[ROW][C]35[/C][C]0.012843[/C][C]0.0995[/C][C]0.460545[/C][/ROW]
[ROW][C]36[/C][C]-0.02426[/C][C]-0.1879[/C][C]0.425789[/C][/ROW]
[/TABLE]
Source: https://freestatistics.org/blog/index.php?pk=29368&T=2

Globally Unique Identifier (entire table): ba.freestatistics.org/blog/index.php?pk=29368&T=2

As an alternative you can also use a QR Code:  

The GUIDs for individual cells are displayed in the table below:

Partial Autocorrelation Function
Time lag kPACF(k)T-STATP-value
10.5516314.27293.5e-05
20.2344411.8160.037186
30.3021642.34050.011299
4-0.156291-1.21060.115393
5-0.014738-0.11420.454746
60.0928190.7190.237474
7-0.110168-0.85340.198428
80.0106130.08220.467378
9-0.04691-0.36340.358806
10-0.177815-1.37730.08676
110.0133070.10310.459122
12-0.054243-0.42020.337932
130.1475231.14270.128849
140.0187580.14530.442482
150.0769560.59610.276676
16-0.199415-1.54470.063843
170.2323661.79990.038452
18-0.048029-0.3720.355591
19-0.030793-0.23850.406144
200.1692571.31110.097416
21-0.073414-0.56870.285854
220.0307420.23810.406298
23-0.036081-0.27950.390417
24-0.087276-0.6760.250808
25-0.122395-0.94810.173449
26-0.103061-0.79830.21392
27-0.054796-0.42440.336378
28-0.054956-0.42570.335928
29-0.009378-0.07260.471166
30-0.038207-0.2960.384144
310.0354280.27440.392351
32-0.033716-0.26120.39743
330.0382410.29620.384046
34-0.126603-0.98070.165348
350.0128430.09950.460545
36-0.02426-0.18790.425789


Parameters (Session):
par1 = 36 ; par2 = 1 ; par3 = 0 ; par4 = 1 ; par5 = 12 ;
Parameters (R input):
par1 = 36 ; par2 = 1 ; par3 = 0 ; par4 = 1 ; par5 = 12 ;
R code (references can be found in the software module):
if (par1 == 'Default') {
par1 = 10*log10(length(x))
} else {
par1 <- as.numeric(par1)
}
par2 <- as.numeric(par2)
par3 <- as.numeric(par3)
par4 <- as.numeric(par4)
par5 <- as.numeric(par5)
if (par2 == 0) {
x <- log(x)
} else {
x <- (x ^ par2 - 1) / par2
}
if (par3 > 0) x <- diff(x,lag=1,difference=par3)
if (par4 > 0) x <- diff(x,lag=par5,difference=par4)
bitmap(file='pic1.png')
racf <- acf(x,par1,main='Autocorrelation',xlab='lags',ylab='ACF')
dev.off()
bitmap(file='pic2.png')
rpacf <- pacf(x,par1,main='Partial Autocorrelation',xlab='lags',ylab='PACF')
dev.off()
(myacf <- c(racf$acf))
(mypacf <- c(rpacf$acf))
lengthx <- length(x)
sqrtn <- sqrt(lengthx)
load(file='createtable')
a<-table.start()
a<-table.row.start(a)
a<-table.element(a,'Autocorrelation Function',4,TRUE)
a<-table.row.end(a)
a<-table.row.start(a)
a<-table.element(a,'Time lag k',header=TRUE)
a<-table.element(a,hyperlink('basics.htm','ACF(k)','click here for more information about the Autocorrelation Function'),header=TRUE)
a<-table.element(a,'T-STAT',header=TRUE)
a<-table.element(a,'P-value',header=TRUE)
a<-table.row.end(a)
for (i in 2:(par1+1)) {
a<-table.row.start(a)
a<-table.element(a,i-1,header=TRUE)
a<-table.element(a,round(myacf[i],6))
mytstat <- myacf[i]*sqrtn
a<-table.element(a,round(mytstat,4))
a<-table.element(a,round(1-pt(abs(mytstat),lengthx),6))
a<-table.row.end(a)
}
a<-table.end(a)
table.save(a,file='mytable.tab')
a<-table.start()
a<-table.row.start(a)
a<-table.element(a,'Partial Autocorrelation Function',4,TRUE)
a<-table.row.end(a)
a<-table.row.start(a)
a<-table.element(a,'Time lag k',header=TRUE)
a<-table.element(a,hyperlink('basics.htm','PACF(k)','click here for more information about the Partial Autocorrelation Function'),header=TRUE)
a<-table.element(a,'T-STAT',header=TRUE)
a<-table.element(a,'P-value',header=TRUE)
a<-table.row.end(a)
for (i in 1:par1) {
a<-table.row.start(a)
a<-table.element(a,i,header=TRUE)
a<-table.element(a,round(mypacf[i],6))
mytstat <- mypacf[i]*sqrtn
a<-table.element(a,round(mytstat,4))
a<-table.element(a,round(1-pt(abs(mytstat),lengthx),6))
a<-table.row.end(a)
}
a<-table.end(a)
table.save(a,file='mytable1.tab')