Free Statistics

of Irreproducible Research!

Author's title

Author*The author of this computation has been verified*
R Software Modulerwasp_autocorrelation.wasp
Title produced by software(Partial) Autocorrelation Function
Date of computationFri, 05 Dec 2008 10:51:28 -0700
Cite this page as followsStatistical Computations at FreeStatistics.org, Office for Research Development and Education, URL https://freestatistics.org/blog/index.php?v=date/2008/Dec/05/t1228499618kqmck0hxm0ak1g3.htm/, Retrieved Thu, 16 May 2024 06:21:28 +0000
Statistical Computations at FreeStatistics.org, Office for Research Development and Education, URL https://freestatistics.org/blog/index.php?pk=29365, Retrieved Thu, 16 May 2024 06:21:28 +0000
QR Codes:

Original text written by user:
IsPrivate?No (this computation is public)
User-defined keywords
Estimated Impact184
Family? (F = Feedback message, R = changed R code, M = changed R Module, P = changed Parameters, D = changed Data)
F     [Variance Reduction Matrix] [step 2 uitvoer] [2008-12-05 17:47:26] [3a9fc6d5b5e0e816787b7dbace57e7cd]
F RMPD    [(Partial) Autocorrelation Function] [step 2 uitvoer] [2008-12-05 17:51:28] [821c4b3d195be8e737cf8c9dc649d3cf] [Current]
-   P       [(Partial) Autocorrelation Function] [ACF] [2008-12-15 15:22:55] [415d0222c17b651a9576eaac006f530d]
Feedback Forum
2008-12-15 15:25:09 [Natalie De Wilde] [reply
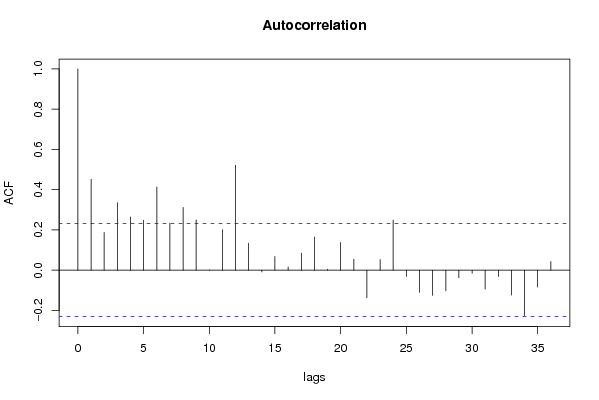
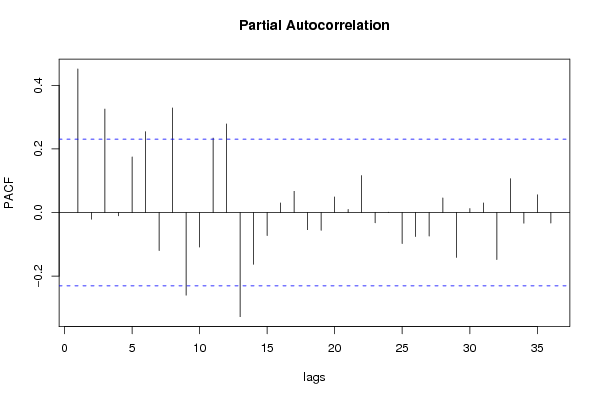
We zien inderdaad een seizoenale trend, maar je zegt dat er geen lange termijn trend is.De coefficienten vertonen een lichte daling. We moeten hier abstractie maken van enkele coefficienten, maar het er is toch wel een lange termijn trend te zien ook.
2008-12-16 19:08:51 [Gert-Jan Geudens] [reply
Niet helemaal correct. Er is hier wel een lineaire trend. Je zal dus ook niet-seizonaal moeten differentiëren. Tevens is de seizonaliteit hier inderdaad zeer duidelijk zichtbaar.

Post a new message
Dataseries X:
2150.3
2425.7
2642.0
2291.5
2570.7
2526.6
2266.2
1981.9
2630.3
2942.6
2713.4
2437.5
2678.9
2582.0
2780.0
2512.4
2658.4
2708.7
2518.7
2018.3
2579.3
2693.5
2468.8
2122.8
2412.8
2370.6
2642.5
2634.2
2457.5
2579.1
2505.9
1903.2
2660.2
2844.1
2607.1
2356.0
2659.9
2531.4
2845.7
2654.3
2588.2
2789.6
2533.1
1846.5
2796.3
2895.6
2472.2
2584.4
2630.4
2663.1
3176.2
2856.7
2551.4
3088.7
2628.3
2226.2
3023.6
3077.9
3084.1
2990.3
2949.6
3014.7
3517.7
3121.2
3067.4
3174.6
2676.3
2424.0
3195.1
3146.6
3506.7
3528.5


Summary of computational transaction
Raw Inputview raw input (R code)
Raw Outputview raw output of R engine
Computing time2 seconds
R Server'Sir Ronald Aylmer Fisher' @ 193.190.124.24

\begin{tabular}{lllllllll}
\hline
Summary of computational transaction \tabularnewline
Raw Input & view raw input (R code)  \tabularnewline
Raw Output & view raw output of R engine  \tabularnewline
Computing time & 2 seconds \tabularnewline
R Server & 'Sir Ronald Aylmer Fisher' @ 193.190.124.24 \tabularnewline
\hline
\end{tabular}
%Source: https://freestatistics.org/blog/index.php?pk=29365&T=0

[TABLE]
[ROW][C]Summary of computational transaction[/C][/ROW]
[ROW][C]Raw Input[/C][C]view raw input (R code) [/C][/ROW]
[ROW][C]Raw Output[/C][C]view raw output of R engine [/C][/ROW]
[ROW][C]Computing time[/C][C]2 seconds[/C][/ROW]
[ROW][C]R Server[/C][C]'Sir Ronald Aylmer Fisher' @ 193.190.124.24[/C][/ROW]
[/TABLE]
Source: https://freestatistics.org/blog/index.php?pk=29365&T=0

Globally Unique Identifier (entire table): ba.freestatistics.org/blog/index.php?pk=29365&T=0

As an alternative you can also use a QR Code:  

The GUIDs for individual cells are displayed in the table below:

Summary of computational transaction
Raw Inputview raw input (R code)
Raw Outputview raw output of R engine
Computing time2 seconds
R Server'Sir Ronald Aylmer Fisher' @ 193.190.124.24


Autocorrelation Function
Time lag kACF(k)T-STATP-value
10.4512833.82930.000136
20.1869791.58660.058497
30.3354482.84640.002878
40.2643932.24340.013973
50.2479352.10380.019445
60.4139213.51220.000386
70.2331551.97840.025856
80.3113242.64170.005056
90.2497282.1190.01877
100.0007210.00610.497566
110.201271.70780.045988
120.520944.42031.7e-05
130.1338731.1360.129872
14-0.008617-0.07310.470958
150.0678240.57550.283371
160.0162740.13810.445277
170.0845180.71720.237799
180.1650871.40080.082784
190.0046690.03960.484253
200.1377031.16840.12324
210.0548050.4650.321655
22-0.137514-1.16680.123561
230.0526970.44710.328055
240.2488092.11120.019113
25-0.031557-0.26780.394822
26-0.110443-0.93710.17591
27-0.12431-1.05480.147521
28-0.102845-0.87270.192872
29-0.037377-0.31720.376022
30-0.015875-0.13470.446612
31-0.094428-0.80120.212813
32-0.031653-0.26860.39451
33-0.123243-1.04580.149586
34-0.225342-1.91210.029922
35-0.083384-0.70750.240759
360.0432290.36680.357419

\begin{tabular}{lllllllll}
\hline
Autocorrelation Function \tabularnewline
Time lag k & ACF(k) & T-STAT & P-value \tabularnewline
1 & 0.451283 & 3.8293 & 0.000136 \tabularnewline
2 & 0.186979 & 1.5866 & 0.058497 \tabularnewline
3 & 0.335448 & 2.8464 & 0.002878 \tabularnewline
4 & 0.264393 & 2.2434 & 0.013973 \tabularnewline
5 & 0.247935 & 2.1038 & 0.019445 \tabularnewline
6 & 0.413921 & 3.5122 & 0.000386 \tabularnewline
7 & 0.233155 & 1.9784 & 0.025856 \tabularnewline
8 & 0.311324 & 2.6417 & 0.005056 \tabularnewline
9 & 0.249728 & 2.119 & 0.01877 \tabularnewline
10 & 0.000721 & 0.0061 & 0.497566 \tabularnewline
11 & 0.20127 & 1.7078 & 0.045988 \tabularnewline
12 & 0.52094 & 4.4203 & 1.7e-05 \tabularnewline
13 & 0.133873 & 1.136 & 0.129872 \tabularnewline
14 & -0.008617 & -0.0731 & 0.470958 \tabularnewline
15 & 0.067824 & 0.5755 & 0.283371 \tabularnewline
16 & 0.016274 & 0.1381 & 0.445277 \tabularnewline
17 & 0.084518 & 0.7172 & 0.237799 \tabularnewline
18 & 0.165087 & 1.4008 & 0.082784 \tabularnewline
19 & 0.004669 & 0.0396 & 0.484253 \tabularnewline
20 & 0.137703 & 1.1684 & 0.12324 \tabularnewline
21 & 0.054805 & 0.465 & 0.321655 \tabularnewline
22 & -0.137514 & -1.1668 & 0.123561 \tabularnewline
23 & 0.052697 & 0.4471 & 0.328055 \tabularnewline
24 & 0.248809 & 2.1112 & 0.019113 \tabularnewline
25 & -0.031557 & -0.2678 & 0.394822 \tabularnewline
26 & -0.110443 & -0.9371 & 0.17591 \tabularnewline
27 & -0.12431 & -1.0548 & 0.147521 \tabularnewline
28 & -0.102845 & -0.8727 & 0.192872 \tabularnewline
29 & -0.037377 & -0.3172 & 0.376022 \tabularnewline
30 & -0.015875 & -0.1347 & 0.446612 \tabularnewline
31 & -0.094428 & -0.8012 & 0.212813 \tabularnewline
32 & -0.031653 & -0.2686 & 0.39451 \tabularnewline
33 & -0.123243 & -1.0458 & 0.149586 \tabularnewline
34 & -0.225342 & -1.9121 & 0.029922 \tabularnewline
35 & -0.083384 & -0.7075 & 0.240759 \tabularnewline
36 & 0.043229 & 0.3668 & 0.357419 \tabularnewline
\hline
\end{tabular}
%Source: https://freestatistics.org/blog/index.php?pk=29365&T=1

[TABLE]
[ROW][C]Autocorrelation Function[/C][/ROW]
[ROW][C]Time lag k[/C][C]ACF(k)[/C][C]T-STAT[/C][C]P-value[/C][/ROW]
[ROW][C]1[/C][C]0.451283[/C][C]3.8293[/C][C]0.000136[/C][/ROW]
[ROW][C]2[/C][C]0.186979[/C][C]1.5866[/C][C]0.058497[/C][/ROW]
[ROW][C]3[/C][C]0.335448[/C][C]2.8464[/C][C]0.002878[/C][/ROW]
[ROW][C]4[/C][C]0.264393[/C][C]2.2434[/C][C]0.013973[/C][/ROW]
[ROW][C]5[/C][C]0.247935[/C][C]2.1038[/C][C]0.019445[/C][/ROW]
[ROW][C]6[/C][C]0.413921[/C][C]3.5122[/C][C]0.000386[/C][/ROW]
[ROW][C]7[/C][C]0.233155[/C][C]1.9784[/C][C]0.025856[/C][/ROW]
[ROW][C]8[/C][C]0.311324[/C][C]2.6417[/C][C]0.005056[/C][/ROW]
[ROW][C]9[/C][C]0.249728[/C][C]2.119[/C][C]0.01877[/C][/ROW]
[ROW][C]10[/C][C]0.000721[/C][C]0.0061[/C][C]0.497566[/C][/ROW]
[ROW][C]11[/C][C]0.20127[/C][C]1.7078[/C][C]0.045988[/C][/ROW]
[ROW][C]12[/C][C]0.52094[/C][C]4.4203[/C][C]1.7e-05[/C][/ROW]
[ROW][C]13[/C][C]0.133873[/C][C]1.136[/C][C]0.129872[/C][/ROW]
[ROW][C]14[/C][C]-0.008617[/C][C]-0.0731[/C][C]0.470958[/C][/ROW]
[ROW][C]15[/C][C]0.067824[/C][C]0.5755[/C][C]0.283371[/C][/ROW]
[ROW][C]16[/C][C]0.016274[/C][C]0.1381[/C][C]0.445277[/C][/ROW]
[ROW][C]17[/C][C]0.084518[/C][C]0.7172[/C][C]0.237799[/C][/ROW]
[ROW][C]18[/C][C]0.165087[/C][C]1.4008[/C][C]0.082784[/C][/ROW]
[ROW][C]19[/C][C]0.004669[/C][C]0.0396[/C][C]0.484253[/C][/ROW]
[ROW][C]20[/C][C]0.137703[/C][C]1.1684[/C][C]0.12324[/C][/ROW]
[ROW][C]21[/C][C]0.054805[/C][C]0.465[/C][C]0.321655[/C][/ROW]
[ROW][C]22[/C][C]-0.137514[/C][C]-1.1668[/C][C]0.123561[/C][/ROW]
[ROW][C]23[/C][C]0.052697[/C][C]0.4471[/C][C]0.328055[/C][/ROW]
[ROW][C]24[/C][C]0.248809[/C][C]2.1112[/C][C]0.019113[/C][/ROW]
[ROW][C]25[/C][C]-0.031557[/C][C]-0.2678[/C][C]0.394822[/C][/ROW]
[ROW][C]26[/C][C]-0.110443[/C][C]-0.9371[/C][C]0.17591[/C][/ROW]
[ROW][C]27[/C][C]-0.12431[/C][C]-1.0548[/C][C]0.147521[/C][/ROW]
[ROW][C]28[/C][C]-0.102845[/C][C]-0.8727[/C][C]0.192872[/C][/ROW]
[ROW][C]29[/C][C]-0.037377[/C][C]-0.3172[/C][C]0.376022[/C][/ROW]
[ROW][C]30[/C][C]-0.015875[/C][C]-0.1347[/C][C]0.446612[/C][/ROW]
[ROW][C]31[/C][C]-0.094428[/C][C]-0.8012[/C][C]0.212813[/C][/ROW]
[ROW][C]32[/C][C]-0.031653[/C][C]-0.2686[/C][C]0.39451[/C][/ROW]
[ROW][C]33[/C][C]-0.123243[/C][C]-1.0458[/C][C]0.149586[/C][/ROW]
[ROW][C]34[/C][C]-0.225342[/C][C]-1.9121[/C][C]0.029922[/C][/ROW]
[ROW][C]35[/C][C]-0.083384[/C][C]-0.7075[/C][C]0.240759[/C][/ROW]
[ROW][C]36[/C][C]0.043229[/C][C]0.3668[/C][C]0.357419[/C][/ROW]
[/TABLE]
Source: https://freestatistics.org/blog/index.php?pk=29365&T=1

Globally Unique Identifier (entire table): ba.freestatistics.org/blog/index.php?pk=29365&T=1

As an alternative you can also use a QR Code:  

The GUIDs for individual cells are displayed in the table below:

Autocorrelation Function
Time lag kACF(k)T-STATP-value
10.4512833.82930.000136
20.1869791.58660.058497
30.3354482.84640.002878
40.2643932.24340.013973
50.2479352.10380.019445
60.4139213.51220.000386
70.2331551.97840.025856
80.3113242.64170.005056
90.2497282.1190.01877
100.0007210.00610.497566
110.201271.70780.045988
120.520944.42031.7e-05
130.1338731.1360.129872
14-0.008617-0.07310.470958
150.0678240.57550.283371
160.0162740.13810.445277
170.0845180.71720.237799
180.1650871.40080.082784
190.0046690.03960.484253
200.1377031.16840.12324
210.0548050.4650.321655
22-0.137514-1.16680.123561
230.0526970.44710.328055
240.2488092.11120.019113
25-0.031557-0.26780.394822
26-0.110443-0.93710.17591
27-0.12431-1.05480.147521
28-0.102845-0.87270.192872
29-0.037377-0.31720.376022
30-0.015875-0.13470.446612
31-0.094428-0.80120.212813
32-0.031653-0.26860.39451
33-0.123243-1.04580.149586
34-0.225342-1.91210.029922
35-0.083384-0.70750.240759
360.0432290.36680.357419


Partial Autocorrelation Function
Time lag kPACF(k)T-STATP-value
10.4512833.82930.000136
2-0.020942-0.17770.429728
30.3250662.75830.00368
4-0.010142-0.08610.465829
50.174491.48060.071538
60.2540642.15580.017221
7-0.119824-1.01670.156341
80.3285782.78810.003389
9-0.259834-2.20480.015333
10-0.10886-0.92370.179363
110.2339011.98470.025494
120.2784962.36310.010413
13-0.327467-2.77860.003479
14-0.162639-1.380.085923
15-0.072154-0.61220.271151
160.029950.25410.400057
170.0664490.56380.287308
18-0.054052-0.45860.323935
19-0.056189-0.47680.317482
200.0490890.41650.339128
210.0092810.07880.468723
220.1159950.98420.164145
23-0.032081-0.27220.393118
240.0003150.00270.498939
25-0.097786-0.82970.204715
26-0.075868-0.64380.260888
27-0.073987-0.62780.266062
280.0454360.38550.350488
29-0.141253-1.19860.117313
300.01220.10350.458919
310.0298770.25350.400297
32-0.147632-1.25270.107185
330.1062110.90120.185235
34-0.033481-0.28410.388577
350.0555380.47130.319443
36-0.033214-0.28180.389441

\begin{tabular}{lllllllll}
\hline
Partial Autocorrelation Function \tabularnewline
Time lag k & PACF(k) & T-STAT & P-value \tabularnewline
1 & 0.451283 & 3.8293 & 0.000136 \tabularnewline
2 & -0.020942 & -0.1777 & 0.429728 \tabularnewline
3 & 0.325066 & 2.7583 & 0.00368 \tabularnewline
4 & -0.010142 & -0.0861 & 0.465829 \tabularnewline
5 & 0.17449 & 1.4806 & 0.071538 \tabularnewline
6 & 0.254064 & 2.1558 & 0.017221 \tabularnewline
7 & -0.119824 & -1.0167 & 0.156341 \tabularnewline
8 & 0.328578 & 2.7881 & 0.003389 \tabularnewline
9 & -0.259834 & -2.2048 & 0.015333 \tabularnewline
10 & -0.10886 & -0.9237 & 0.179363 \tabularnewline
11 & 0.233901 & 1.9847 & 0.025494 \tabularnewline
12 & 0.278496 & 2.3631 & 0.010413 \tabularnewline
13 & -0.327467 & -2.7786 & 0.003479 \tabularnewline
14 & -0.162639 & -1.38 & 0.085923 \tabularnewline
15 & -0.072154 & -0.6122 & 0.271151 \tabularnewline
16 & 0.02995 & 0.2541 & 0.400057 \tabularnewline
17 & 0.066449 & 0.5638 & 0.287308 \tabularnewline
18 & -0.054052 & -0.4586 & 0.323935 \tabularnewline
19 & -0.056189 & -0.4768 & 0.317482 \tabularnewline
20 & 0.049089 & 0.4165 & 0.339128 \tabularnewline
21 & 0.009281 & 0.0788 & 0.468723 \tabularnewline
22 & 0.115995 & 0.9842 & 0.164145 \tabularnewline
23 & -0.032081 & -0.2722 & 0.393118 \tabularnewline
24 & 0.000315 & 0.0027 & 0.498939 \tabularnewline
25 & -0.097786 & -0.8297 & 0.204715 \tabularnewline
26 & -0.075868 & -0.6438 & 0.260888 \tabularnewline
27 & -0.073987 & -0.6278 & 0.266062 \tabularnewline
28 & 0.045436 & 0.3855 & 0.350488 \tabularnewline
29 & -0.141253 & -1.1986 & 0.117313 \tabularnewline
30 & 0.0122 & 0.1035 & 0.458919 \tabularnewline
31 & 0.029877 & 0.2535 & 0.400297 \tabularnewline
32 & -0.147632 & -1.2527 & 0.107185 \tabularnewline
33 & 0.106211 & 0.9012 & 0.185235 \tabularnewline
34 & -0.033481 & -0.2841 & 0.388577 \tabularnewline
35 & 0.055538 & 0.4713 & 0.319443 \tabularnewline
36 & -0.033214 & -0.2818 & 0.389441 \tabularnewline
\hline
\end{tabular}
%Source: https://freestatistics.org/blog/index.php?pk=29365&T=2

[TABLE]
[ROW][C]Partial Autocorrelation Function[/C][/ROW]
[ROW][C]Time lag k[/C][C]PACF(k)[/C][C]T-STAT[/C][C]P-value[/C][/ROW]
[ROW][C]1[/C][C]0.451283[/C][C]3.8293[/C][C]0.000136[/C][/ROW]
[ROW][C]2[/C][C]-0.020942[/C][C]-0.1777[/C][C]0.429728[/C][/ROW]
[ROW][C]3[/C][C]0.325066[/C][C]2.7583[/C][C]0.00368[/C][/ROW]
[ROW][C]4[/C][C]-0.010142[/C][C]-0.0861[/C][C]0.465829[/C][/ROW]
[ROW][C]5[/C][C]0.17449[/C][C]1.4806[/C][C]0.071538[/C][/ROW]
[ROW][C]6[/C][C]0.254064[/C][C]2.1558[/C][C]0.017221[/C][/ROW]
[ROW][C]7[/C][C]-0.119824[/C][C]-1.0167[/C][C]0.156341[/C][/ROW]
[ROW][C]8[/C][C]0.328578[/C][C]2.7881[/C][C]0.003389[/C][/ROW]
[ROW][C]9[/C][C]-0.259834[/C][C]-2.2048[/C][C]0.015333[/C][/ROW]
[ROW][C]10[/C][C]-0.10886[/C][C]-0.9237[/C][C]0.179363[/C][/ROW]
[ROW][C]11[/C][C]0.233901[/C][C]1.9847[/C][C]0.025494[/C][/ROW]
[ROW][C]12[/C][C]0.278496[/C][C]2.3631[/C][C]0.010413[/C][/ROW]
[ROW][C]13[/C][C]-0.327467[/C][C]-2.7786[/C][C]0.003479[/C][/ROW]
[ROW][C]14[/C][C]-0.162639[/C][C]-1.38[/C][C]0.085923[/C][/ROW]
[ROW][C]15[/C][C]-0.072154[/C][C]-0.6122[/C][C]0.271151[/C][/ROW]
[ROW][C]16[/C][C]0.02995[/C][C]0.2541[/C][C]0.400057[/C][/ROW]
[ROW][C]17[/C][C]0.066449[/C][C]0.5638[/C][C]0.287308[/C][/ROW]
[ROW][C]18[/C][C]-0.054052[/C][C]-0.4586[/C][C]0.323935[/C][/ROW]
[ROW][C]19[/C][C]-0.056189[/C][C]-0.4768[/C][C]0.317482[/C][/ROW]
[ROW][C]20[/C][C]0.049089[/C][C]0.4165[/C][C]0.339128[/C][/ROW]
[ROW][C]21[/C][C]0.009281[/C][C]0.0788[/C][C]0.468723[/C][/ROW]
[ROW][C]22[/C][C]0.115995[/C][C]0.9842[/C][C]0.164145[/C][/ROW]
[ROW][C]23[/C][C]-0.032081[/C][C]-0.2722[/C][C]0.393118[/C][/ROW]
[ROW][C]24[/C][C]0.000315[/C][C]0.0027[/C][C]0.498939[/C][/ROW]
[ROW][C]25[/C][C]-0.097786[/C][C]-0.8297[/C][C]0.204715[/C][/ROW]
[ROW][C]26[/C][C]-0.075868[/C][C]-0.6438[/C][C]0.260888[/C][/ROW]
[ROW][C]27[/C][C]-0.073987[/C][C]-0.6278[/C][C]0.266062[/C][/ROW]
[ROW][C]28[/C][C]0.045436[/C][C]0.3855[/C][C]0.350488[/C][/ROW]
[ROW][C]29[/C][C]-0.141253[/C][C]-1.1986[/C][C]0.117313[/C][/ROW]
[ROW][C]30[/C][C]0.0122[/C][C]0.1035[/C][C]0.458919[/C][/ROW]
[ROW][C]31[/C][C]0.029877[/C][C]0.2535[/C][C]0.400297[/C][/ROW]
[ROW][C]32[/C][C]-0.147632[/C][C]-1.2527[/C][C]0.107185[/C][/ROW]
[ROW][C]33[/C][C]0.106211[/C][C]0.9012[/C][C]0.185235[/C][/ROW]
[ROW][C]34[/C][C]-0.033481[/C][C]-0.2841[/C][C]0.388577[/C][/ROW]
[ROW][C]35[/C][C]0.055538[/C][C]0.4713[/C][C]0.319443[/C][/ROW]
[ROW][C]36[/C][C]-0.033214[/C][C]-0.2818[/C][C]0.389441[/C][/ROW]
[/TABLE]
Source: https://freestatistics.org/blog/index.php?pk=29365&T=2

Globally Unique Identifier (entire table): ba.freestatistics.org/blog/index.php?pk=29365&T=2

As an alternative you can also use a QR Code:  

The GUIDs for individual cells are displayed in the table below:

Partial Autocorrelation Function
Time lag kPACF(k)T-STATP-value
10.4512833.82930.000136
2-0.020942-0.17770.429728
30.3250662.75830.00368
4-0.010142-0.08610.465829
50.174491.48060.071538
60.2540642.15580.017221
7-0.119824-1.01670.156341
80.3285782.78810.003389
9-0.259834-2.20480.015333
10-0.10886-0.92370.179363
110.2339011.98470.025494
120.2784962.36310.010413
13-0.327467-2.77860.003479
14-0.162639-1.380.085923
15-0.072154-0.61220.271151
160.029950.25410.400057
170.0664490.56380.287308
18-0.054052-0.45860.323935
19-0.056189-0.47680.317482
200.0490890.41650.339128
210.0092810.07880.468723
220.1159950.98420.164145
23-0.032081-0.27220.393118
240.0003150.00270.498939
25-0.097786-0.82970.204715
26-0.075868-0.64380.260888
27-0.073987-0.62780.266062
280.0454360.38550.350488
29-0.141253-1.19860.117313
300.01220.10350.458919
310.0298770.25350.400297
32-0.147632-1.25270.107185
330.1062110.90120.185235
34-0.033481-0.28410.388577
350.0555380.47130.319443
36-0.033214-0.28180.389441


Parameters (Session):
par1 = 36 ; par2 = 1 ; par3 = 0 ; par4 = 0 ; par5 = 12 ;
Parameters (R input):
par1 = 36 ; par2 = 1 ; par3 = 0 ; par4 = 0 ; par5 = 12 ;
R code (references can be found in the software module):
if (par1 == 'Default') {
par1 = 10*log10(length(x))
} else {
par1 <- as.numeric(par1)
}
par2 <- as.numeric(par2)
par3 <- as.numeric(par3)
par4 <- as.numeric(par4)
par5 <- as.numeric(par5)
if (par2 == 0) {
x <- log(x)
} else {
x <- (x ^ par2 - 1) / par2
}
if (par3 > 0) x <- diff(x,lag=1,difference=par3)
if (par4 > 0) x <- diff(x,lag=par5,difference=par4)
bitmap(file='pic1.png')
racf <- acf(x,par1,main='Autocorrelation',xlab='lags',ylab='ACF')
dev.off()
bitmap(file='pic2.png')
rpacf <- pacf(x,par1,main='Partial Autocorrelation',xlab='lags',ylab='PACF')
dev.off()
(myacf <- c(racf$acf))
(mypacf <- c(rpacf$acf))
lengthx <- length(x)
sqrtn <- sqrt(lengthx)
load(file='createtable')
a<-table.start()
a<-table.row.start(a)
a<-table.element(a,'Autocorrelation Function',4,TRUE)
a<-table.row.end(a)
a<-table.row.start(a)
a<-table.element(a,'Time lag k',header=TRUE)
a<-table.element(a,hyperlink('basics.htm','ACF(k)','click here for more information about the Autocorrelation Function'),header=TRUE)
a<-table.element(a,'T-STAT',header=TRUE)
a<-table.element(a,'P-value',header=TRUE)
a<-table.row.end(a)
for (i in 2:(par1+1)) {
a<-table.row.start(a)
a<-table.element(a,i-1,header=TRUE)
a<-table.element(a,round(myacf[i],6))
mytstat <- myacf[i]*sqrtn
a<-table.element(a,round(mytstat,4))
a<-table.element(a,round(1-pt(abs(mytstat),lengthx),6))
a<-table.row.end(a)
}
a<-table.end(a)
table.save(a,file='mytable.tab')
a<-table.start()
a<-table.row.start(a)
a<-table.element(a,'Partial Autocorrelation Function',4,TRUE)
a<-table.row.end(a)
a<-table.row.start(a)
a<-table.element(a,'Time lag k',header=TRUE)
a<-table.element(a,hyperlink('basics.htm','PACF(k)','click here for more information about the Partial Autocorrelation Function'),header=TRUE)
a<-table.element(a,'T-STAT',header=TRUE)
a<-table.element(a,'P-value',header=TRUE)
a<-table.row.end(a)
for (i in 1:par1) {
a<-table.row.start(a)
a<-table.element(a,i,header=TRUE)
a<-table.element(a,round(mypacf[i],6))
mytstat <- mypacf[i]*sqrtn
a<-table.element(a,round(mytstat,4))
a<-table.element(a,round(1-pt(abs(mytstat),lengthx),6))
a<-table.row.end(a)
}
a<-table.end(a)
table.save(a,file='mytable1.tab')