Free Statistics

of Irreproducible Research!

Author's title

Author*The author of this computation has been verified*
R Software Modulerwasp_centraltendency.wasp
Title produced by softwareCentral Tendency
Date of computationFri, 05 Dec 2008 08:52:13 -0700
Cite this page as followsStatistical Computations at FreeStatistics.org, Office for Research Development and Education, URL https://freestatistics.org/blog/index.php?v=date/2008/Dec/05/t1228493966lywoz1j8dlvcl4v.htm/, Retrieved Thu, 16 May 2024 21:18:57 +0000
Statistical Computations at FreeStatistics.org, Office for Research Development and Education, URL https://freestatistics.org/blog/index.php?pk=29332, Retrieved Thu, 16 May 2024 21:18:57 +0000
QR Codes:

Original text written by user:
IsPrivate?No (this computation is public)
User-defined keywords
Estimated Impact140
Family? (F = Feedback message, R = changed R code, M = changed R Module, P = changed Parameters, D = changed Data)
-       [Central Tendency] [niet-duurzame con...] [2008-12-05 15:52:13] [5925747fb2a6bb4cfcd8015825ee5e92] [Current]
Feedback Forum

Post a new message
Dataseries X:
98,6
98
106,8
96,7
100,2
107,7
92
98,4
107,4
117,7
105,7
97,5
99,9
98,2
104,5
100,8
101,5
103,9
99,6
98,4
112,7
118,4
108,1
105,4
114,6
106,9
115,9
109,8
101,8
114,2
110,8
108,4
127,5
128,6
116,6
127,4
105
108,3
125
111,6
106,5
130,3
115
116,1
134
126,5
125,8
136,4
114,9
110,9
125,5
116,8
116,8
125,5
104,2
115,1
132,8
123,3
124,8
122
117,4
117,9
137,4
114,6
124,7
129,6
109,4
120,9
134,9
136,3
133,2
127,2
122,7
120,5
137,8
119,1
124,3
134,4
121,1
122,2
127,7
137,4
132,2
129,2
124,9


Summary of computational transaction
Raw Inputview raw input (R code)
Raw Outputview raw output of R engine
Computing time1 seconds
R Server'George Udny Yule' @ 72.249.76.132

\begin{tabular}{lllllllll}
\hline
Summary of computational transaction \tabularnewline
Raw Input & view raw input (R code)  \tabularnewline
Raw Output & view raw output of R engine  \tabularnewline
Computing time & 1 seconds \tabularnewline
R Server & 'George Udny Yule' @ 72.249.76.132 \tabularnewline
\hline
\end{tabular}
%Source: https://freestatistics.org/blog/index.php?pk=29332&T=0

[TABLE]
[ROW][C]Summary of computational transaction[/C][/ROW]
[ROW][C]Raw Input[/C][C]view raw input (R code) [/C][/ROW]
[ROW][C]Raw Output[/C][C]view raw output of R engine [/C][/ROW]
[ROW][C]Computing time[/C][C]1 seconds[/C][/ROW]
[ROW][C]R Server[/C][C]'George Udny Yule' @ 72.249.76.132[/C][/ROW]
[/TABLE]
Source: https://freestatistics.org/blog/index.php?pk=29332&T=0

Globally Unique Identifier (entire table): ba.freestatistics.org/blog/index.php?pk=29332&T=0

As an alternative you can also use a QR Code:  

The GUIDs for individual cells are displayed in the table below:

Summary of computational transaction
Raw Inputview raw input (R code)
Raw Outputview raw output of R engine
Computing time1 seconds
R Server'George Udny Yule' @ 72.249.76.132


Central Tendency - Ungrouped Data
MeasureValueS.E.Value/S.E.
Arithmetic Mean116.3611764705881.3039716255845289.235972767757
Geometric Mean115.742518417325
Harmonic Mean115.120659156622
Quadratic Mean116.973296600750
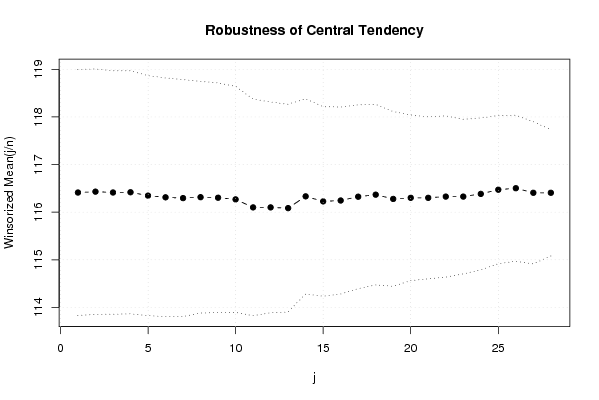
Winsorized Mean ( 1 / 28 )116.4117647058821.2918798451694090.1103652488808
Winsorized Mean ( 2 / 28 )116.4305882352941.2885240329756390.359655897467
Winsorized Mean ( 3 / 28 )116.4129411764711.2787651477812991.0354347539516
Winsorized Mean ( 4 / 28 )116.4176470588241.2762846293439791.216053521434
Winsorized Mean ( 5 / 28 )116.3470588235291.2594267383784492.3809660999658
Winsorized Mean ( 6 / 28 )116.3117647058821.2532997474842192.8044268255527
Winsorized Mean ( 7 / 28 )116.2952941176471.2448863535616093.4184022380259
Winsorized Mean ( 8 / 28 )116.3141176470591.2166275112933295.6037214080522
Winsorized Mean ( 9 / 28 )116.3035294117651.2045030439138996.5572731421668
Winsorized Mean ( 10 / 28 )116.2682352941181.1874061505178897.9178314373797
Winsorized Mean ( 11 / 28 )116.11.13698579352509102.112093802022
Winsorized Mean ( 12 / 28 )116.11.10678452681428104.898466853505
Winsorized Mean ( 13 / 28 )116.0847058823531.09078455290077106.423129639711
Winsorized Mean ( 14 / 28 )116.3317647058821.02466529585450113.531477231177
Winsorized Mean ( 15 / 28 )116.2258823529410.994803237644483116.833035875661
Winsorized Mean ( 16 / 28 )116.2447058823530.981563244539954118.428136474115
Winsorized Mean ( 17 / 28 )116.3247058823530.964720690601657120.578636921124
Winsorized Mean ( 18 / 28 )116.3670588235290.947185700567406122.855590782061
Winsorized Mean ( 19 / 28 )116.2776470588240.916919053318112126.813426592067
Winsorized Mean ( 20 / 28 )116.3011764705880.869715324360553133.723269227315
Winsorized Mean ( 21 / 28 )116.3011764705880.85022075584102136.789387546233
Winsorized Mean ( 22 / 28 )116.3270588235290.846783977352278137.375129826217
Winsorized Mean ( 23 / 28 )116.3270588235290.811626627318062143.325828537588
Winsorized Mean ( 24 / 28 )116.3835294117650.796995139424082146.027903627950
Winsorized Mean ( 25 / 28 )116.4717647058820.778085007857726149.690282590793
Winsorized Mean ( 26 / 28 )116.5023529411760.766373058753843152.017808573040
Winsorized Mean ( 27 / 28 )116.4070588235290.746230092397206155.993519973954
Winsorized Mean ( 28 / 28 )116.4070588235290.663322399517085175.490921018613
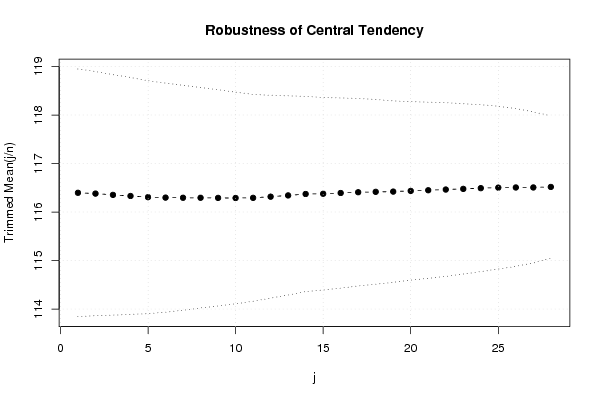
Trimmed Mean ( 1 / 28 )116.3963855421691.2763386670993491.195533397649
Trimmed Mean ( 2 / 28 )116.3802469135801.2581909653986492.4980786813287
Trimmed Mean ( 3 / 28 )116.3531645569621.2390236487722693.9071378276396
Trimmed Mean ( 4 / 28 )116.3311688311691.2207637140708895.29376364181
Trimmed Mean ( 5 / 28 )116.3066666666671.2001116064216196.9132087751901
Trimmed Mean ( 6 / 28 )116.2972602739731.1806983535133498.4987062342494
Trimmed Mean ( 7 / 28 )116.2943661971831.15925961129249100.317793412576
Trimmed Mean ( 8 / 28 )116.2942028985511.13576643954278102.392709319150
Trimmed Mean ( 9 / 28 )116.2910447761191.11403352645691104.387383336633
Trimmed Mean ( 10 / 28 )116.2892307692311.09047476224835106.640918978689
Trimmed Mean ( 11 / 28 )116.2920634920631.06554112464599109.138972492216
Trimmed Mean ( 12 / 28 )116.3163934426231.04522379836898111.283720887459
Trimmed Mean ( 13 / 28 )116.3423728813561.02603514576158113.390241418095
Trimmed Mean ( 14 / 28 )116.3719298245611.00525796383162115.763250838621
Trimmed Mean ( 15 / 28 )116.3763636363640.991645110151458117.356867335925
Trimmed Mean ( 16 / 28 )116.3924528301890.979484214022677118.830350876379
Trimmed Mean ( 17 / 28 )116.4078431372550.965940943825688120.512381094658
Trimmed Mean ( 18 / 28 )116.4163265306120.951253858094992122.381975683916
Trimmed Mean ( 19 / 28 )116.4212765957450.935139559650948124.496151824868
Trimmed Mean ( 20 / 28 )116.4355555555560.91951434016729126.627231864999
Trimmed Mean ( 21 / 28 )116.4488372093020.907605200105358128.303404603438
Trimmed Mean ( 22 / 28 )116.4634146341460.89465047063331130.1775592335
Trimmed Mean ( 23 / 28 )116.4769230769230.876876907655982132.831554873856
Trimmed Mean ( 24 / 28 )116.4918918918920.859712033448487135.501060075451
Trimmed Mean ( 25 / 28 )116.5028571428570.838410718570084138.956784022935
Trimmed Mean ( 26 / 28 )116.5060606060610.812449758282751143.400941926939
Trimmed Mean ( 27 / 28 )116.5064516129030.777754356055186149.798520195799
Trimmed Mean ( 28 / 28 )116.5172413793100.732851051834752158.991709280624
Median116.6
Midrange114.9
Midmean - Weighted Average at Xnp116.448837209302
Midmean - Weighted Average at X(n+1)p116.448837209302
Midmean - Empirical Distribution Function116.448837209302
Midmean - Empirical Distribution Function - Averaging116.448837209302
Midmean - Empirical Distribution Function - Interpolation116.448837209302
Midmean - Closest Observation116.222727272727
Midmean - True Basic - Statistics Graphics Toolkit116.448837209302
Midmean - MS Excel (old versions)116.448837209302
Number of observations85

\begin{tabular}{lllllllll}
\hline
Central Tendency - Ungrouped Data \tabularnewline
Measure & Value & S.E. & Value/S.E. \tabularnewline
Arithmetic Mean & 116.361176470588 & 1.30397162558452 & 89.235972767757 \tabularnewline
Geometric Mean & 115.742518417325 &  &  \tabularnewline
Harmonic Mean & 115.120659156622 &  &  \tabularnewline
Quadratic Mean & 116.973296600750 &  &  \tabularnewline
Winsorized Mean ( 1 / 28 ) & 116.411764705882 & 1.29187984516940 & 90.1103652488808 \tabularnewline
Winsorized Mean ( 2 / 28 ) & 116.430588235294 & 1.28852403297563 & 90.359655897467 \tabularnewline
Winsorized Mean ( 3 / 28 ) & 116.412941176471 & 1.27876514778129 & 91.0354347539516 \tabularnewline
Winsorized Mean ( 4 / 28 ) & 116.417647058824 & 1.27628462934397 & 91.216053521434 \tabularnewline
Winsorized Mean ( 5 / 28 ) & 116.347058823529 & 1.25942673837844 & 92.3809660999658 \tabularnewline
Winsorized Mean ( 6 / 28 ) & 116.311764705882 & 1.25329974748421 & 92.8044268255527 \tabularnewline
Winsorized Mean ( 7 / 28 ) & 116.295294117647 & 1.24488635356160 & 93.4184022380259 \tabularnewline
Winsorized Mean ( 8 / 28 ) & 116.314117647059 & 1.21662751129332 & 95.6037214080522 \tabularnewline
Winsorized Mean ( 9 / 28 ) & 116.303529411765 & 1.20450304391389 & 96.5572731421668 \tabularnewline
Winsorized Mean ( 10 / 28 ) & 116.268235294118 & 1.18740615051788 & 97.9178314373797 \tabularnewline
Winsorized Mean ( 11 / 28 ) & 116.1 & 1.13698579352509 & 102.112093802022 \tabularnewline
Winsorized Mean ( 12 / 28 ) & 116.1 & 1.10678452681428 & 104.898466853505 \tabularnewline
Winsorized Mean ( 13 / 28 ) & 116.084705882353 & 1.09078455290077 & 106.423129639711 \tabularnewline
Winsorized Mean ( 14 / 28 ) & 116.331764705882 & 1.02466529585450 & 113.531477231177 \tabularnewline
Winsorized Mean ( 15 / 28 ) & 116.225882352941 & 0.994803237644483 & 116.833035875661 \tabularnewline
Winsorized Mean ( 16 / 28 ) & 116.244705882353 & 0.981563244539954 & 118.428136474115 \tabularnewline
Winsorized Mean ( 17 / 28 ) & 116.324705882353 & 0.964720690601657 & 120.578636921124 \tabularnewline
Winsorized Mean ( 18 / 28 ) & 116.367058823529 & 0.947185700567406 & 122.855590782061 \tabularnewline
Winsorized Mean ( 19 / 28 ) & 116.277647058824 & 0.916919053318112 & 126.813426592067 \tabularnewline
Winsorized Mean ( 20 / 28 ) & 116.301176470588 & 0.869715324360553 & 133.723269227315 \tabularnewline
Winsorized Mean ( 21 / 28 ) & 116.301176470588 & 0.85022075584102 & 136.789387546233 \tabularnewline
Winsorized Mean ( 22 / 28 ) & 116.327058823529 & 0.846783977352278 & 137.375129826217 \tabularnewline
Winsorized Mean ( 23 / 28 ) & 116.327058823529 & 0.811626627318062 & 143.325828537588 \tabularnewline
Winsorized Mean ( 24 / 28 ) & 116.383529411765 & 0.796995139424082 & 146.027903627950 \tabularnewline
Winsorized Mean ( 25 / 28 ) & 116.471764705882 & 0.778085007857726 & 149.690282590793 \tabularnewline
Winsorized Mean ( 26 / 28 ) & 116.502352941176 & 0.766373058753843 & 152.017808573040 \tabularnewline
Winsorized Mean ( 27 / 28 ) & 116.407058823529 & 0.746230092397206 & 155.993519973954 \tabularnewline
Winsorized Mean ( 28 / 28 ) & 116.407058823529 & 0.663322399517085 & 175.490921018613 \tabularnewline
Trimmed Mean ( 1 / 28 ) & 116.396385542169 & 1.27633866709934 & 91.195533397649 \tabularnewline
Trimmed Mean ( 2 / 28 ) & 116.380246913580 & 1.25819096539864 & 92.4980786813287 \tabularnewline
Trimmed Mean ( 3 / 28 ) & 116.353164556962 & 1.23902364877226 & 93.9071378276396 \tabularnewline
Trimmed Mean ( 4 / 28 ) & 116.331168831169 & 1.22076371407088 & 95.29376364181 \tabularnewline
Trimmed Mean ( 5 / 28 ) & 116.306666666667 & 1.20011160642161 & 96.9132087751901 \tabularnewline
Trimmed Mean ( 6 / 28 ) & 116.297260273973 & 1.18069835351334 & 98.4987062342494 \tabularnewline
Trimmed Mean ( 7 / 28 ) & 116.294366197183 & 1.15925961129249 & 100.317793412576 \tabularnewline
Trimmed Mean ( 8 / 28 ) & 116.294202898551 & 1.13576643954278 & 102.392709319150 \tabularnewline
Trimmed Mean ( 9 / 28 ) & 116.291044776119 & 1.11403352645691 & 104.387383336633 \tabularnewline
Trimmed Mean ( 10 / 28 ) & 116.289230769231 & 1.09047476224835 & 106.640918978689 \tabularnewline
Trimmed Mean ( 11 / 28 ) & 116.292063492063 & 1.06554112464599 & 109.138972492216 \tabularnewline
Trimmed Mean ( 12 / 28 ) & 116.316393442623 & 1.04522379836898 & 111.283720887459 \tabularnewline
Trimmed Mean ( 13 / 28 ) & 116.342372881356 & 1.02603514576158 & 113.390241418095 \tabularnewline
Trimmed Mean ( 14 / 28 ) & 116.371929824561 & 1.00525796383162 & 115.763250838621 \tabularnewline
Trimmed Mean ( 15 / 28 ) & 116.376363636364 & 0.991645110151458 & 117.356867335925 \tabularnewline
Trimmed Mean ( 16 / 28 ) & 116.392452830189 & 0.979484214022677 & 118.830350876379 \tabularnewline
Trimmed Mean ( 17 / 28 ) & 116.407843137255 & 0.965940943825688 & 120.512381094658 \tabularnewline
Trimmed Mean ( 18 / 28 ) & 116.416326530612 & 0.951253858094992 & 122.381975683916 \tabularnewline
Trimmed Mean ( 19 / 28 ) & 116.421276595745 & 0.935139559650948 & 124.496151824868 \tabularnewline
Trimmed Mean ( 20 / 28 ) & 116.435555555556 & 0.91951434016729 & 126.627231864999 \tabularnewline
Trimmed Mean ( 21 / 28 ) & 116.448837209302 & 0.907605200105358 & 128.303404603438 \tabularnewline
Trimmed Mean ( 22 / 28 ) & 116.463414634146 & 0.89465047063331 & 130.1775592335 \tabularnewline
Trimmed Mean ( 23 / 28 ) & 116.476923076923 & 0.876876907655982 & 132.831554873856 \tabularnewline
Trimmed Mean ( 24 / 28 ) & 116.491891891892 & 0.859712033448487 & 135.501060075451 \tabularnewline
Trimmed Mean ( 25 / 28 ) & 116.502857142857 & 0.838410718570084 & 138.956784022935 \tabularnewline
Trimmed Mean ( 26 / 28 ) & 116.506060606061 & 0.812449758282751 & 143.400941926939 \tabularnewline
Trimmed Mean ( 27 / 28 ) & 116.506451612903 & 0.777754356055186 & 149.798520195799 \tabularnewline
Trimmed Mean ( 28 / 28 ) & 116.517241379310 & 0.732851051834752 & 158.991709280624 \tabularnewline
Median & 116.6 &  &  \tabularnewline
Midrange & 114.9 &  &  \tabularnewline
Midmean - Weighted Average at Xnp & 116.448837209302 &  &  \tabularnewline
Midmean - Weighted Average at X(n+1)p & 116.448837209302 &  &  \tabularnewline
Midmean - Empirical Distribution Function & 116.448837209302 &  &  \tabularnewline
Midmean - Empirical Distribution Function - Averaging & 116.448837209302 &  &  \tabularnewline
Midmean - Empirical Distribution Function - Interpolation & 116.448837209302 &  &  \tabularnewline
Midmean - Closest Observation & 116.222727272727 &  &  \tabularnewline
Midmean - True Basic - Statistics Graphics Toolkit & 116.448837209302 &  &  \tabularnewline
Midmean - MS Excel (old versions) & 116.448837209302 &  &  \tabularnewline
Number of observations & 85 &  &  \tabularnewline
\hline
\end{tabular}
%Source: https://freestatistics.org/blog/index.php?pk=29332&T=1

[TABLE]
[ROW][C]Central Tendency - Ungrouped Data[/C][/ROW]
[ROW][C]Measure[/C][C]Value[/C][C]S.E.[/C][C]Value/S.E.[/C][/ROW]
[ROW][C]Arithmetic Mean[/C][C]116.361176470588[/C][C]1.30397162558452[/C][C]89.235972767757[/C][/ROW]
[ROW][C]Geometric Mean[/C][C]115.742518417325[/C][C][/C][C][/C][/ROW]
[ROW][C]Harmonic Mean[/C][C]115.120659156622[/C][C][/C][C][/C][/ROW]
[ROW][C]Quadratic Mean[/C][C]116.973296600750[/C][C][/C][C][/C][/ROW]
[ROW][C]Winsorized Mean ( 1 / 28 )[/C][C]116.411764705882[/C][C]1.29187984516940[/C][C]90.1103652488808[/C][/ROW]
[ROW][C]Winsorized Mean ( 2 / 28 )[/C][C]116.430588235294[/C][C]1.28852403297563[/C][C]90.359655897467[/C][/ROW]
[ROW][C]Winsorized Mean ( 3 / 28 )[/C][C]116.412941176471[/C][C]1.27876514778129[/C][C]91.0354347539516[/C][/ROW]
[ROW][C]Winsorized Mean ( 4 / 28 )[/C][C]116.417647058824[/C][C]1.27628462934397[/C][C]91.216053521434[/C][/ROW]
[ROW][C]Winsorized Mean ( 5 / 28 )[/C][C]116.347058823529[/C][C]1.25942673837844[/C][C]92.3809660999658[/C][/ROW]
[ROW][C]Winsorized Mean ( 6 / 28 )[/C][C]116.311764705882[/C][C]1.25329974748421[/C][C]92.8044268255527[/C][/ROW]
[ROW][C]Winsorized Mean ( 7 / 28 )[/C][C]116.295294117647[/C][C]1.24488635356160[/C][C]93.4184022380259[/C][/ROW]
[ROW][C]Winsorized Mean ( 8 / 28 )[/C][C]116.314117647059[/C][C]1.21662751129332[/C][C]95.6037214080522[/C][/ROW]
[ROW][C]Winsorized Mean ( 9 / 28 )[/C][C]116.303529411765[/C][C]1.20450304391389[/C][C]96.5572731421668[/C][/ROW]
[ROW][C]Winsorized Mean ( 10 / 28 )[/C][C]116.268235294118[/C][C]1.18740615051788[/C][C]97.9178314373797[/C][/ROW]
[ROW][C]Winsorized Mean ( 11 / 28 )[/C][C]116.1[/C][C]1.13698579352509[/C][C]102.112093802022[/C][/ROW]
[ROW][C]Winsorized Mean ( 12 / 28 )[/C][C]116.1[/C][C]1.10678452681428[/C][C]104.898466853505[/C][/ROW]
[ROW][C]Winsorized Mean ( 13 / 28 )[/C][C]116.084705882353[/C][C]1.09078455290077[/C][C]106.423129639711[/C][/ROW]
[ROW][C]Winsorized Mean ( 14 / 28 )[/C][C]116.331764705882[/C][C]1.02466529585450[/C][C]113.531477231177[/C][/ROW]
[ROW][C]Winsorized Mean ( 15 / 28 )[/C][C]116.225882352941[/C][C]0.994803237644483[/C][C]116.833035875661[/C][/ROW]
[ROW][C]Winsorized Mean ( 16 / 28 )[/C][C]116.244705882353[/C][C]0.981563244539954[/C][C]118.428136474115[/C][/ROW]
[ROW][C]Winsorized Mean ( 17 / 28 )[/C][C]116.324705882353[/C][C]0.964720690601657[/C][C]120.578636921124[/C][/ROW]
[ROW][C]Winsorized Mean ( 18 / 28 )[/C][C]116.367058823529[/C][C]0.947185700567406[/C][C]122.855590782061[/C][/ROW]
[ROW][C]Winsorized Mean ( 19 / 28 )[/C][C]116.277647058824[/C][C]0.916919053318112[/C][C]126.813426592067[/C][/ROW]
[ROW][C]Winsorized Mean ( 20 / 28 )[/C][C]116.301176470588[/C][C]0.869715324360553[/C][C]133.723269227315[/C][/ROW]
[ROW][C]Winsorized Mean ( 21 / 28 )[/C][C]116.301176470588[/C][C]0.85022075584102[/C][C]136.789387546233[/C][/ROW]
[ROW][C]Winsorized Mean ( 22 / 28 )[/C][C]116.327058823529[/C][C]0.846783977352278[/C][C]137.375129826217[/C][/ROW]
[ROW][C]Winsorized Mean ( 23 / 28 )[/C][C]116.327058823529[/C][C]0.811626627318062[/C][C]143.325828537588[/C][/ROW]
[ROW][C]Winsorized Mean ( 24 / 28 )[/C][C]116.383529411765[/C][C]0.796995139424082[/C][C]146.027903627950[/C][/ROW]
[ROW][C]Winsorized Mean ( 25 / 28 )[/C][C]116.471764705882[/C][C]0.778085007857726[/C][C]149.690282590793[/C][/ROW]
[ROW][C]Winsorized Mean ( 26 / 28 )[/C][C]116.502352941176[/C][C]0.766373058753843[/C][C]152.017808573040[/C][/ROW]
[ROW][C]Winsorized Mean ( 27 / 28 )[/C][C]116.407058823529[/C][C]0.746230092397206[/C][C]155.993519973954[/C][/ROW]
[ROW][C]Winsorized Mean ( 28 / 28 )[/C][C]116.407058823529[/C][C]0.663322399517085[/C][C]175.490921018613[/C][/ROW]
[ROW][C]Trimmed Mean ( 1 / 28 )[/C][C]116.396385542169[/C][C]1.27633866709934[/C][C]91.195533397649[/C][/ROW]
[ROW][C]Trimmed Mean ( 2 / 28 )[/C][C]116.380246913580[/C][C]1.25819096539864[/C][C]92.4980786813287[/C][/ROW]
[ROW][C]Trimmed Mean ( 3 / 28 )[/C][C]116.353164556962[/C][C]1.23902364877226[/C][C]93.9071378276396[/C][/ROW]
[ROW][C]Trimmed Mean ( 4 / 28 )[/C][C]116.331168831169[/C][C]1.22076371407088[/C][C]95.29376364181[/C][/ROW]
[ROW][C]Trimmed Mean ( 5 / 28 )[/C][C]116.306666666667[/C][C]1.20011160642161[/C][C]96.9132087751901[/C][/ROW]
[ROW][C]Trimmed Mean ( 6 / 28 )[/C][C]116.297260273973[/C][C]1.18069835351334[/C][C]98.4987062342494[/C][/ROW]
[ROW][C]Trimmed Mean ( 7 / 28 )[/C][C]116.294366197183[/C][C]1.15925961129249[/C][C]100.317793412576[/C][/ROW]
[ROW][C]Trimmed Mean ( 8 / 28 )[/C][C]116.294202898551[/C][C]1.13576643954278[/C][C]102.392709319150[/C][/ROW]
[ROW][C]Trimmed Mean ( 9 / 28 )[/C][C]116.291044776119[/C][C]1.11403352645691[/C][C]104.387383336633[/C][/ROW]
[ROW][C]Trimmed Mean ( 10 / 28 )[/C][C]116.289230769231[/C][C]1.09047476224835[/C][C]106.640918978689[/C][/ROW]
[ROW][C]Trimmed Mean ( 11 / 28 )[/C][C]116.292063492063[/C][C]1.06554112464599[/C][C]109.138972492216[/C][/ROW]
[ROW][C]Trimmed Mean ( 12 / 28 )[/C][C]116.316393442623[/C][C]1.04522379836898[/C][C]111.283720887459[/C][/ROW]
[ROW][C]Trimmed Mean ( 13 / 28 )[/C][C]116.342372881356[/C][C]1.02603514576158[/C][C]113.390241418095[/C][/ROW]
[ROW][C]Trimmed Mean ( 14 / 28 )[/C][C]116.371929824561[/C][C]1.00525796383162[/C][C]115.763250838621[/C][/ROW]
[ROW][C]Trimmed Mean ( 15 / 28 )[/C][C]116.376363636364[/C][C]0.991645110151458[/C][C]117.356867335925[/C][/ROW]
[ROW][C]Trimmed Mean ( 16 / 28 )[/C][C]116.392452830189[/C][C]0.979484214022677[/C][C]118.830350876379[/C][/ROW]
[ROW][C]Trimmed Mean ( 17 / 28 )[/C][C]116.407843137255[/C][C]0.965940943825688[/C][C]120.512381094658[/C][/ROW]
[ROW][C]Trimmed Mean ( 18 / 28 )[/C][C]116.416326530612[/C][C]0.951253858094992[/C][C]122.381975683916[/C][/ROW]
[ROW][C]Trimmed Mean ( 19 / 28 )[/C][C]116.421276595745[/C][C]0.935139559650948[/C][C]124.496151824868[/C][/ROW]
[ROW][C]Trimmed Mean ( 20 / 28 )[/C][C]116.435555555556[/C][C]0.91951434016729[/C][C]126.627231864999[/C][/ROW]
[ROW][C]Trimmed Mean ( 21 / 28 )[/C][C]116.448837209302[/C][C]0.907605200105358[/C][C]128.303404603438[/C][/ROW]
[ROW][C]Trimmed Mean ( 22 / 28 )[/C][C]116.463414634146[/C][C]0.89465047063331[/C][C]130.1775592335[/C][/ROW]
[ROW][C]Trimmed Mean ( 23 / 28 )[/C][C]116.476923076923[/C][C]0.876876907655982[/C][C]132.831554873856[/C][/ROW]
[ROW][C]Trimmed Mean ( 24 / 28 )[/C][C]116.491891891892[/C][C]0.859712033448487[/C][C]135.501060075451[/C][/ROW]
[ROW][C]Trimmed Mean ( 25 / 28 )[/C][C]116.502857142857[/C][C]0.838410718570084[/C][C]138.956784022935[/C][/ROW]
[ROW][C]Trimmed Mean ( 26 / 28 )[/C][C]116.506060606061[/C][C]0.812449758282751[/C][C]143.400941926939[/C][/ROW]
[ROW][C]Trimmed Mean ( 27 / 28 )[/C][C]116.506451612903[/C][C]0.777754356055186[/C][C]149.798520195799[/C][/ROW]
[ROW][C]Trimmed Mean ( 28 / 28 )[/C][C]116.517241379310[/C][C]0.732851051834752[/C][C]158.991709280624[/C][/ROW]
[ROW][C]Median[/C][C]116.6[/C][C][/C][C][/C][/ROW]
[ROW][C]Midrange[/C][C]114.9[/C][C][/C][C][/C][/ROW]
[ROW][C]Midmean - Weighted Average at Xnp[/C][C]116.448837209302[/C][C][/C][C][/C][/ROW]
[ROW][C]Midmean - Weighted Average at X(n+1)p[/C][C]116.448837209302[/C][C][/C][C][/C][/ROW]
[ROW][C]Midmean - Empirical Distribution Function[/C][C]116.448837209302[/C][C][/C][C][/C][/ROW]
[ROW][C]Midmean - Empirical Distribution Function - Averaging[/C][C]116.448837209302[/C][C][/C][C][/C][/ROW]
[ROW][C]Midmean - Empirical Distribution Function - Interpolation[/C][C]116.448837209302[/C][C][/C][C][/C][/ROW]
[ROW][C]Midmean - Closest Observation[/C][C]116.222727272727[/C][C][/C][C][/C][/ROW]
[ROW][C]Midmean - True Basic - Statistics Graphics Toolkit[/C][C]116.448837209302[/C][C][/C][C][/C][/ROW]
[ROW][C]Midmean - MS Excel (old versions)[/C][C]116.448837209302[/C][C][/C][C][/C][/ROW]
[ROW][C]Number of observations[/C][C]85[/C][C][/C][C][/C][/ROW]
[/TABLE]
Source: https://freestatistics.org/blog/index.php?pk=29332&T=1

Globally Unique Identifier (entire table): ba.freestatistics.org/blog/index.php?pk=29332&T=1

As an alternative you can also use a QR Code:  

The GUIDs for individual cells are displayed in the table below:

Central Tendency - Ungrouped Data
MeasureValueS.E.Value/S.E.
Arithmetic Mean116.3611764705881.3039716255845289.235972767757
Geometric Mean115.742518417325
Harmonic Mean115.120659156622
Quadratic Mean116.973296600750
Winsorized Mean ( 1 / 28 )116.4117647058821.2918798451694090.1103652488808
Winsorized Mean ( 2 / 28 )116.4305882352941.2885240329756390.359655897467
Winsorized Mean ( 3 / 28 )116.4129411764711.2787651477812991.0354347539516
Winsorized Mean ( 4 / 28 )116.4176470588241.2762846293439791.216053521434
Winsorized Mean ( 5 / 28 )116.3470588235291.2594267383784492.3809660999658
Winsorized Mean ( 6 / 28 )116.3117647058821.2532997474842192.8044268255527
Winsorized Mean ( 7 / 28 )116.2952941176471.2448863535616093.4184022380259
Winsorized Mean ( 8 / 28 )116.3141176470591.2166275112933295.6037214080522
Winsorized Mean ( 9 / 28 )116.3035294117651.2045030439138996.5572731421668
Winsorized Mean ( 10 / 28 )116.2682352941181.1874061505178897.9178314373797
Winsorized Mean ( 11 / 28 )116.11.13698579352509102.112093802022
Winsorized Mean ( 12 / 28 )116.11.10678452681428104.898466853505
Winsorized Mean ( 13 / 28 )116.0847058823531.09078455290077106.423129639711
Winsorized Mean ( 14 / 28 )116.3317647058821.02466529585450113.531477231177
Winsorized Mean ( 15 / 28 )116.2258823529410.994803237644483116.833035875661
Winsorized Mean ( 16 / 28 )116.2447058823530.981563244539954118.428136474115
Winsorized Mean ( 17 / 28 )116.3247058823530.964720690601657120.578636921124
Winsorized Mean ( 18 / 28 )116.3670588235290.947185700567406122.855590782061
Winsorized Mean ( 19 / 28 )116.2776470588240.916919053318112126.813426592067
Winsorized Mean ( 20 / 28 )116.3011764705880.869715324360553133.723269227315
Winsorized Mean ( 21 / 28 )116.3011764705880.85022075584102136.789387546233
Winsorized Mean ( 22 / 28 )116.3270588235290.846783977352278137.375129826217
Winsorized Mean ( 23 / 28 )116.3270588235290.811626627318062143.325828537588
Winsorized Mean ( 24 / 28 )116.3835294117650.796995139424082146.027903627950
Winsorized Mean ( 25 / 28 )116.4717647058820.778085007857726149.690282590793
Winsorized Mean ( 26 / 28 )116.5023529411760.766373058753843152.017808573040
Winsorized Mean ( 27 / 28 )116.4070588235290.746230092397206155.993519973954
Winsorized Mean ( 28 / 28 )116.4070588235290.663322399517085175.490921018613
Trimmed Mean ( 1 / 28 )116.3963855421691.2763386670993491.195533397649
Trimmed Mean ( 2 / 28 )116.3802469135801.2581909653986492.4980786813287
Trimmed Mean ( 3 / 28 )116.3531645569621.2390236487722693.9071378276396
Trimmed Mean ( 4 / 28 )116.3311688311691.2207637140708895.29376364181
Trimmed Mean ( 5 / 28 )116.3066666666671.2001116064216196.9132087751901
Trimmed Mean ( 6 / 28 )116.2972602739731.1806983535133498.4987062342494
Trimmed Mean ( 7 / 28 )116.2943661971831.15925961129249100.317793412576
Trimmed Mean ( 8 / 28 )116.2942028985511.13576643954278102.392709319150
Trimmed Mean ( 9 / 28 )116.2910447761191.11403352645691104.387383336633
Trimmed Mean ( 10 / 28 )116.2892307692311.09047476224835106.640918978689
Trimmed Mean ( 11 / 28 )116.2920634920631.06554112464599109.138972492216
Trimmed Mean ( 12 / 28 )116.3163934426231.04522379836898111.283720887459
Trimmed Mean ( 13 / 28 )116.3423728813561.02603514576158113.390241418095
Trimmed Mean ( 14 / 28 )116.3719298245611.00525796383162115.763250838621
Trimmed Mean ( 15 / 28 )116.3763636363640.991645110151458117.356867335925
Trimmed Mean ( 16 / 28 )116.3924528301890.979484214022677118.830350876379
Trimmed Mean ( 17 / 28 )116.4078431372550.965940943825688120.512381094658
Trimmed Mean ( 18 / 28 )116.4163265306120.951253858094992122.381975683916
Trimmed Mean ( 19 / 28 )116.4212765957450.935139559650948124.496151824868
Trimmed Mean ( 20 / 28 )116.4355555555560.91951434016729126.627231864999
Trimmed Mean ( 21 / 28 )116.4488372093020.907605200105358128.303404603438
Trimmed Mean ( 22 / 28 )116.4634146341460.89465047063331130.1775592335
Trimmed Mean ( 23 / 28 )116.4769230769230.876876907655982132.831554873856
Trimmed Mean ( 24 / 28 )116.4918918918920.859712033448487135.501060075451
Trimmed Mean ( 25 / 28 )116.5028571428570.838410718570084138.956784022935
Trimmed Mean ( 26 / 28 )116.5060606060610.812449758282751143.400941926939
Trimmed Mean ( 27 / 28 )116.5064516129030.777754356055186149.798520195799
Trimmed Mean ( 28 / 28 )116.5172413793100.732851051834752158.991709280624
Median116.6
Midrange114.9
Midmean - Weighted Average at Xnp116.448837209302
Midmean - Weighted Average at X(n+1)p116.448837209302
Midmean - Empirical Distribution Function116.448837209302
Midmean - Empirical Distribution Function - Averaging116.448837209302
Midmean - Empirical Distribution Function - Interpolation116.448837209302
Midmean - Closest Observation116.222727272727
Midmean - True Basic - Statistics Graphics Toolkit116.448837209302
Midmean - MS Excel (old versions)116.448837209302
Number of observations85


Parameters (Session):
Parameters (R input):
R code (references can be found in the software module):
geomean <- function(x) {
return(exp(mean(log(x))))
}
harmean <- function(x) {
return(1/mean(1/x))
}
quamean <- function(x) {
return(sqrt(mean(x*x)))
}
winmean <- function(x) {
x <-sort(x[!is.na(x)])
n<-length(x)
denom <- 3
nodenom <- n/denom
if (nodenom>40) denom <- n/40
sqrtn = sqrt(n)
roundnodenom = floor(nodenom)
win <- array(NA,dim=c(roundnodenom,2))
for (j in 1:roundnodenom) {
win[j,1] <- (j*x[j+1]+sum(x[(j+1):(n-j)])+j*x[n-j])/n
win[j,2] <- sd(c(rep(x[j+1],j),x[(j+1):(n-j)],rep(x[n-j],j)))/sqrtn
}
return(win)
}
trimean <- function(x) {
x <-sort(x[!is.na(x)])
n<-length(x)
denom <- 3
nodenom <- n/denom
if (nodenom>40) denom <- n/40
sqrtn = sqrt(n)
roundnodenom = floor(nodenom)
tri <- array(NA,dim=c(roundnodenom,2))
for (j in 1:roundnodenom) {
tri[j,1] <- mean(x,trim=j/n)
tri[j,2] <- sd(x[(j+1):(n-j)]) / sqrt(n-j*2)
}
return(tri)
}
midrange <- function(x) {
return((max(x)+min(x))/2)
}
q1 <- function(data,n,p,i,f) {
np <- n*p;
i <<- floor(np)
f <<- np - i
qvalue <- (1-f)*data[i] + f*data[i+1]
}
q2 <- function(data,n,p,i,f) {
np <- (n+1)*p
i <<- floor(np)
f <<- np - i
qvalue <- (1-f)*data[i] + f*data[i+1]
}
q3 <- function(data,n,p,i,f) {
np <- n*p
i <<- floor(np)
f <<- np - i
if (f==0) {
qvalue <- data[i]
} else {
qvalue <- data[i+1]
}
}
q4 <- function(data,n,p,i,f) {
np <- n*p
i <<- floor(np)
f <<- np - i
if (f==0) {
qvalue <- (data[i]+data[i+1])/2
} else {
qvalue <- data[i+1]
}
}
q5 <- function(data,n,p,i,f) {
np <- (n-1)*p
i <<- floor(np)
f <<- np - i
if (f==0) {
qvalue <- data[i+1]
} else {
qvalue <- data[i+1] + f*(data[i+2]-data[i+1])
}
}
q6 <- function(data,n,p,i,f) {
np <- n*p+0.5
i <<- floor(np)
f <<- np - i
qvalue <- data[i]
}
q7 <- function(data,n,p,i,f) {
np <- (n+1)*p
i <<- floor(np)
f <<- np - i
if (f==0) {
qvalue <- data[i]
} else {
qvalue <- f*data[i] + (1-f)*data[i+1]
}
}
q8 <- function(data,n,p,i,f) {
np <- (n+1)*p
i <<- floor(np)
f <<- np - i
if (f==0) {
qvalue <- data[i]
} else {
if (f == 0.5) {
qvalue <- (data[i]+data[i+1])/2
} else {
if (f < 0.5) {
qvalue <- data[i]
} else {
qvalue <- data[i+1]
}
}
}
}
midmean <- function(x,def) {
x <-sort(x[!is.na(x)])
n<-length(x)
if (def==1) {
qvalue1 <- q1(x,n,0.25,i,f)
qvalue3 <- q1(x,n,0.75,i,f)
}
if (def==2) {
qvalue1 <- q2(x,n,0.25,i,f)
qvalue3 <- q2(x,n,0.75,i,f)
}
if (def==3) {
qvalue1 <- q3(x,n,0.25,i,f)
qvalue3 <- q3(x,n,0.75,i,f)
}
if (def==4) {
qvalue1 <- q4(x,n,0.25,i,f)
qvalue3 <- q4(x,n,0.75,i,f)
}
if (def==5) {
qvalue1 <- q5(x,n,0.25,i,f)
qvalue3 <- q5(x,n,0.75,i,f)
}
if (def==6) {
qvalue1 <- q6(x,n,0.25,i,f)
qvalue3 <- q6(x,n,0.75,i,f)
}
if (def==7) {
qvalue1 <- q7(x,n,0.25,i,f)
qvalue3 <- q7(x,n,0.75,i,f)
}
if (def==8) {
qvalue1 <- q8(x,n,0.25,i,f)
qvalue3 <- q8(x,n,0.75,i,f)
}
midm <- 0
myn <- 0
roundno4 <- round(n/4)
round3no4 <- round(3*n/4)
for (i in 1:n) {
if ((x[i]>=qvalue1) & (x[i]<=qvalue3)){
midm = midm + x[i]
myn = myn + 1
}
}
midm = midm / myn
return(midm)
}
(arm <- mean(x))
sqrtn <- sqrt(length(x))
(armse <- sd(x) / sqrtn)
(armose <- arm / armse)
(geo <- geomean(x))
(har <- harmean(x))
(qua <- quamean(x))
(win <- winmean(x))
(tri <- trimean(x))
(midr <- midrange(x))
midm <- array(NA,dim=8)
for (j in 1:8) midm[j] <- midmean(x,j)
midm
bitmap(file='test1.png')
lb <- win[,1] - 2*win[,2]
ub <- win[,1] + 2*win[,2]
if ((ylimmin == '') | (ylimmax == '')) plot(win[,1],type='b',main=main, xlab='j', pch=19, ylab='Winsorized Mean(j/n)', ylim=c(min(lb),max(ub))) else plot(win[,1],type='l',main=main, xlab='j', pch=19, ylab='Winsorized Mean(j/n)', ylim=c(ylimmin,ylimmax))
lines(ub,lty=3)
lines(lb,lty=3)
grid()
dev.off()
bitmap(file='test2.png')
lb <- tri[,1] - 2*tri[,2]
ub <- tri[,1] + 2*tri[,2]
if ((ylimmin == '') | (ylimmax == '')) plot(tri[,1],type='b',main=main, xlab='j', pch=19, ylab='Trimmed Mean(j/n)', ylim=c(min(lb),max(ub))) else plot(tri[,1],type='l',main=main, xlab='j', pch=19, ylab='Trimmed Mean(j/n)', ylim=c(ylimmin,ylimmax))
lines(ub,lty=3)
lines(lb,lty=3)
grid()
dev.off()
load(file='createtable')
a<-table.start()
a<-table.row.start(a)
a<-table.element(a,'Central Tendency - Ungrouped Data',4,TRUE)
a<-table.row.end(a)
a<-table.row.start(a)
a<-table.element(a,'Measure',header=TRUE)
a<-table.element(a,'Value',header=TRUE)
a<-table.element(a,'S.E.',header=TRUE)
a<-table.element(a,'Value/S.E.',header=TRUE)
a<-table.row.end(a)
a<-table.row.start(a)
a<-table.element(a,hyperlink('arithmetic_mean.htm', 'Arithmetic Mean', 'click to view the definition of the Arithmetic Mean'),header=TRUE)
a<-table.element(a,arm)
a<-table.element(a,hyperlink('arithmetic_mean_standard_error.htm', armse, 'click to view the definition of the Standard Error of the Arithmetic Mean'))
a<-table.element(a,armose)
a<-table.row.end(a)
a<-table.row.start(a)
a<-table.element(a,hyperlink('geometric_mean.htm', 'Geometric Mean', 'click to view the definition of the Geometric Mean'),header=TRUE)
a<-table.element(a,geo)
a<-table.element(a,'')
a<-table.row.end(a)
a<-table.row.start(a)
a<-table.element(a,hyperlink('harmonic_mean.htm', 'Harmonic Mean', 'click to view the definition of the Harmonic Mean'),header=TRUE)
a<-table.element(a,har)
a<-table.element(a,'')
a<-table.row.end(a)
a<-table.row.start(a)
a<-table.element(a,hyperlink('quadratic_mean.htm', 'Quadratic Mean', 'click to view the definition of the Quadratic Mean'),header=TRUE)
a<-table.element(a,qua)
a<-table.element(a,'')
a<-table.row.end(a)
for (j in 1:length(win[,1])) {
a<-table.row.start(a)
mylabel <- paste('Winsorized Mean (',j)
mylabel <- paste(mylabel,'/')
mylabel <- paste(mylabel,length(win[,1]))
mylabel <- paste(mylabel,')')
a<-table.element(a,hyperlink('winsorized_mean.htm', mylabel, 'click to view the definition of the Winsorized Mean'),header=TRUE)
a<-table.element(a,win[j,1])
a<-table.element(a,win[j,2])
a<-table.element(a,win[j,1]/win[j,2])
a<-table.row.end(a)
}
for (j in 1:length(tri[,1])) {
a<-table.row.start(a)
mylabel <- paste('Trimmed Mean (',j)
mylabel <- paste(mylabel,'/')
mylabel <- paste(mylabel,length(tri[,1]))
mylabel <- paste(mylabel,')')
a<-table.element(a,hyperlink('arithmetic_mean.htm', mylabel, 'click to view the definition of the Trimmed Mean'),header=TRUE)
a<-table.element(a,tri[j,1])
a<-table.element(a,tri[j,2])
a<-table.element(a,tri[j,1]/tri[j,2])
a<-table.row.end(a)
}
a<-table.row.start(a)
a<-table.element(a,hyperlink('median_1.htm', 'Median', 'click to view the definition of the Median'),header=TRUE)
a<-table.element(a,median(x))
a<-table.element(a,'')
a<-table.row.end(a)
a<-table.row.start(a)
a<-table.element(a,hyperlink('midrange.htm', 'Midrange', 'click to view the definition of the Midrange'),header=TRUE)
a<-table.element(a,midr)
a<-table.element(a,'')
a<-table.row.end(a)
a<-table.row.start(a)
mymid <- hyperlink('midmean.htm', 'Midmean', 'click to view the definition of the Midmean')
mylabel <- paste(mymid,hyperlink('method_1.htm','Weighted Average at Xnp',''),sep=' - ')
a<-table.element(a,mylabel,header=TRUE)
a<-table.element(a,midm[1])
a<-table.element(a,'')
a<-table.row.end(a)
a<-table.row.start(a)
mymid <- hyperlink('midmean.htm', 'Midmean', 'click to view the definition of the Midmean')
mylabel <- paste(mymid,hyperlink('method_2.htm','Weighted Average at X(n+1)p',''),sep=' - ')
a<-table.element(a,mylabel,header=TRUE)
a<-table.element(a,midm[2])
a<-table.element(a,'')
a<-table.row.end(a)
a<-table.row.start(a)
mymid <- hyperlink('midmean.htm', 'Midmean', 'click to view the definition of the Midmean')
mylabel <- paste(mymid,hyperlink('method_3.htm','Empirical Distribution Function',''),sep=' - ')
a<-table.element(a,mylabel,header=TRUE)
a<-table.element(a,midm[3])
a<-table.element(a,'')
a<-table.row.end(a)
a<-table.row.start(a)
mymid <- hyperlink('midmean.htm', 'Midmean', 'click to view the definition of the Midmean')
mylabel <- paste(mymid,hyperlink('method_4.htm','Empirical Distribution Function - Averaging',''),sep=' - ')
a<-table.element(a,mylabel,header=TRUE)
a<-table.element(a,midm[4])
a<-table.element(a,'')
a<-table.row.end(a)
a<-table.row.start(a)
mymid <- hyperlink('midmean.htm', 'Midmean', 'click to view the definition of the Midmean')
mylabel <- paste(mymid,hyperlink('method_5.htm','Empirical Distribution Function - Interpolation',''),sep=' - ')
a<-table.element(a,mylabel,header=TRUE)
a<-table.element(a,midm[5])
a<-table.element(a,'')
a<-table.row.end(a)
a<-table.row.start(a)
mymid <- hyperlink('midmean.htm', 'Midmean', 'click to view the definition of the Midmean')
mylabel <- paste(mymid,hyperlink('method_6.htm','Closest Observation',''),sep=' - ')
a<-table.element(a,mylabel,header=TRUE)
a<-table.element(a,midm[6])
a<-table.element(a,'')
a<-table.row.end(a)
a<-table.row.start(a)
mymid <- hyperlink('midmean.htm', 'Midmean', 'click to view the definition of the Midmean')
mylabel <- paste(mymid,hyperlink('method_7.htm','True Basic - Statistics Graphics Toolkit',''),sep=' - ')
a<-table.element(a,mylabel,header=TRUE)
a<-table.element(a,midm[7])
a<-table.element(a,'')
a<-table.row.end(a)
a<-table.row.start(a)
mymid <- hyperlink('midmean.htm', 'Midmean', 'click to view the definition of the Midmean')
mylabel <- paste(mymid,hyperlink('method_8.htm','MS Excel (old versions)',''),sep=' - ')
a<-table.element(a,mylabel,header=TRUE)
a<-table.element(a,midm[8])
a<-table.element(a,'')
a<-table.row.end(a)
a<-table.row.start(a)
a<-table.element(a,'Number of observations',header=TRUE)
a<-table.element(a,length(x))
a<-table.element(a,'')
a<-table.row.end(a)
a<-table.end(a)
table.save(a,file='mytable.tab')