Free Statistics

of Irreproducible Research!

Author's title

Author*The author of this computation has been verified*
R Software Modulerwasp_centraltendency.wasp
Title produced by softwareCentral Tendency
Date of computationFri, 05 Dec 2008 08:30:30 -0700
Cite this page as followsStatistical Computations at FreeStatistics.org, Office for Research Development and Education, URL https://freestatistics.org/blog/index.php?v=date/2008/Dec/05/t1228491321eotxfa47ytbwamm.htm/, Retrieved Thu, 16 May 2024 07:21:52 +0000
Statistical Computations at FreeStatistics.org, Office for Research Development and Education, URL https://freestatistics.org/blog/index.php?pk=29323, Retrieved Thu, 16 May 2024 07:21:52 +0000
QR Codes:

Original text written by user:
IsPrivate?No (this computation is public)
User-defined keywords
Estimated Impact167
Family? (F = Feedback message, R = changed R code, M = changed R Module, P = changed Parameters, D = changed Data)
-       [Central Tendency] [Consumptiegoederen] [2008-12-05 15:30:30] [5925747fb2a6bb4cfcd8015825ee5e92] [Current]
Feedback Forum

Post a new message
Dataseries X:
98,6
98
106,8
96,6
100,1
107,7
91,5
97,8
107,4
117,5
105,6
97,4
99,5
98
104,3
100,6
101,1
103,9
96,9
95,5
108,4
117
103,8
100,8
110,6
104
112,6
107,3
98,9
109,8
104,9
102,2
123,9
124,9
112,7
121,9
100,6
104,3
120,4
107,5
102,9
125,6
107,5
108,8
128,4
121,1
119,5
128,7
108,7
105,5
119,8
111,3
110,6
120,1
97,5
107,7
127,3
117,2
119,8
116,2
111
112,4
130,6
109,1
118,8
123,9
101,6
112,8
128
129,6
125,8
119,5
115,7
113,6
129,7
112
116,8
127
112,1
114,2
121,1
131,6
125
120,4
117,7


Summary of computational transaction
Raw Inputview raw input (R code)
Raw Outputview raw output of R engine
Computing time11 seconds
R Server'George Udny Yule' @ 72.249.76.132

\begin{tabular}{lllllllll}
\hline
Summary of computational transaction \tabularnewline
Raw Input & view raw input (R code)  \tabularnewline
Raw Output & view raw output of R engine  \tabularnewline
Computing time & 11 seconds \tabularnewline
R Server & 'George Udny Yule' @ 72.249.76.132 \tabularnewline
\hline
\end{tabular}
%Source: https://freestatistics.org/blog/index.php?pk=29323&T=0

[TABLE]
[ROW][C]Summary of computational transaction[/C][/ROW]
[ROW][C]Raw Input[/C][C]view raw input (R code) [/C][/ROW]
[ROW][C]Raw Output[/C][C]view raw output of R engine [/C][/ROW]
[ROW][C]Computing time[/C][C]11 seconds[/C][/ROW]
[ROW][C]R Server[/C][C]'George Udny Yule' @ 72.249.76.132[/C][/ROW]
[/TABLE]
Source: https://freestatistics.org/blog/index.php?pk=29323&T=0

Globally Unique Identifier (entire table): ba.freestatistics.org/blog/index.php?pk=29323&T=0

As an alternative you can also use a QR Code:  

The GUIDs for individual cells are displayed in the table below:

Summary of computational transaction
Raw Inputview raw input (R code)
Raw Outputview raw output of R engine
Computing time11 seconds
R Server'George Udny Yule' @ 72.249.76.132


Central Tendency - Ungrouped Data
MeasureValueS.E.Value/S.E.
Arithmetic Mean111.8294117647061.11024995738325100.724535966907
Geometric Mean111.368001687276
Harmonic Mean110.909122188267
Quadratic Mean112.291408188433
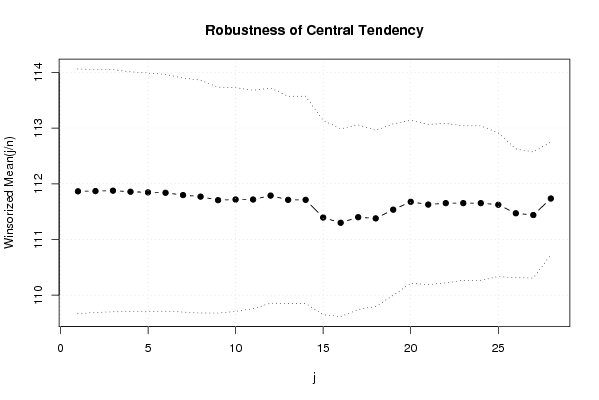
Winsorized Mean ( 1 / 28 )111.8647058823531.09850127833061101.833933277122
Winsorized Mean ( 2 / 28 )111.8694117647061.08983464879175102.648059399406
Winsorized Mean ( 3 / 28 )111.8764705882351.08739743656067102.884618656164
Winsorized Mean ( 4 / 28 )111.8576470588241.07552785095548104.002557404209
Winsorized Mean ( 5 / 28 )111.8458823529411.07132023179389104.400046814816
Winsorized Mean ( 6 / 28 )111.8388235294121.06281442092528105.228929272568
Winsorized Mean ( 7 / 28 )111.7976470588241.04994594561488106.479431180003
Winsorized Mean ( 8 / 28 )111.7694117647061.04501487468728106.954852482987
Winsorized Mean ( 9 / 28 )111.7058823529411.01359436543933110.207678891865
Winsorized Mean ( 10 / 28 )111.7176470588241.00431307470253111.237869816554
Winsorized Mean ( 11 / 28 )111.7176470588240.979996250593908113.998035187501
Winsorized Mean ( 12 / 28 )111.7882352941180.965323724404584115.803882643689
Winsorized Mean ( 13 / 28 )111.7117647058820.930069440744625120.111208703346
Winsorized Mean ( 14 / 28 )111.7117647058820.930069440744625120.111208703346
Winsorized Mean ( 15 / 28 )111.3941176470590.872098394952936127.731134802823
Winsorized Mean ( 16 / 28 )111.30.842718024886016132.072646737388
Winsorized Mean ( 17 / 28 )111.40.8284709685066134.464579007288
Winsorized Mean ( 18 / 28 )111.3788235294120.790328609664305140.927232251810
Winsorized Mean ( 19 / 28 )111.5352941176470.769048861211666145.030179151321
Winsorized Mean ( 20 / 28 )111.6764705882350.731629636178387152.640714735900
Winsorized Mean ( 21 / 28 )111.6270588235290.718365301599012155.390382267989
Winsorized Mean ( 22 / 28 )111.6529411764710.715059277939396156.145014296190
Winsorized Mean ( 23 / 28 )111.6529411764710.693795205931789160.930689952689
Winsorized Mean ( 24 / 28 )111.6529411764710.693795205931789160.930689952689
Winsorized Mean ( 25 / 28 )111.6235294117650.644171556778573173.282300711911
Winsorized Mean ( 26 / 28 )111.4705882352940.577514774883237193.017725404223
Winsorized Mean ( 27 / 28 )111.4388235294120.565475170451162197.071117093436
Winsorized Mean ( 28 / 28 )111.7352941176470.505470648704026221.051992641165
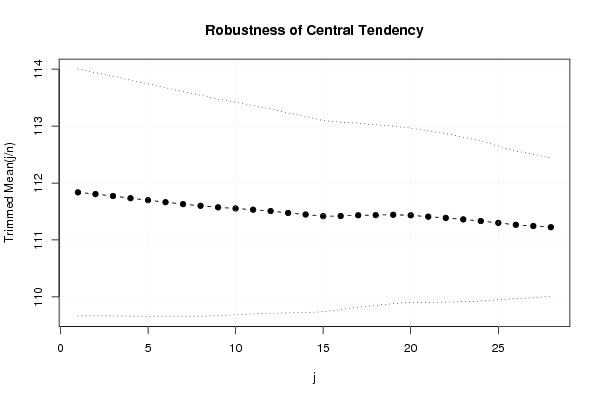
Trimmed Mean ( 1 / 28 )111.8361445783131.08397020917516103.172710496735
Trimmed Mean ( 2 / 28 )111.8061728395061.06704036520865104.781577609432
Trimmed Mean ( 3 / 28 )111.7721518987341.05253582710736106.193204088751
Trimmed Mean ( 4 / 28 )111.7337662337661.03652801670987107.796185373193
Trimmed Mean ( 5 / 28 )111.6986666666671.02173936369670109.322074332672
Trimmed Mean ( 6 / 28 )111.6643835616441.00543683733864111.06056533319
Trimmed Mean ( 7 / 28 )111.6295774647890.988276133355119112.953833141569
Trimmed Mean ( 8 / 28 )111.60.970884761854549114.946700560863
Trimmed Mean ( 9 / 28 )111.5731343283580.951158169714823117.302398150888
Trimmed Mean ( 10 / 28 )111.5538461538460.93411073745166119.422507076811
Trimmed Mean ( 11 / 28 )111.5317460317460.915309917315119121.851346655243
Trimmed Mean ( 12 / 28 )111.5081967213110.897206639825113124.283739967693
Trimmed Mean ( 13 / 28 )111.4745762711860.877784766977737126.995341528881
Trimmed Mean ( 14 / 28 )111.4473684210530.860578815471793129.502802552668
Trimmed Mean ( 15 / 28 )111.4181818181820.839111647094816132.781117034825
Trimmed Mean ( 16 / 28 )111.4207547169810.823411777705714135.315959443080
Trimmed Mean ( 17 / 28 )111.4333333333330.80886590500996137.764903481698
Trimmed Mean ( 18 / 28 )111.4367346938780.792780422486892140.564438188709
Trimmed Mean ( 19 / 28 )111.4425531914890.779173550407415143.026612149781
Trimmed Mean ( 20 / 28 )111.4333333333330.765202818562081145.625879348865
Trimmed Mean ( 21 / 28 )111.4093023255810.753712215359665147.814112674846
Trimmed Mean ( 22 / 28 )111.3878048780490.740444783287023150.433641227871
Trimmed Mean ( 23 / 28 )111.3615384615380.722574264656255154.117775720279
Trimmed Mean ( 24 / 28 )111.3324324324320.702655346059615158.445293352947
Trimmed Mean ( 25 / 28 )111.30.674530649146987165.003621615638
Trimmed Mean ( 26 / 28 )111.2666666666670.648565822613732171.558017377882
Trimmed Mean ( 27 / 28 )111.2451612903230.630358128448099176.479300051545
Trimmed Mean ( 28 / 28 )111.2241379310340.6063428116436183.434413330541
Median111
Midrange111.55
Midmean - Weighted Average at Xnp111.409302325581
Midmean - Weighted Average at X(n+1)p111.409302325581
Midmean - Empirical Distribution Function111.409302325581
Midmean - Empirical Distribution Function - Averaging111.409302325581
Midmean - Empirical Distribution Function - Interpolation111.409302325581
Midmean - Closest Observation111.236363636364
Midmean - True Basic - Statistics Graphics Toolkit111.409302325581
Midmean - MS Excel (old versions)111.409302325581
Number of observations85

\begin{tabular}{lllllllll}
\hline
Central Tendency - Ungrouped Data \tabularnewline
Measure & Value & S.E. & Value/S.E. \tabularnewline
Arithmetic Mean & 111.829411764706 & 1.11024995738325 & 100.724535966907 \tabularnewline
Geometric Mean & 111.368001687276 &  &  \tabularnewline
Harmonic Mean & 110.909122188267 &  &  \tabularnewline
Quadratic Mean & 112.291408188433 &  &  \tabularnewline
Winsorized Mean ( 1 / 28 ) & 111.864705882353 & 1.09850127833061 & 101.833933277122 \tabularnewline
Winsorized Mean ( 2 / 28 ) & 111.869411764706 & 1.08983464879175 & 102.648059399406 \tabularnewline
Winsorized Mean ( 3 / 28 ) & 111.876470588235 & 1.08739743656067 & 102.884618656164 \tabularnewline
Winsorized Mean ( 4 / 28 ) & 111.857647058824 & 1.07552785095548 & 104.002557404209 \tabularnewline
Winsorized Mean ( 5 / 28 ) & 111.845882352941 & 1.07132023179389 & 104.400046814816 \tabularnewline
Winsorized Mean ( 6 / 28 ) & 111.838823529412 & 1.06281442092528 & 105.228929272568 \tabularnewline
Winsorized Mean ( 7 / 28 ) & 111.797647058824 & 1.04994594561488 & 106.479431180003 \tabularnewline
Winsorized Mean ( 8 / 28 ) & 111.769411764706 & 1.04501487468728 & 106.954852482987 \tabularnewline
Winsorized Mean ( 9 / 28 ) & 111.705882352941 & 1.01359436543933 & 110.207678891865 \tabularnewline
Winsorized Mean ( 10 / 28 ) & 111.717647058824 & 1.00431307470253 & 111.237869816554 \tabularnewline
Winsorized Mean ( 11 / 28 ) & 111.717647058824 & 0.979996250593908 & 113.998035187501 \tabularnewline
Winsorized Mean ( 12 / 28 ) & 111.788235294118 & 0.965323724404584 & 115.803882643689 \tabularnewline
Winsorized Mean ( 13 / 28 ) & 111.711764705882 & 0.930069440744625 & 120.111208703346 \tabularnewline
Winsorized Mean ( 14 / 28 ) & 111.711764705882 & 0.930069440744625 & 120.111208703346 \tabularnewline
Winsorized Mean ( 15 / 28 ) & 111.394117647059 & 0.872098394952936 & 127.731134802823 \tabularnewline
Winsorized Mean ( 16 / 28 ) & 111.3 & 0.842718024886016 & 132.072646737388 \tabularnewline
Winsorized Mean ( 17 / 28 ) & 111.4 & 0.8284709685066 & 134.464579007288 \tabularnewline
Winsorized Mean ( 18 / 28 ) & 111.378823529412 & 0.790328609664305 & 140.927232251810 \tabularnewline
Winsorized Mean ( 19 / 28 ) & 111.535294117647 & 0.769048861211666 & 145.030179151321 \tabularnewline
Winsorized Mean ( 20 / 28 ) & 111.676470588235 & 0.731629636178387 & 152.640714735900 \tabularnewline
Winsorized Mean ( 21 / 28 ) & 111.627058823529 & 0.718365301599012 & 155.390382267989 \tabularnewline
Winsorized Mean ( 22 / 28 ) & 111.652941176471 & 0.715059277939396 & 156.145014296190 \tabularnewline
Winsorized Mean ( 23 / 28 ) & 111.652941176471 & 0.693795205931789 & 160.930689952689 \tabularnewline
Winsorized Mean ( 24 / 28 ) & 111.652941176471 & 0.693795205931789 & 160.930689952689 \tabularnewline
Winsorized Mean ( 25 / 28 ) & 111.623529411765 & 0.644171556778573 & 173.282300711911 \tabularnewline
Winsorized Mean ( 26 / 28 ) & 111.470588235294 & 0.577514774883237 & 193.017725404223 \tabularnewline
Winsorized Mean ( 27 / 28 ) & 111.438823529412 & 0.565475170451162 & 197.071117093436 \tabularnewline
Winsorized Mean ( 28 / 28 ) & 111.735294117647 & 0.505470648704026 & 221.051992641165 \tabularnewline
Trimmed Mean ( 1 / 28 ) & 111.836144578313 & 1.08397020917516 & 103.172710496735 \tabularnewline
Trimmed Mean ( 2 / 28 ) & 111.806172839506 & 1.06704036520865 & 104.781577609432 \tabularnewline
Trimmed Mean ( 3 / 28 ) & 111.772151898734 & 1.05253582710736 & 106.193204088751 \tabularnewline
Trimmed Mean ( 4 / 28 ) & 111.733766233766 & 1.03652801670987 & 107.796185373193 \tabularnewline
Trimmed Mean ( 5 / 28 ) & 111.698666666667 & 1.02173936369670 & 109.322074332672 \tabularnewline
Trimmed Mean ( 6 / 28 ) & 111.664383561644 & 1.00543683733864 & 111.06056533319 \tabularnewline
Trimmed Mean ( 7 / 28 ) & 111.629577464789 & 0.988276133355119 & 112.953833141569 \tabularnewline
Trimmed Mean ( 8 / 28 ) & 111.6 & 0.970884761854549 & 114.946700560863 \tabularnewline
Trimmed Mean ( 9 / 28 ) & 111.573134328358 & 0.951158169714823 & 117.302398150888 \tabularnewline
Trimmed Mean ( 10 / 28 ) & 111.553846153846 & 0.93411073745166 & 119.422507076811 \tabularnewline
Trimmed Mean ( 11 / 28 ) & 111.531746031746 & 0.915309917315119 & 121.851346655243 \tabularnewline
Trimmed Mean ( 12 / 28 ) & 111.508196721311 & 0.897206639825113 & 124.283739967693 \tabularnewline
Trimmed Mean ( 13 / 28 ) & 111.474576271186 & 0.877784766977737 & 126.995341528881 \tabularnewline
Trimmed Mean ( 14 / 28 ) & 111.447368421053 & 0.860578815471793 & 129.502802552668 \tabularnewline
Trimmed Mean ( 15 / 28 ) & 111.418181818182 & 0.839111647094816 & 132.781117034825 \tabularnewline
Trimmed Mean ( 16 / 28 ) & 111.420754716981 & 0.823411777705714 & 135.315959443080 \tabularnewline
Trimmed Mean ( 17 / 28 ) & 111.433333333333 & 0.80886590500996 & 137.764903481698 \tabularnewline
Trimmed Mean ( 18 / 28 ) & 111.436734693878 & 0.792780422486892 & 140.564438188709 \tabularnewline
Trimmed Mean ( 19 / 28 ) & 111.442553191489 & 0.779173550407415 & 143.026612149781 \tabularnewline
Trimmed Mean ( 20 / 28 ) & 111.433333333333 & 0.765202818562081 & 145.625879348865 \tabularnewline
Trimmed Mean ( 21 / 28 ) & 111.409302325581 & 0.753712215359665 & 147.814112674846 \tabularnewline
Trimmed Mean ( 22 / 28 ) & 111.387804878049 & 0.740444783287023 & 150.433641227871 \tabularnewline
Trimmed Mean ( 23 / 28 ) & 111.361538461538 & 0.722574264656255 & 154.117775720279 \tabularnewline
Trimmed Mean ( 24 / 28 ) & 111.332432432432 & 0.702655346059615 & 158.445293352947 \tabularnewline
Trimmed Mean ( 25 / 28 ) & 111.3 & 0.674530649146987 & 165.003621615638 \tabularnewline
Trimmed Mean ( 26 / 28 ) & 111.266666666667 & 0.648565822613732 & 171.558017377882 \tabularnewline
Trimmed Mean ( 27 / 28 ) & 111.245161290323 & 0.630358128448099 & 176.479300051545 \tabularnewline
Trimmed Mean ( 28 / 28 ) & 111.224137931034 & 0.6063428116436 & 183.434413330541 \tabularnewline
Median & 111 &  &  \tabularnewline
Midrange & 111.55 &  &  \tabularnewline
Midmean - Weighted Average at Xnp & 111.409302325581 &  &  \tabularnewline
Midmean - Weighted Average at X(n+1)p & 111.409302325581 &  &  \tabularnewline
Midmean - Empirical Distribution Function & 111.409302325581 &  &  \tabularnewline
Midmean - Empirical Distribution Function - Averaging & 111.409302325581 &  &  \tabularnewline
Midmean - Empirical Distribution Function - Interpolation & 111.409302325581 &  &  \tabularnewline
Midmean - Closest Observation & 111.236363636364 &  &  \tabularnewline
Midmean - True Basic - Statistics Graphics Toolkit & 111.409302325581 &  &  \tabularnewline
Midmean - MS Excel (old versions) & 111.409302325581 &  &  \tabularnewline
Number of observations & 85 &  &  \tabularnewline
\hline
\end{tabular}
%Source: https://freestatistics.org/blog/index.php?pk=29323&T=1

[TABLE]
[ROW][C]Central Tendency - Ungrouped Data[/C][/ROW]
[ROW][C]Measure[/C][C]Value[/C][C]S.E.[/C][C]Value/S.E.[/C][/ROW]
[ROW][C]Arithmetic Mean[/C][C]111.829411764706[/C][C]1.11024995738325[/C][C]100.724535966907[/C][/ROW]
[ROW][C]Geometric Mean[/C][C]111.368001687276[/C][C][/C][C][/C][/ROW]
[ROW][C]Harmonic Mean[/C][C]110.909122188267[/C][C][/C][C][/C][/ROW]
[ROW][C]Quadratic Mean[/C][C]112.291408188433[/C][C][/C][C][/C][/ROW]
[ROW][C]Winsorized Mean ( 1 / 28 )[/C][C]111.864705882353[/C][C]1.09850127833061[/C][C]101.833933277122[/C][/ROW]
[ROW][C]Winsorized Mean ( 2 / 28 )[/C][C]111.869411764706[/C][C]1.08983464879175[/C][C]102.648059399406[/C][/ROW]
[ROW][C]Winsorized Mean ( 3 / 28 )[/C][C]111.876470588235[/C][C]1.08739743656067[/C][C]102.884618656164[/C][/ROW]
[ROW][C]Winsorized Mean ( 4 / 28 )[/C][C]111.857647058824[/C][C]1.07552785095548[/C][C]104.002557404209[/C][/ROW]
[ROW][C]Winsorized Mean ( 5 / 28 )[/C][C]111.845882352941[/C][C]1.07132023179389[/C][C]104.400046814816[/C][/ROW]
[ROW][C]Winsorized Mean ( 6 / 28 )[/C][C]111.838823529412[/C][C]1.06281442092528[/C][C]105.228929272568[/C][/ROW]
[ROW][C]Winsorized Mean ( 7 / 28 )[/C][C]111.797647058824[/C][C]1.04994594561488[/C][C]106.479431180003[/C][/ROW]
[ROW][C]Winsorized Mean ( 8 / 28 )[/C][C]111.769411764706[/C][C]1.04501487468728[/C][C]106.954852482987[/C][/ROW]
[ROW][C]Winsorized Mean ( 9 / 28 )[/C][C]111.705882352941[/C][C]1.01359436543933[/C][C]110.207678891865[/C][/ROW]
[ROW][C]Winsorized Mean ( 10 / 28 )[/C][C]111.717647058824[/C][C]1.00431307470253[/C][C]111.237869816554[/C][/ROW]
[ROW][C]Winsorized Mean ( 11 / 28 )[/C][C]111.717647058824[/C][C]0.979996250593908[/C][C]113.998035187501[/C][/ROW]
[ROW][C]Winsorized Mean ( 12 / 28 )[/C][C]111.788235294118[/C][C]0.965323724404584[/C][C]115.803882643689[/C][/ROW]
[ROW][C]Winsorized Mean ( 13 / 28 )[/C][C]111.711764705882[/C][C]0.930069440744625[/C][C]120.111208703346[/C][/ROW]
[ROW][C]Winsorized Mean ( 14 / 28 )[/C][C]111.711764705882[/C][C]0.930069440744625[/C][C]120.111208703346[/C][/ROW]
[ROW][C]Winsorized Mean ( 15 / 28 )[/C][C]111.394117647059[/C][C]0.872098394952936[/C][C]127.731134802823[/C][/ROW]
[ROW][C]Winsorized Mean ( 16 / 28 )[/C][C]111.3[/C][C]0.842718024886016[/C][C]132.072646737388[/C][/ROW]
[ROW][C]Winsorized Mean ( 17 / 28 )[/C][C]111.4[/C][C]0.8284709685066[/C][C]134.464579007288[/C][/ROW]
[ROW][C]Winsorized Mean ( 18 / 28 )[/C][C]111.378823529412[/C][C]0.790328609664305[/C][C]140.927232251810[/C][/ROW]
[ROW][C]Winsorized Mean ( 19 / 28 )[/C][C]111.535294117647[/C][C]0.769048861211666[/C][C]145.030179151321[/C][/ROW]
[ROW][C]Winsorized Mean ( 20 / 28 )[/C][C]111.676470588235[/C][C]0.731629636178387[/C][C]152.640714735900[/C][/ROW]
[ROW][C]Winsorized Mean ( 21 / 28 )[/C][C]111.627058823529[/C][C]0.718365301599012[/C][C]155.390382267989[/C][/ROW]
[ROW][C]Winsorized Mean ( 22 / 28 )[/C][C]111.652941176471[/C][C]0.715059277939396[/C][C]156.145014296190[/C][/ROW]
[ROW][C]Winsorized Mean ( 23 / 28 )[/C][C]111.652941176471[/C][C]0.693795205931789[/C][C]160.930689952689[/C][/ROW]
[ROW][C]Winsorized Mean ( 24 / 28 )[/C][C]111.652941176471[/C][C]0.693795205931789[/C][C]160.930689952689[/C][/ROW]
[ROW][C]Winsorized Mean ( 25 / 28 )[/C][C]111.623529411765[/C][C]0.644171556778573[/C][C]173.282300711911[/C][/ROW]
[ROW][C]Winsorized Mean ( 26 / 28 )[/C][C]111.470588235294[/C][C]0.577514774883237[/C][C]193.017725404223[/C][/ROW]
[ROW][C]Winsorized Mean ( 27 / 28 )[/C][C]111.438823529412[/C][C]0.565475170451162[/C][C]197.071117093436[/C][/ROW]
[ROW][C]Winsorized Mean ( 28 / 28 )[/C][C]111.735294117647[/C][C]0.505470648704026[/C][C]221.051992641165[/C][/ROW]
[ROW][C]Trimmed Mean ( 1 / 28 )[/C][C]111.836144578313[/C][C]1.08397020917516[/C][C]103.172710496735[/C][/ROW]
[ROW][C]Trimmed Mean ( 2 / 28 )[/C][C]111.806172839506[/C][C]1.06704036520865[/C][C]104.781577609432[/C][/ROW]
[ROW][C]Trimmed Mean ( 3 / 28 )[/C][C]111.772151898734[/C][C]1.05253582710736[/C][C]106.193204088751[/C][/ROW]
[ROW][C]Trimmed Mean ( 4 / 28 )[/C][C]111.733766233766[/C][C]1.03652801670987[/C][C]107.796185373193[/C][/ROW]
[ROW][C]Trimmed Mean ( 5 / 28 )[/C][C]111.698666666667[/C][C]1.02173936369670[/C][C]109.322074332672[/C][/ROW]
[ROW][C]Trimmed Mean ( 6 / 28 )[/C][C]111.664383561644[/C][C]1.00543683733864[/C][C]111.06056533319[/C][/ROW]
[ROW][C]Trimmed Mean ( 7 / 28 )[/C][C]111.629577464789[/C][C]0.988276133355119[/C][C]112.953833141569[/C][/ROW]
[ROW][C]Trimmed Mean ( 8 / 28 )[/C][C]111.6[/C][C]0.970884761854549[/C][C]114.946700560863[/C][/ROW]
[ROW][C]Trimmed Mean ( 9 / 28 )[/C][C]111.573134328358[/C][C]0.951158169714823[/C][C]117.302398150888[/C][/ROW]
[ROW][C]Trimmed Mean ( 10 / 28 )[/C][C]111.553846153846[/C][C]0.93411073745166[/C][C]119.422507076811[/C][/ROW]
[ROW][C]Trimmed Mean ( 11 / 28 )[/C][C]111.531746031746[/C][C]0.915309917315119[/C][C]121.851346655243[/C][/ROW]
[ROW][C]Trimmed Mean ( 12 / 28 )[/C][C]111.508196721311[/C][C]0.897206639825113[/C][C]124.283739967693[/C][/ROW]
[ROW][C]Trimmed Mean ( 13 / 28 )[/C][C]111.474576271186[/C][C]0.877784766977737[/C][C]126.995341528881[/C][/ROW]
[ROW][C]Trimmed Mean ( 14 / 28 )[/C][C]111.447368421053[/C][C]0.860578815471793[/C][C]129.502802552668[/C][/ROW]
[ROW][C]Trimmed Mean ( 15 / 28 )[/C][C]111.418181818182[/C][C]0.839111647094816[/C][C]132.781117034825[/C][/ROW]
[ROW][C]Trimmed Mean ( 16 / 28 )[/C][C]111.420754716981[/C][C]0.823411777705714[/C][C]135.315959443080[/C][/ROW]
[ROW][C]Trimmed Mean ( 17 / 28 )[/C][C]111.433333333333[/C][C]0.80886590500996[/C][C]137.764903481698[/C][/ROW]
[ROW][C]Trimmed Mean ( 18 / 28 )[/C][C]111.436734693878[/C][C]0.792780422486892[/C][C]140.564438188709[/C][/ROW]
[ROW][C]Trimmed Mean ( 19 / 28 )[/C][C]111.442553191489[/C][C]0.779173550407415[/C][C]143.026612149781[/C][/ROW]
[ROW][C]Trimmed Mean ( 20 / 28 )[/C][C]111.433333333333[/C][C]0.765202818562081[/C][C]145.625879348865[/C][/ROW]
[ROW][C]Trimmed Mean ( 21 / 28 )[/C][C]111.409302325581[/C][C]0.753712215359665[/C][C]147.814112674846[/C][/ROW]
[ROW][C]Trimmed Mean ( 22 / 28 )[/C][C]111.387804878049[/C][C]0.740444783287023[/C][C]150.433641227871[/C][/ROW]
[ROW][C]Trimmed Mean ( 23 / 28 )[/C][C]111.361538461538[/C][C]0.722574264656255[/C][C]154.117775720279[/C][/ROW]
[ROW][C]Trimmed Mean ( 24 / 28 )[/C][C]111.332432432432[/C][C]0.702655346059615[/C][C]158.445293352947[/C][/ROW]
[ROW][C]Trimmed Mean ( 25 / 28 )[/C][C]111.3[/C][C]0.674530649146987[/C][C]165.003621615638[/C][/ROW]
[ROW][C]Trimmed Mean ( 26 / 28 )[/C][C]111.266666666667[/C][C]0.648565822613732[/C][C]171.558017377882[/C][/ROW]
[ROW][C]Trimmed Mean ( 27 / 28 )[/C][C]111.245161290323[/C][C]0.630358128448099[/C][C]176.479300051545[/C][/ROW]
[ROW][C]Trimmed Mean ( 28 / 28 )[/C][C]111.224137931034[/C][C]0.6063428116436[/C][C]183.434413330541[/C][/ROW]
[ROW][C]Median[/C][C]111[/C][C][/C][C][/C][/ROW]
[ROW][C]Midrange[/C][C]111.55[/C][C][/C][C][/C][/ROW]
[ROW][C]Midmean - Weighted Average at Xnp[/C][C]111.409302325581[/C][C][/C][C][/C][/ROW]
[ROW][C]Midmean - Weighted Average at X(n+1)p[/C][C]111.409302325581[/C][C][/C][C][/C][/ROW]
[ROW][C]Midmean - Empirical Distribution Function[/C][C]111.409302325581[/C][C][/C][C][/C][/ROW]
[ROW][C]Midmean - Empirical Distribution Function - Averaging[/C][C]111.409302325581[/C][C][/C][C][/C][/ROW]
[ROW][C]Midmean - Empirical Distribution Function - Interpolation[/C][C]111.409302325581[/C][C][/C][C][/C][/ROW]
[ROW][C]Midmean - Closest Observation[/C][C]111.236363636364[/C][C][/C][C][/C][/ROW]
[ROW][C]Midmean - True Basic - Statistics Graphics Toolkit[/C][C]111.409302325581[/C][C][/C][C][/C][/ROW]
[ROW][C]Midmean - MS Excel (old versions)[/C][C]111.409302325581[/C][C][/C][C][/C][/ROW]
[ROW][C]Number of observations[/C][C]85[/C][C][/C][C][/C][/ROW]
[/TABLE]
Source: https://freestatistics.org/blog/index.php?pk=29323&T=1

Globally Unique Identifier (entire table): ba.freestatistics.org/blog/index.php?pk=29323&T=1

As an alternative you can also use a QR Code:  

The GUIDs for individual cells are displayed in the table below:

Central Tendency - Ungrouped Data
MeasureValueS.E.Value/S.E.
Arithmetic Mean111.8294117647061.11024995738325100.724535966907
Geometric Mean111.368001687276
Harmonic Mean110.909122188267
Quadratic Mean112.291408188433
Winsorized Mean ( 1 / 28 )111.8647058823531.09850127833061101.833933277122
Winsorized Mean ( 2 / 28 )111.8694117647061.08983464879175102.648059399406
Winsorized Mean ( 3 / 28 )111.8764705882351.08739743656067102.884618656164
Winsorized Mean ( 4 / 28 )111.8576470588241.07552785095548104.002557404209
Winsorized Mean ( 5 / 28 )111.8458823529411.07132023179389104.400046814816
Winsorized Mean ( 6 / 28 )111.8388235294121.06281442092528105.228929272568
Winsorized Mean ( 7 / 28 )111.7976470588241.04994594561488106.479431180003
Winsorized Mean ( 8 / 28 )111.7694117647061.04501487468728106.954852482987
Winsorized Mean ( 9 / 28 )111.7058823529411.01359436543933110.207678891865
Winsorized Mean ( 10 / 28 )111.7176470588241.00431307470253111.237869816554
Winsorized Mean ( 11 / 28 )111.7176470588240.979996250593908113.998035187501
Winsorized Mean ( 12 / 28 )111.7882352941180.965323724404584115.803882643689
Winsorized Mean ( 13 / 28 )111.7117647058820.930069440744625120.111208703346
Winsorized Mean ( 14 / 28 )111.7117647058820.930069440744625120.111208703346
Winsorized Mean ( 15 / 28 )111.3941176470590.872098394952936127.731134802823
Winsorized Mean ( 16 / 28 )111.30.842718024886016132.072646737388
Winsorized Mean ( 17 / 28 )111.40.8284709685066134.464579007288
Winsorized Mean ( 18 / 28 )111.3788235294120.790328609664305140.927232251810
Winsorized Mean ( 19 / 28 )111.5352941176470.769048861211666145.030179151321
Winsorized Mean ( 20 / 28 )111.6764705882350.731629636178387152.640714735900
Winsorized Mean ( 21 / 28 )111.6270588235290.718365301599012155.390382267989
Winsorized Mean ( 22 / 28 )111.6529411764710.715059277939396156.145014296190
Winsorized Mean ( 23 / 28 )111.6529411764710.693795205931789160.930689952689
Winsorized Mean ( 24 / 28 )111.6529411764710.693795205931789160.930689952689
Winsorized Mean ( 25 / 28 )111.6235294117650.644171556778573173.282300711911
Winsorized Mean ( 26 / 28 )111.4705882352940.577514774883237193.017725404223
Winsorized Mean ( 27 / 28 )111.4388235294120.565475170451162197.071117093436
Winsorized Mean ( 28 / 28 )111.7352941176470.505470648704026221.051992641165
Trimmed Mean ( 1 / 28 )111.8361445783131.08397020917516103.172710496735
Trimmed Mean ( 2 / 28 )111.8061728395061.06704036520865104.781577609432
Trimmed Mean ( 3 / 28 )111.7721518987341.05253582710736106.193204088751
Trimmed Mean ( 4 / 28 )111.7337662337661.03652801670987107.796185373193
Trimmed Mean ( 5 / 28 )111.6986666666671.02173936369670109.322074332672
Trimmed Mean ( 6 / 28 )111.6643835616441.00543683733864111.06056533319
Trimmed Mean ( 7 / 28 )111.6295774647890.988276133355119112.953833141569
Trimmed Mean ( 8 / 28 )111.60.970884761854549114.946700560863
Trimmed Mean ( 9 / 28 )111.5731343283580.951158169714823117.302398150888
Trimmed Mean ( 10 / 28 )111.5538461538460.93411073745166119.422507076811
Trimmed Mean ( 11 / 28 )111.5317460317460.915309917315119121.851346655243
Trimmed Mean ( 12 / 28 )111.5081967213110.897206639825113124.283739967693
Trimmed Mean ( 13 / 28 )111.4745762711860.877784766977737126.995341528881
Trimmed Mean ( 14 / 28 )111.4473684210530.860578815471793129.502802552668
Trimmed Mean ( 15 / 28 )111.4181818181820.839111647094816132.781117034825
Trimmed Mean ( 16 / 28 )111.4207547169810.823411777705714135.315959443080
Trimmed Mean ( 17 / 28 )111.4333333333330.80886590500996137.764903481698
Trimmed Mean ( 18 / 28 )111.4367346938780.792780422486892140.564438188709
Trimmed Mean ( 19 / 28 )111.4425531914890.779173550407415143.026612149781
Trimmed Mean ( 20 / 28 )111.4333333333330.765202818562081145.625879348865
Trimmed Mean ( 21 / 28 )111.4093023255810.753712215359665147.814112674846
Trimmed Mean ( 22 / 28 )111.3878048780490.740444783287023150.433641227871
Trimmed Mean ( 23 / 28 )111.3615384615380.722574264656255154.117775720279
Trimmed Mean ( 24 / 28 )111.3324324324320.702655346059615158.445293352947
Trimmed Mean ( 25 / 28 )111.30.674530649146987165.003621615638
Trimmed Mean ( 26 / 28 )111.2666666666670.648565822613732171.558017377882
Trimmed Mean ( 27 / 28 )111.2451612903230.630358128448099176.479300051545
Trimmed Mean ( 28 / 28 )111.2241379310340.6063428116436183.434413330541
Median111
Midrange111.55
Midmean - Weighted Average at Xnp111.409302325581
Midmean - Weighted Average at X(n+1)p111.409302325581
Midmean - Empirical Distribution Function111.409302325581
Midmean - Empirical Distribution Function - Averaging111.409302325581
Midmean - Empirical Distribution Function - Interpolation111.409302325581
Midmean - Closest Observation111.236363636364
Midmean - True Basic - Statistics Graphics Toolkit111.409302325581
Midmean - MS Excel (old versions)111.409302325581
Number of observations85


Parameters (Session):
Parameters (R input):
R code (references can be found in the software module):
geomean <- function(x) {
return(exp(mean(log(x))))
}
harmean <- function(x) {
return(1/mean(1/x))
}
quamean <- function(x) {
return(sqrt(mean(x*x)))
}
winmean <- function(x) {
x <-sort(x[!is.na(x)])
n<-length(x)
denom <- 3
nodenom <- n/denom
if (nodenom>40) denom <- n/40
sqrtn = sqrt(n)
roundnodenom = floor(nodenom)
win <- array(NA,dim=c(roundnodenom,2))
for (j in 1:roundnodenom) {
win[j,1] <- (j*x[j+1]+sum(x[(j+1):(n-j)])+j*x[n-j])/n
win[j,2] <- sd(c(rep(x[j+1],j),x[(j+1):(n-j)],rep(x[n-j],j)))/sqrtn
}
return(win)
}
trimean <- function(x) {
x <-sort(x[!is.na(x)])
n<-length(x)
denom <- 3
nodenom <- n/denom
if (nodenom>40) denom <- n/40
sqrtn = sqrt(n)
roundnodenom = floor(nodenom)
tri <- array(NA,dim=c(roundnodenom,2))
for (j in 1:roundnodenom) {
tri[j,1] <- mean(x,trim=j/n)
tri[j,2] <- sd(x[(j+1):(n-j)]) / sqrt(n-j*2)
}
return(tri)
}
midrange <- function(x) {
return((max(x)+min(x))/2)
}
q1 <- function(data,n,p,i,f) {
np <- n*p;
i <<- floor(np)
f <<- np - i
qvalue <- (1-f)*data[i] + f*data[i+1]
}
q2 <- function(data,n,p,i,f) {
np <- (n+1)*p
i <<- floor(np)
f <<- np - i
qvalue <- (1-f)*data[i] + f*data[i+1]
}
q3 <- function(data,n,p,i,f) {
np <- n*p
i <<- floor(np)
f <<- np - i
if (f==0) {
qvalue <- data[i]
} else {
qvalue <- data[i+1]
}
}
q4 <- function(data,n,p,i,f) {
np <- n*p
i <<- floor(np)
f <<- np - i
if (f==0) {
qvalue <- (data[i]+data[i+1])/2
} else {
qvalue <- data[i+1]
}
}
q5 <- function(data,n,p,i,f) {
np <- (n-1)*p
i <<- floor(np)
f <<- np - i
if (f==0) {
qvalue <- data[i+1]
} else {
qvalue <- data[i+1] + f*(data[i+2]-data[i+1])
}
}
q6 <- function(data,n,p,i,f) {
np <- n*p+0.5
i <<- floor(np)
f <<- np - i
qvalue <- data[i]
}
q7 <- function(data,n,p,i,f) {
np <- (n+1)*p
i <<- floor(np)
f <<- np - i
if (f==0) {
qvalue <- data[i]
} else {
qvalue <- f*data[i] + (1-f)*data[i+1]
}
}
q8 <- function(data,n,p,i,f) {
np <- (n+1)*p
i <<- floor(np)
f <<- np - i
if (f==0) {
qvalue <- data[i]
} else {
if (f == 0.5) {
qvalue <- (data[i]+data[i+1])/2
} else {
if (f < 0.5) {
qvalue <- data[i]
} else {
qvalue <- data[i+1]
}
}
}
}
midmean <- function(x,def) {
x <-sort(x[!is.na(x)])
n<-length(x)
if (def==1) {
qvalue1 <- q1(x,n,0.25,i,f)
qvalue3 <- q1(x,n,0.75,i,f)
}
if (def==2) {
qvalue1 <- q2(x,n,0.25,i,f)
qvalue3 <- q2(x,n,0.75,i,f)
}
if (def==3) {
qvalue1 <- q3(x,n,0.25,i,f)
qvalue3 <- q3(x,n,0.75,i,f)
}
if (def==4) {
qvalue1 <- q4(x,n,0.25,i,f)
qvalue3 <- q4(x,n,0.75,i,f)
}
if (def==5) {
qvalue1 <- q5(x,n,0.25,i,f)
qvalue3 <- q5(x,n,0.75,i,f)
}
if (def==6) {
qvalue1 <- q6(x,n,0.25,i,f)
qvalue3 <- q6(x,n,0.75,i,f)
}
if (def==7) {
qvalue1 <- q7(x,n,0.25,i,f)
qvalue3 <- q7(x,n,0.75,i,f)
}
if (def==8) {
qvalue1 <- q8(x,n,0.25,i,f)
qvalue3 <- q8(x,n,0.75,i,f)
}
midm <- 0
myn <- 0
roundno4 <- round(n/4)
round3no4 <- round(3*n/4)
for (i in 1:n) {
if ((x[i]>=qvalue1) & (x[i]<=qvalue3)){
midm = midm + x[i]
myn = myn + 1
}
}
midm = midm / myn
return(midm)
}
(arm <- mean(x))
sqrtn <- sqrt(length(x))
(armse <- sd(x) / sqrtn)
(armose <- arm / armse)
(geo <- geomean(x))
(har <- harmean(x))
(qua <- quamean(x))
(win <- winmean(x))
(tri <- trimean(x))
(midr <- midrange(x))
midm <- array(NA,dim=8)
for (j in 1:8) midm[j] <- midmean(x,j)
midm
bitmap(file='test1.png')
lb <- win[,1] - 2*win[,2]
ub <- win[,1] + 2*win[,2]
if ((ylimmin == '') | (ylimmax == '')) plot(win[,1],type='b',main=main, xlab='j', pch=19, ylab='Winsorized Mean(j/n)', ylim=c(min(lb),max(ub))) else plot(win[,1],type='l',main=main, xlab='j', pch=19, ylab='Winsorized Mean(j/n)', ylim=c(ylimmin,ylimmax))
lines(ub,lty=3)
lines(lb,lty=3)
grid()
dev.off()
bitmap(file='test2.png')
lb <- tri[,1] - 2*tri[,2]
ub <- tri[,1] + 2*tri[,2]
if ((ylimmin == '') | (ylimmax == '')) plot(tri[,1],type='b',main=main, xlab='j', pch=19, ylab='Trimmed Mean(j/n)', ylim=c(min(lb),max(ub))) else plot(tri[,1],type='l',main=main, xlab='j', pch=19, ylab='Trimmed Mean(j/n)', ylim=c(ylimmin,ylimmax))
lines(ub,lty=3)
lines(lb,lty=3)
grid()
dev.off()
load(file='createtable')
a<-table.start()
a<-table.row.start(a)
a<-table.element(a,'Central Tendency - Ungrouped Data',4,TRUE)
a<-table.row.end(a)
a<-table.row.start(a)
a<-table.element(a,'Measure',header=TRUE)
a<-table.element(a,'Value',header=TRUE)
a<-table.element(a,'S.E.',header=TRUE)
a<-table.element(a,'Value/S.E.',header=TRUE)
a<-table.row.end(a)
a<-table.row.start(a)
a<-table.element(a,hyperlink('arithmetic_mean.htm', 'Arithmetic Mean', 'click to view the definition of the Arithmetic Mean'),header=TRUE)
a<-table.element(a,arm)
a<-table.element(a,hyperlink('arithmetic_mean_standard_error.htm', armse, 'click to view the definition of the Standard Error of the Arithmetic Mean'))
a<-table.element(a,armose)
a<-table.row.end(a)
a<-table.row.start(a)
a<-table.element(a,hyperlink('geometric_mean.htm', 'Geometric Mean', 'click to view the definition of the Geometric Mean'),header=TRUE)
a<-table.element(a,geo)
a<-table.element(a,'')
a<-table.row.end(a)
a<-table.row.start(a)
a<-table.element(a,hyperlink('harmonic_mean.htm', 'Harmonic Mean', 'click to view the definition of the Harmonic Mean'),header=TRUE)
a<-table.element(a,har)
a<-table.element(a,'')
a<-table.row.end(a)
a<-table.row.start(a)
a<-table.element(a,hyperlink('quadratic_mean.htm', 'Quadratic Mean', 'click to view the definition of the Quadratic Mean'),header=TRUE)
a<-table.element(a,qua)
a<-table.element(a,'')
a<-table.row.end(a)
for (j in 1:length(win[,1])) {
a<-table.row.start(a)
mylabel <- paste('Winsorized Mean (',j)
mylabel <- paste(mylabel,'/')
mylabel <- paste(mylabel,length(win[,1]))
mylabel <- paste(mylabel,')')
a<-table.element(a,hyperlink('winsorized_mean.htm', mylabel, 'click to view the definition of the Winsorized Mean'),header=TRUE)
a<-table.element(a,win[j,1])
a<-table.element(a,win[j,2])
a<-table.element(a,win[j,1]/win[j,2])
a<-table.row.end(a)
}
for (j in 1:length(tri[,1])) {
a<-table.row.start(a)
mylabel <- paste('Trimmed Mean (',j)
mylabel <- paste(mylabel,'/')
mylabel <- paste(mylabel,length(tri[,1]))
mylabel <- paste(mylabel,')')
a<-table.element(a,hyperlink('arithmetic_mean.htm', mylabel, 'click to view the definition of the Trimmed Mean'),header=TRUE)
a<-table.element(a,tri[j,1])
a<-table.element(a,tri[j,2])
a<-table.element(a,tri[j,1]/tri[j,2])
a<-table.row.end(a)
}
a<-table.row.start(a)
a<-table.element(a,hyperlink('median_1.htm', 'Median', 'click to view the definition of the Median'),header=TRUE)
a<-table.element(a,median(x))
a<-table.element(a,'')
a<-table.row.end(a)
a<-table.row.start(a)
a<-table.element(a,hyperlink('midrange.htm', 'Midrange', 'click to view the definition of the Midrange'),header=TRUE)
a<-table.element(a,midr)
a<-table.element(a,'')
a<-table.row.end(a)
a<-table.row.start(a)
mymid <- hyperlink('midmean.htm', 'Midmean', 'click to view the definition of the Midmean')
mylabel <- paste(mymid,hyperlink('method_1.htm','Weighted Average at Xnp',''),sep=' - ')
a<-table.element(a,mylabel,header=TRUE)
a<-table.element(a,midm[1])
a<-table.element(a,'')
a<-table.row.end(a)
a<-table.row.start(a)
mymid <- hyperlink('midmean.htm', 'Midmean', 'click to view the definition of the Midmean')
mylabel <- paste(mymid,hyperlink('method_2.htm','Weighted Average at X(n+1)p',''),sep=' - ')
a<-table.element(a,mylabel,header=TRUE)
a<-table.element(a,midm[2])
a<-table.element(a,'')
a<-table.row.end(a)
a<-table.row.start(a)
mymid <- hyperlink('midmean.htm', 'Midmean', 'click to view the definition of the Midmean')
mylabel <- paste(mymid,hyperlink('method_3.htm','Empirical Distribution Function',''),sep=' - ')
a<-table.element(a,mylabel,header=TRUE)
a<-table.element(a,midm[3])
a<-table.element(a,'')
a<-table.row.end(a)
a<-table.row.start(a)
mymid <- hyperlink('midmean.htm', 'Midmean', 'click to view the definition of the Midmean')
mylabel <- paste(mymid,hyperlink('method_4.htm','Empirical Distribution Function - Averaging',''),sep=' - ')
a<-table.element(a,mylabel,header=TRUE)
a<-table.element(a,midm[4])
a<-table.element(a,'')
a<-table.row.end(a)
a<-table.row.start(a)
mymid <- hyperlink('midmean.htm', 'Midmean', 'click to view the definition of the Midmean')
mylabel <- paste(mymid,hyperlink('method_5.htm','Empirical Distribution Function - Interpolation',''),sep=' - ')
a<-table.element(a,mylabel,header=TRUE)
a<-table.element(a,midm[5])
a<-table.element(a,'')
a<-table.row.end(a)
a<-table.row.start(a)
mymid <- hyperlink('midmean.htm', 'Midmean', 'click to view the definition of the Midmean')
mylabel <- paste(mymid,hyperlink('method_6.htm','Closest Observation',''),sep=' - ')
a<-table.element(a,mylabel,header=TRUE)
a<-table.element(a,midm[6])
a<-table.element(a,'')
a<-table.row.end(a)
a<-table.row.start(a)
mymid <- hyperlink('midmean.htm', 'Midmean', 'click to view the definition of the Midmean')
mylabel <- paste(mymid,hyperlink('method_7.htm','True Basic - Statistics Graphics Toolkit',''),sep=' - ')
a<-table.element(a,mylabel,header=TRUE)
a<-table.element(a,midm[7])
a<-table.element(a,'')
a<-table.row.end(a)
a<-table.row.start(a)
mymid <- hyperlink('midmean.htm', 'Midmean', 'click to view the definition of the Midmean')
mylabel <- paste(mymid,hyperlink('method_8.htm','MS Excel (old versions)',''),sep=' - ')
a<-table.element(a,mylabel,header=TRUE)
a<-table.element(a,midm[8])
a<-table.element(a,'')
a<-table.row.end(a)
a<-table.row.start(a)
a<-table.element(a,'Number of observations',header=TRUE)
a<-table.element(a,length(x))
a<-table.element(a,'')
a<-table.row.end(a)
a<-table.end(a)
table.save(a,file='mytable.tab')