Free Statistics

of Irreproducible Research!

Author's title

Author*The author of this computation has been verified*
R Software Modulerwasp_centraltendency.wasp
Title produced by softwareCentral Tendency
Date of computationFri, 05 Dec 2008 08:25:20 -0700
Cite this page as followsStatistical Computations at FreeStatistics.org, Office for Research Development and Education, URL https://freestatistics.org/blog/index.php?v=date/2008/Dec/05/t1228490830qrtbmfud0qd4yn0.htm/, Retrieved Thu, 16 May 2024 13:52:23 +0000
Statistical Computations at FreeStatistics.org, Office for Research Development and Education, URL https://freestatistics.org/blog/index.php?pk=29318, Retrieved Thu, 16 May 2024 13:52:23 +0000
QR Codes:

Original text written by user:
IsPrivate?No (this computation is public)
User-defined keywords
Estimated Impact162
Family? (F = Feedback message, R = changed R code, M = changed R Module, P = changed Parameters, D = changed Data)
-       [Central Tendency] [Investeringsgoederen] [2008-12-05 15:25:20] [5925747fb2a6bb4cfcd8015825ee5e92] [Current]
Feedback Forum

Post a new message
Dataseries X:
119,5
125
145
105,3
116,9
120,1
88,9
78,4
114,6
113,3
117
99,6
99,4
101,9
115,2
108,5
113,8
121
92,2
90,2
101,5
126,6
93,9
89,8
93,4
101,5
110,4
105,9
108,4
113,9
86,1
69,4
101,2
100,5
98
106,6
90,1
96,9
125,9
112
100
123,9
79,8
83,4
113,6
112,9
104
109,9
99
106,3
128,9
111,1
102,9
130
87
87,5
117,6
103,4
110,8
112,6
102,5
112,4
135,6
105,1
127,7
137
91
90,5
122,4
123,3
124,3
120
118,1
119
142,7
123,6
129,6
151,6
110,4
99,2
130,5
136,2
129,7
128
121,6


Summary of computational transaction
Raw Inputview raw input (R code)
Raw Outputview raw output of R engine
Computing time1 seconds
R Server'George Udny Yule' @ 72.249.76.132

\begin{tabular}{lllllllll}
\hline
Summary of computational transaction \tabularnewline
Raw Input & view raw input (R code)  \tabularnewline
Raw Output & view raw output of R engine  \tabularnewline
Computing time & 1 seconds \tabularnewline
R Server & 'George Udny Yule' @ 72.249.76.132 \tabularnewline
\hline
\end{tabular}
%Source: https://freestatistics.org/blog/index.php?pk=29318&T=0

[TABLE]
[ROW][C]Summary of computational transaction[/C][/ROW]
[ROW][C]Raw Input[/C][C]view raw input (R code) [/C][/ROW]
[ROW][C]Raw Output[/C][C]view raw output of R engine [/C][/ROW]
[ROW][C]Computing time[/C][C]1 seconds[/C][/ROW]
[ROW][C]R Server[/C][C]'George Udny Yule' @ 72.249.76.132[/C][/ROW]
[/TABLE]
Source: https://freestatistics.org/blog/index.php?pk=29318&T=0

Globally Unique Identifier (entire table): ba.freestatistics.org/blog/index.php?pk=29318&T=0

As an alternative you can also use a QR Code:  

The GUIDs for individual cells are displayed in the table below:

Summary of computational transaction
Raw Inputview raw input (R code)
Raw Outputview raw output of R engine
Computing time1 seconds
R Server'George Udny Yule' @ 72.249.76.132


Central Tendency - Ungrouped Data
MeasureValueS.E.Value/S.E.
Arithmetic Mean110.2870588235291.7536610670006962.8896090007603
Geometric Mean109.089326026462
Harmonic Mean107.859567066814
Quadratic Mean111.452065138020
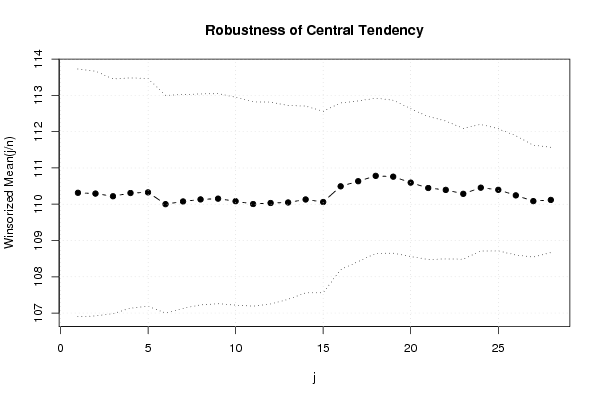
Winsorized Mean ( 1 / 28 )110.3152941176471.7068419787100164.6312286044316
Winsorized Mean ( 2 / 28 )110.2941176470591.6868940787401165.3829538185552
Winsorized Mean ( 3 / 28 )110.221.6177670747432268.130945252112
Winsorized Mean ( 4 / 28 )110.3094117647061.5863092689387769.5384020787462
Winsorized Mean ( 5 / 28 )110.3270588235291.5700063232359470.2717289673933
Winsorized Mean ( 6 / 28 )110.0023529411761.4998347028162773.3429842199431
Winsorized Mean ( 7 / 28 )110.0764705882351.4730032271409274.7292799907113
Winsorized Mean ( 8 / 28 )110.1329411764711.4541685354561375.7360226763022
Winsorized Mean ( 9 / 28 )110.1541176470591.4472097687208976.114824559551
Winsorized Mean ( 10 / 28 )110.0835294117651.4322396782532976.8611085722878
Winsorized Mean ( 11 / 28 )110.0058823529411.4078584497033378.1370331485543
Winsorized Mean ( 12 / 28 )110.0341176470591.3898557579282979.1694512321729
Winsorized Mean ( 13 / 28 )110.0494117647061.3351345923292682.4257062898171
Winsorized Mean ( 14 / 28 )110.1317647058821.2871898601354885.5598448346159
Winsorized Mean ( 15 / 28 )110.0611764705881.2506985097273987.9997662222994
Winsorized Mean ( 16 / 28 )110.4941176470591.1485301201144196.2048062231508
Winsorized Mean ( 17 / 28 )110.6341176470591.1066371612041299.9732536784495
Winsorized Mean ( 18 / 28 )110.7823529411761.06928230134686103.604401570695
Winsorized Mean ( 19 / 28 )110.761.05389659797140105.095699343937
Winsorized Mean ( 20 / 28 )110.5952941176471.01812414133909108.626531507431
Winsorized Mean ( 21 / 28 )110.4470588235290.984678975165245112.165550000694
Winsorized Mean ( 22 / 28 )110.3952941176470.950361726625795116.161342596991
Winsorized Mean ( 23 / 28 )110.2870588235290.90082562229298122.428865358872
Winsorized Mean ( 24 / 28 )110.4564705882350.87187850106133126.687916325242
Winsorized Mean ( 25 / 28 )110.3976470588240.841700254155115131.160287185180
Winsorized Mean ( 26 / 28 )110.2447058823530.822158983791115134.091712254965
Winsorized Mean ( 27 / 28 )110.0858823529410.770236154519369142.924844162418
Winsorized Mean ( 28 / 28 )110.1188235294120.725047074908757151.878170866726
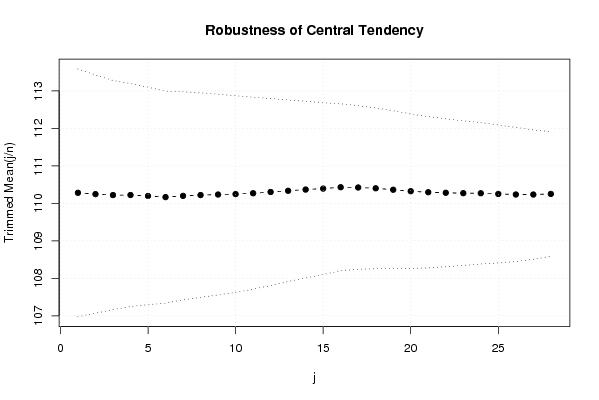
Trimmed Mean ( 1 / 28 )110.2819277108431.6522241615242566.7475577945206
Trimmed Mean ( 2 / 28 )110.2469135802471.5888025291407969.3899408882911
Trimmed Mean ( 3 / 28 )110.2215189873421.5274802603476272.1590464038193
Trimmed Mean ( 4 / 28 )110.2220779220781.4870523713768374.1211809642091
Trimmed Mean ( 5 / 28 )110.1973333333331.4509331863015375.9492817269067
Trimmed Mean ( 6 / 28 )110.1671232876711.4134344739519177.9428585604313
Trimmed Mean ( 7 / 28 )110.21.3878692613207979.4022917512607
Trimmed Mean ( 8 / 28 )110.2217391304351.3638367185653780.8174011082339
Trimmed Mean ( 9 / 28 )110.2358208955221.3392193151254782.3134938769862
Trimmed Mean ( 10 / 28 )110.2476923076921.3110534293744784.0909224884098
Trimmed Mean ( 11 / 28 )110.2698412698411.2801022323018086.1414334631388
Trimmed Mean ( 12 / 28 )110.3032786885251.2474388345619688.4237973297165
Trimmed Mean ( 13 / 28 )110.3355932203391.2111906674490391.0967993608505
Trimmed Mean ( 14 / 28 )110.3684210526321.1776057809302393.7227235462852
Trimmed Mean ( 15 / 28 )110.3945454545451.1455268535779296.3701070033764
Trimmed Mean ( 16 / 28 )110.4301886792451.1126453033912699.2501279092824
Trimmed Mean ( 17 / 28 )110.4235294117651.09121838088745101.192878846085
Trimmed Mean ( 18 / 28 )110.4020408163271.07151781293391103.033322902991
Trimmed Mean ( 19 / 28 )110.3638297872341.05276792798483104.832059235019
Trimmed Mean ( 20 / 28 )110.3244444444441.03087270842001107.020433796851
Trimmed Mean ( 21 / 28 )110.2976744186051.00908107255395109.305067173091
Trimmed Mean ( 22 / 28 )110.2829268292680.986728410746071111.766242492078
Trimmed Mean ( 23 / 28 )110.2717948717950.963629754566528114.433779518772
Trimmed Mean ( 24 / 28 )110.2702702702700.942839816667108116.955466157624
Trimmed Mean ( 25 / 28 )110.2514285714290.919959548147684119.843778776379
Trimmed Mean ( 26 / 28 )110.2363636363640.89453113440127123.233680077717
Trimmed Mean ( 27 / 28 )110.2354838709680.86252378352244127.805732406334
Trimmed Mean ( 28 / 28 )110.2517241379310.830849477598081132.697590972386
Median110.8
Midrange110.5
Midmean - Weighted Average at Xnp110.028571428571
Midmean - Weighted Average at X(n+1)p110.297674418605
Midmean - Empirical Distribution Function110.297674418605
Midmean - Empirical Distribution Function - Averaging110.297674418605
Midmean - Empirical Distribution Function - Interpolation110.297674418605
Midmean - Closest Observation110.05
Midmean - True Basic - Statistics Graphics Toolkit110.297674418605
Midmean - MS Excel (old versions)110.297674418605
Number of observations85

\begin{tabular}{lllllllll}
\hline
Central Tendency - Ungrouped Data \tabularnewline
Measure & Value & S.E. & Value/S.E. \tabularnewline
Arithmetic Mean & 110.287058823529 & 1.75366106700069 & 62.8896090007603 \tabularnewline
Geometric Mean & 109.089326026462 &  &  \tabularnewline
Harmonic Mean & 107.859567066814 &  &  \tabularnewline
Quadratic Mean & 111.452065138020 &  &  \tabularnewline
Winsorized Mean ( 1 / 28 ) & 110.315294117647 & 1.70684197871001 & 64.6312286044316 \tabularnewline
Winsorized Mean ( 2 / 28 ) & 110.294117647059 & 1.68689407874011 & 65.3829538185552 \tabularnewline
Winsorized Mean ( 3 / 28 ) & 110.22 & 1.61776707474322 & 68.130945252112 \tabularnewline
Winsorized Mean ( 4 / 28 ) & 110.309411764706 & 1.58630926893877 & 69.5384020787462 \tabularnewline
Winsorized Mean ( 5 / 28 ) & 110.327058823529 & 1.57000632323594 & 70.2717289673933 \tabularnewline
Winsorized Mean ( 6 / 28 ) & 110.002352941176 & 1.49983470281627 & 73.3429842199431 \tabularnewline
Winsorized Mean ( 7 / 28 ) & 110.076470588235 & 1.47300322714092 & 74.7292799907113 \tabularnewline
Winsorized Mean ( 8 / 28 ) & 110.132941176471 & 1.45416853545613 & 75.7360226763022 \tabularnewline
Winsorized Mean ( 9 / 28 ) & 110.154117647059 & 1.44720976872089 & 76.114824559551 \tabularnewline
Winsorized Mean ( 10 / 28 ) & 110.083529411765 & 1.43223967825329 & 76.8611085722878 \tabularnewline
Winsorized Mean ( 11 / 28 ) & 110.005882352941 & 1.40785844970333 & 78.1370331485543 \tabularnewline
Winsorized Mean ( 12 / 28 ) & 110.034117647059 & 1.38985575792829 & 79.1694512321729 \tabularnewline
Winsorized Mean ( 13 / 28 ) & 110.049411764706 & 1.33513459232926 & 82.4257062898171 \tabularnewline
Winsorized Mean ( 14 / 28 ) & 110.131764705882 & 1.28718986013548 & 85.5598448346159 \tabularnewline
Winsorized Mean ( 15 / 28 ) & 110.061176470588 & 1.25069850972739 & 87.9997662222994 \tabularnewline
Winsorized Mean ( 16 / 28 ) & 110.494117647059 & 1.14853012011441 & 96.2048062231508 \tabularnewline
Winsorized Mean ( 17 / 28 ) & 110.634117647059 & 1.10663716120412 & 99.9732536784495 \tabularnewline
Winsorized Mean ( 18 / 28 ) & 110.782352941176 & 1.06928230134686 & 103.604401570695 \tabularnewline
Winsorized Mean ( 19 / 28 ) & 110.76 & 1.05389659797140 & 105.095699343937 \tabularnewline
Winsorized Mean ( 20 / 28 ) & 110.595294117647 & 1.01812414133909 & 108.626531507431 \tabularnewline
Winsorized Mean ( 21 / 28 ) & 110.447058823529 & 0.984678975165245 & 112.165550000694 \tabularnewline
Winsorized Mean ( 22 / 28 ) & 110.395294117647 & 0.950361726625795 & 116.161342596991 \tabularnewline
Winsorized Mean ( 23 / 28 ) & 110.287058823529 & 0.90082562229298 & 122.428865358872 \tabularnewline
Winsorized Mean ( 24 / 28 ) & 110.456470588235 & 0.87187850106133 & 126.687916325242 \tabularnewline
Winsorized Mean ( 25 / 28 ) & 110.397647058824 & 0.841700254155115 & 131.160287185180 \tabularnewline
Winsorized Mean ( 26 / 28 ) & 110.244705882353 & 0.822158983791115 & 134.091712254965 \tabularnewline
Winsorized Mean ( 27 / 28 ) & 110.085882352941 & 0.770236154519369 & 142.924844162418 \tabularnewline
Winsorized Mean ( 28 / 28 ) & 110.118823529412 & 0.725047074908757 & 151.878170866726 \tabularnewline
Trimmed Mean ( 1 / 28 ) & 110.281927710843 & 1.65222416152425 & 66.7475577945206 \tabularnewline
Trimmed Mean ( 2 / 28 ) & 110.246913580247 & 1.58880252914079 & 69.3899408882911 \tabularnewline
Trimmed Mean ( 3 / 28 ) & 110.221518987342 & 1.52748026034762 & 72.1590464038193 \tabularnewline
Trimmed Mean ( 4 / 28 ) & 110.222077922078 & 1.48705237137683 & 74.1211809642091 \tabularnewline
Trimmed Mean ( 5 / 28 ) & 110.197333333333 & 1.45093318630153 & 75.9492817269067 \tabularnewline
Trimmed Mean ( 6 / 28 ) & 110.167123287671 & 1.41343447395191 & 77.9428585604313 \tabularnewline
Trimmed Mean ( 7 / 28 ) & 110.2 & 1.38786926132079 & 79.4022917512607 \tabularnewline
Trimmed Mean ( 8 / 28 ) & 110.221739130435 & 1.36383671856537 & 80.8174011082339 \tabularnewline
Trimmed Mean ( 9 / 28 ) & 110.235820895522 & 1.33921931512547 & 82.3134938769862 \tabularnewline
Trimmed Mean ( 10 / 28 ) & 110.247692307692 & 1.31105342937447 & 84.0909224884098 \tabularnewline
Trimmed Mean ( 11 / 28 ) & 110.269841269841 & 1.28010223230180 & 86.1414334631388 \tabularnewline
Trimmed Mean ( 12 / 28 ) & 110.303278688525 & 1.24743883456196 & 88.4237973297165 \tabularnewline
Trimmed Mean ( 13 / 28 ) & 110.335593220339 & 1.21119066744903 & 91.0967993608505 \tabularnewline
Trimmed Mean ( 14 / 28 ) & 110.368421052632 & 1.17760578093023 & 93.7227235462852 \tabularnewline
Trimmed Mean ( 15 / 28 ) & 110.394545454545 & 1.14552685357792 & 96.3701070033764 \tabularnewline
Trimmed Mean ( 16 / 28 ) & 110.430188679245 & 1.11264530339126 & 99.2501279092824 \tabularnewline
Trimmed Mean ( 17 / 28 ) & 110.423529411765 & 1.09121838088745 & 101.192878846085 \tabularnewline
Trimmed Mean ( 18 / 28 ) & 110.402040816327 & 1.07151781293391 & 103.033322902991 \tabularnewline
Trimmed Mean ( 19 / 28 ) & 110.363829787234 & 1.05276792798483 & 104.832059235019 \tabularnewline
Trimmed Mean ( 20 / 28 ) & 110.324444444444 & 1.03087270842001 & 107.020433796851 \tabularnewline
Trimmed Mean ( 21 / 28 ) & 110.297674418605 & 1.00908107255395 & 109.305067173091 \tabularnewline
Trimmed Mean ( 22 / 28 ) & 110.282926829268 & 0.986728410746071 & 111.766242492078 \tabularnewline
Trimmed Mean ( 23 / 28 ) & 110.271794871795 & 0.963629754566528 & 114.433779518772 \tabularnewline
Trimmed Mean ( 24 / 28 ) & 110.270270270270 & 0.942839816667108 & 116.955466157624 \tabularnewline
Trimmed Mean ( 25 / 28 ) & 110.251428571429 & 0.919959548147684 & 119.843778776379 \tabularnewline
Trimmed Mean ( 26 / 28 ) & 110.236363636364 & 0.89453113440127 & 123.233680077717 \tabularnewline
Trimmed Mean ( 27 / 28 ) & 110.235483870968 & 0.86252378352244 & 127.805732406334 \tabularnewline
Trimmed Mean ( 28 / 28 ) & 110.251724137931 & 0.830849477598081 & 132.697590972386 \tabularnewline
Median & 110.8 &  &  \tabularnewline
Midrange & 110.5 &  &  \tabularnewline
Midmean - Weighted Average at Xnp & 110.028571428571 &  &  \tabularnewline
Midmean - Weighted Average at X(n+1)p & 110.297674418605 &  &  \tabularnewline
Midmean - Empirical Distribution Function & 110.297674418605 &  &  \tabularnewline
Midmean - Empirical Distribution Function - Averaging & 110.297674418605 &  &  \tabularnewline
Midmean - Empirical Distribution Function - Interpolation & 110.297674418605 &  &  \tabularnewline
Midmean - Closest Observation & 110.05 &  &  \tabularnewline
Midmean - True Basic - Statistics Graphics Toolkit & 110.297674418605 &  &  \tabularnewline
Midmean - MS Excel (old versions) & 110.297674418605 &  &  \tabularnewline
Number of observations & 85 &  &  \tabularnewline
\hline
\end{tabular}
%Source: https://freestatistics.org/blog/index.php?pk=29318&T=1

[TABLE]
[ROW][C]Central Tendency - Ungrouped Data[/C][/ROW]
[ROW][C]Measure[/C][C]Value[/C][C]S.E.[/C][C]Value/S.E.[/C][/ROW]
[ROW][C]Arithmetic Mean[/C][C]110.287058823529[/C][C]1.75366106700069[/C][C]62.8896090007603[/C][/ROW]
[ROW][C]Geometric Mean[/C][C]109.089326026462[/C][C][/C][C][/C][/ROW]
[ROW][C]Harmonic Mean[/C][C]107.859567066814[/C][C][/C][C][/C][/ROW]
[ROW][C]Quadratic Mean[/C][C]111.452065138020[/C][C][/C][C][/C][/ROW]
[ROW][C]Winsorized Mean ( 1 / 28 )[/C][C]110.315294117647[/C][C]1.70684197871001[/C][C]64.6312286044316[/C][/ROW]
[ROW][C]Winsorized Mean ( 2 / 28 )[/C][C]110.294117647059[/C][C]1.68689407874011[/C][C]65.3829538185552[/C][/ROW]
[ROW][C]Winsorized Mean ( 3 / 28 )[/C][C]110.22[/C][C]1.61776707474322[/C][C]68.130945252112[/C][/ROW]
[ROW][C]Winsorized Mean ( 4 / 28 )[/C][C]110.309411764706[/C][C]1.58630926893877[/C][C]69.5384020787462[/C][/ROW]
[ROW][C]Winsorized Mean ( 5 / 28 )[/C][C]110.327058823529[/C][C]1.57000632323594[/C][C]70.2717289673933[/C][/ROW]
[ROW][C]Winsorized Mean ( 6 / 28 )[/C][C]110.002352941176[/C][C]1.49983470281627[/C][C]73.3429842199431[/C][/ROW]
[ROW][C]Winsorized Mean ( 7 / 28 )[/C][C]110.076470588235[/C][C]1.47300322714092[/C][C]74.7292799907113[/C][/ROW]
[ROW][C]Winsorized Mean ( 8 / 28 )[/C][C]110.132941176471[/C][C]1.45416853545613[/C][C]75.7360226763022[/C][/ROW]
[ROW][C]Winsorized Mean ( 9 / 28 )[/C][C]110.154117647059[/C][C]1.44720976872089[/C][C]76.114824559551[/C][/ROW]
[ROW][C]Winsorized Mean ( 10 / 28 )[/C][C]110.083529411765[/C][C]1.43223967825329[/C][C]76.8611085722878[/C][/ROW]
[ROW][C]Winsorized Mean ( 11 / 28 )[/C][C]110.005882352941[/C][C]1.40785844970333[/C][C]78.1370331485543[/C][/ROW]
[ROW][C]Winsorized Mean ( 12 / 28 )[/C][C]110.034117647059[/C][C]1.38985575792829[/C][C]79.1694512321729[/C][/ROW]
[ROW][C]Winsorized Mean ( 13 / 28 )[/C][C]110.049411764706[/C][C]1.33513459232926[/C][C]82.4257062898171[/C][/ROW]
[ROW][C]Winsorized Mean ( 14 / 28 )[/C][C]110.131764705882[/C][C]1.28718986013548[/C][C]85.5598448346159[/C][/ROW]
[ROW][C]Winsorized Mean ( 15 / 28 )[/C][C]110.061176470588[/C][C]1.25069850972739[/C][C]87.9997662222994[/C][/ROW]
[ROW][C]Winsorized Mean ( 16 / 28 )[/C][C]110.494117647059[/C][C]1.14853012011441[/C][C]96.2048062231508[/C][/ROW]
[ROW][C]Winsorized Mean ( 17 / 28 )[/C][C]110.634117647059[/C][C]1.10663716120412[/C][C]99.9732536784495[/C][/ROW]
[ROW][C]Winsorized Mean ( 18 / 28 )[/C][C]110.782352941176[/C][C]1.06928230134686[/C][C]103.604401570695[/C][/ROW]
[ROW][C]Winsorized Mean ( 19 / 28 )[/C][C]110.76[/C][C]1.05389659797140[/C][C]105.095699343937[/C][/ROW]
[ROW][C]Winsorized Mean ( 20 / 28 )[/C][C]110.595294117647[/C][C]1.01812414133909[/C][C]108.626531507431[/C][/ROW]
[ROW][C]Winsorized Mean ( 21 / 28 )[/C][C]110.447058823529[/C][C]0.984678975165245[/C][C]112.165550000694[/C][/ROW]
[ROW][C]Winsorized Mean ( 22 / 28 )[/C][C]110.395294117647[/C][C]0.950361726625795[/C][C]116.161342596991[/C][/ROW]
[ROW][C]Winsorized Mean ( 23 / 28 )[/C][C]110.287058823529[/C][C]0.90082562229298[/C][C]122.428865358872[/C][/ROW]
[ROW][C]Winsorized Mean ( 24 / 28 )[/C][C]110.456470588235[/C][C]0.87187850106133[/C][C]126.687916325242[/C][/ROW]
[ROW][C]Winsorized Mean ( 25 / 28 )[/C][C]110.397647058824[/C][C]0.841700254155115[/C][C]131.160287185180[/C][/ROW]
[ROW][C]Winsorized Mean ( 26 / 28 )[/C][C]110.244705882353[/C][C]0.822158983791115[/C][C]134.091712254965[/C][/ROW]
[ROW][C]Winsorized Mean ( 27 / 28 )[/C][C]110.085882352941[/C][C]0.770236154519369[/C][C]142.924844162418[/C][/ROW]
[ROW][C]Winsorized Mean ( 28 / 28 )[/C][C]110.118823529412[/C][C]0.725047074908757[/C][C]151.878170866726[/C][/ROW]
[ROW][C]Trimmed Mean ( 1 / 28 )[/C][C]110.281927710843[/C][C]1.65222416152425[/C][C]66.7475577945206[/C][/ROW]
[ROW][C]Trimmed Mean ( 2 / 28 )[/C][C]110.246913580247[/C][C]1.58880252914079[/C][C]69.3899408882911[/C][/ROW]
[ROW][C]Trimmed Mean ( 3 / 28 )[/C][C]110.221518987342[/C][C]1.52748026034762[/C][C]72.1590464038193[/C][/ROW]
[ROW][C]Trimmed Mean ( 4 / 28 )[/C][C]110.222077922078[/C][C]1.48705237137683[/C][C]74.1211809642091[/C][/ROW]
[ROW][C]Trimmed Mean ( 5 / 28 )[/C][C]110.197333333333[/C][C]1.45093318630153[/C][C]75.9492817269067[/C][/ROW]
[ROW][C]Trimmed Mean ( 6 / 28 )[/C][C]110.167123287671[/C][C]1.41343447395191[/C][C]77.9428585604313[/C][/ROW]
[ROW][C]Trimmed Mean ( 7 / 28 )[/C][C]110.2[/C][C]1.38786926132079[/C][C]79.4022917512607[/C][/ROW]
[ROW][C]Trimmed Mean ( 8 / 28 )[/C][C]110.221739130435[/C][C]1.36383671856537[/C][C]80.8174011082339[/C][/ROW]
[ROW][C]Trimmed Mean ( 9 / 28 )[/C][C]110.235820895522[/C][C]1.33921931512547[/C][C]82.3134938769862[/C][/ROW]
[ROW][C]Trimmed Mean ( 10 / 28 )[/C][C]110.247692307692[/C][C]1.31105342937447[/C][C]84.0909224884098[/C][/ROW]
[ROW][C]Trimmed Mean ( 11 / 28 )[/C][C]110.269841269841[/C][C]1.28010223230180[/C][C]86.1414334631388[/C][/ROW]
[ROW][C]Trimmed Mean ( 12 / 28 )[/C][C]110.303278688525[/C][C]1.24743883456196[/C][C]88.4237973297165[/C][/ROW]
[ROW][C]Trimmed Mean ( 13 / 28 )[/C][C]110.335593220339[/C][C]1.21119066744903[/C][C]91.0967993608505[/C][/ROW]
[ROW][C]Trimmed Mean ( 14 / 28 )[/C][C]110.368421052632[/C][C]1.17760578093023[/C][C]93.7227235462852[/C][/ROW]
[ROW][C]Trimmed Mean ( 15 / 28 )[/C][C]110.394545454545[/C][C]1.14552685357792[/C][C]96.3701070033764[/C][/ROW]
[ROW][C]Trimmed Mean ( 16 / 28 )[/C][C]110.430188679245[/C][C]1.11264530339126[/C][C]99.2501279092824[/C][/ROW]
[ROW][C]Trimmed Mean ( 17 / 28 )[/C][C]110.423529411765[/C][C]1.09121838088745[/C][C]101.192878846085[/C][/ROW]
[ROW][C]Trimmed Mean ( 18 / 28 )[/C][C]110.402040816327[/C][C]1.07151781293391[/C][C]103.033322902991[/C][/ROW]
[ROW][C]Trimmed Mean ( 19 / 28 )[/C][C]110.363829787234[/C][C]1.05276792798483[/C][C]104.832059235019[/C][/ROW]
[ROW][C]Trimmed Mean ( 20 / 28 )[/C][C]110.324444444444[/C][C]1.03087270842001[/C][C]107.020433796851[/C][/ROW]
[ROW][C]Trimmed Mean ( 21 / 28 )[/C][C]110.297674418605[/C][C]1.00908107255395[/C][C]109.305067173091[/C][/ROW]
[ROW][C]Trimmed Mean ( 22 / 28 )[/C][C]110.282926829268[/C][C]0.986728410746071[/C][C]111.766242492078[/C][/ROW]
[ROW][C]Trimmed Mean ( 23 / 28 )[/C][C]110.271794871795[/C][C]0.963629754566528[/C][C]114.433779518772[/C][/ROW]
[ROW][C]Trimmed Mean ( 24 / 28 )[/C][C]110.270270270270[/C][C]0.942839816667108[/C][C]116.955466157624[/C][/ROW]
[ROW][C]Trimmed Mean ( 25 / 28 )[/C][C]110.251428571429[/C][C]0.919959548147684[/C][C]119.843778776379[/C][/ROW]
[ROW][C]Trimmed Mean ( 26 / 28 )[/C][C]110.236363636364[/C][C]0.89453113440127[/C][C]123.233680077717[/C][/ROW]
[ROW][C]Trimmed Mean ( 27 / 28 )[/C][C]110.235483870968[/C][C]0.86252378352244[/C][C]127.805732406334[/C][/ROW]
[ROW][C]Trimmed Mean ( 28 / 28 )[/C][C]110.251724137931[/C][C]0.830849477598081[/C][C]132.697590972386[/C][/ROW]
[ROW][C]Median[/C][C]110.8[/C][C][/C][C][/C][/ROW]
[ROW][C]Midrange[/C][C]110.5[/C][C][/C][C][/C][/ROW]
[ROW][C]Midmean - Weighted Average at Xnp[/C][C]110.028571428571[/C][C][/C][C][/C][/ROW]
[ROW][C]Midmean - Weighted Average at X(n+1)p[/C][C]110.297674418605[/C][C][/C][C][/C][/ROW]
[ROW][C]Midmean - Empirical Distribution Function[/C][C]110.297674418605[/C][C][/C][C][/C][/ROW]
[ROW][C]Midmean - Empirical Distribution Function - Averaging[/C][C]110.297674418605[/C][C][/C][C][/C][/ROW]
[ROW][C]Midmean - Empirical Distribution Function - Interpolation[/C][C]110.297674418605[/C][C][/C][C][/C][/ROW]
[ROW][C]Midmean - Closest Observation[/C][C]110.05[/C][C][/C][C][/C][/ROW]
[ROW][C]Midmean - True Basic - Statistics Graphics Toolkit[/C][C]110.297674418605[/C][C][/C][C][/C][/ROW]
[ROW][C]Midmean - MS Excel (old versions)[/C][C]110.297674418605[/C][C][/C][C][/C][/ROW]
[ROW][C]Number of observations[/C][C]85[/C][C][/C][C][/C][/ROW]
[/TABLE]
Source: https://freestatistics.org/blog/index.php?pk=29318&T=1

Globally Unique Identifier (entire table): ba.freestatistics.org/blog/index.php?pk=29318&T=1

As an alternative you can also use a QR Code:  

The GUIDs for individual cells are displayed in the table below:

Central Tendency - Ungrouped Data
MeasureValueS.E.Value/S.E.
Arithmetic Mean110.2870588235291.7536610670006962.8896090007603
Geometric Mean109.089326026462
Harmonic Mean107.859567066814
Quadratic Mean111.452065138020
Winsorized Mean ( 1 / 28 )110.3152941176471.7068419787100164.6312286044316
Winsorized Mean ( 2 / 28 )110.2941176470591.6868940787401165.3829538185552
Winsorized Mean ( 3 / 28 )110.221.6177670747432268.130945252112
Winsorized Mean ( 4 / 28 )110.3094117647061.5863092689387769.5384020787462
Winsorized Mean ( 5 / 28 )110.3270588235291.5700063232359470.2717289673933
Winsorized Mean ( 6 / 28 )110.0023529411761.4998347028162773.3429842199431
Winsorized Mean ( 7 / 28 )110.0764705882351.4730032271409274.7292799907113
Winsorized Mean ( 8 / 28 )110.1329411764711.4541685354561375.7360226763022
Winsorized Mean ( 9 / 28 )110.1541176470591.4472097687208976.114824559551
Winsorized Mean ( 10 / 28 )110.0835294117651.4322396782532976.8611085722878
Winsorized Mean ( 11 / 28 )110.0058823529411.4078584497033378.1370331485543
Winsorized Mean ( 12 / 28 )110.0341176470591.3898557579282979.1694512321729
Winsorized Mean ( 13 / 28 )110.0494117647061.3351345923292682.4257062898171
Winsorized Mean ( 14 / 28 )110.1317647058821.2871898601354885.5598448346159
Winsorized Mean ( 15 / 28 )110.0611764705881.2506985097273987.9997662222994
Winsorized Mean ( 16 / 28 )110.4941176470591.1485301201144196.2048062231508
Winsorized Mean ( 17 / 28 )110.6341176470591.1066371612041299.9732536784495
Winsorized Mean ( 18 / 28 )110.7823529411761.06928230134686103.604401570695
Winsorized Mean ( 19 / 28 )110.761.05389659797140105.095699343937
Winsorized Mean ( 20 / 28 )110.5952941176471.01812414133909108.626531507431
Winsorized Mean ( 21 / 28 )110.4470588235290.984678975165245112.165550000694
Winsorized Mean ( 22 / 28 )110.3952941176470.950361726625795116.161342596991
Winsorized Mean ( 23 / 28 )110.2870588235290.90082562229298122.428865358872
Winsorized Mean ( 24 / 28 )110.4564705882350.87187850106133126.687916325242
Winsorized Mean ( 25 / 28 )110.3976470588240.841700254155115131.160287185180
Winsorized Mean ( 26 / 28 )110.2447058823530.822158983791115134.091712254965
Winsorized Mean ( 27 / 28 )110.0858823529410.770236154519369142.924844162418
Winsorized Mean ( 28 / 28 )110.1188235294120.725047074908757151.878170866726
Trimmed Mean ( 1 / 28 )110.2819277108431.6522241615242566.7475577945206
Trimmed Mean ( 2 / 28 )110.2469135802471.5888025291407969.3899408882911
Trimmed Mean ( 3 / 28 )110.2215189873421.5274802603476272.1590464038193
Trimmed Mean ( 4 / 28 )110.2220779220781.4870523713768374.1211809642091
Trimmed Mean ( 5 / 28 )110.1973333333331.4509331863015375.9492817269067
Trimmed Mean ( 6 / 28 )110.1671232876711.4134344739519177.9428585604313
Trimmed Mean ( 7 / 28 )110.21.3878692613207979.4022917512607
Trimmed Mean ( 8 / 28 )110.2217391304351.3638367185653780.8174011082339
Trimmed Mean ( 9 / 28 )110.2358208955221.3392193151254782.3134938769862
Trimmed Mean ( 10 / 28 )110.2476923076921.3110534293744784.0909224884098
Trimmed Mean ( 11 / 28 )110.2698412698411.2801022323018086.1414334631388
Trimmed Mean ( 12 / 28 )110.3032786885251.2474388345619688.4237973297165
Trimmed Mean ( 13 / 28 )110.3355932203391.2111906674490391.0967993608505
Trimmed Mean ( 14 / 28 )110.3684210526321.1776057809302393.7227235462852
Trimmed Mean ( 15 / 28 )110.3945454545451.1455268535779296.3701070033764
Trimmed Mean ( 16 / 28 )110.4301886792451.1126453033912699.2501279092824
Trimmed Mean ( 17 / 28 )110.4235294117651.09121838088745101.192878846085
Trimmed Mean ( 18 / 28 )110.4020408163271.07151781293391103.033322902991
Trimmed Mean ( 19 / 28 )110.3638297872341.05276792798483104.832059235019
Trimmed Mean ( 20 / 28 )110.3244444444441.03087270842001107.020433796851
Trimmed Mean ( 21 / 28 )110.2976744186051.00908107255395109.305067173091
Trimmed Mean ( 22 / 28 )110.2829268292680.986728410746071111.766242492078
Trimmed Mean ( 23 / 28 )110.2717948717950.963629754566528114.433779518772
Trimmed Mean ( 24 / 28 )110.2702702702700.942839816667108116.955466157624
Trimmed Mean ( 25 / 28 )110.2514285714290.919959548147684119.843778776379
Trimmed Mean ( 26 / 28 )110.2363636363640.89453113440127123.233680077717
Trimmed Mean ( 27 / 28 )110.2354838709680.86252378352244127.805732406334
Trimmed Mean ( 28 / 28 )110.2517241379310.830849477598081132.697590972386
Median110.8
Midrange110.5
Midmean - Weighted Average at Xnp110.028571428571
Midmean - Weighted Average at X(n+1)p110.297674418605
Midmean - Empirical Distribution Function110.297674418605
Midmean - Empirical Distribution Function - Averaging110.297674418605
Midmean - Empirical Distribution Function - Interpolation110.297674418605
Midmean - Closest Observation110.05
Midmean - True Basic - Statistics Graphics Toolkit110.297674418605
Midmean - MS Excel (old versions)110.297674418605
Number of observations85


Parameters (Session):
Parameters (R input):
R code (references can be found in the software module):
geomean <- function(x) {
return(exp(mean(log(x))))
}
harmean <- function(x) {
return(1/mean(1/x))
}
quamean <- function(x) {
return(sqrt(mean(x*x)))
}
winmean <- function(x) {
x <-sort(x[!is.na(x)])
n<-length(x)
denom <- 3
nodenom <- n/denom
if (nodenom>40) denom <- n/40
sqrtn = sqrt(n)
roundnodenom = floor(nodenom)
win <- array(NA,dim=c(roundnodenom,2))
for (j in 1:roundnodenom) {
win[j,1] <- (j*x[j+1]+sum(x[(j+1):(n-j)])+j*x[n-j])/n
win[j,2] <- sd(c(rep(x[j+1],j),x[(j+1):(n-j)],rep(x[n-j],j)))/sqrtn
}
return(win)
}
trimean <- function(x) {
x <-sort(x[!is.na(x)])
n<-length(x)
denom <- 3
nodenom <- n/denom
if (nodenom>40) denom <- n/40
sqrtn = sqrt(n)
roundnodenom = floor(nodenom)
tri <- array(NA,dim=c(roundnodenom,2))
for (j in 1:roundnodenom) {
tri[j,1] <- mean(x,trim=j/n)
tri[j,2] <- sd(x[(j+1):(n-j)]) / sqrt(n-j*2)
}
return(tri)
}
midrange <- function(x) {
return((max(x)+min(x))/2)
}
q1 <- function(data,n,p,i,f) {
np <- n*p;
i <<- floor(np)
f <<- np - i
qvalue <- (1-f)*data[i] + f*data[i+1]
}
q2 <- function(data,n,p,i,f) {
np <- (n+1)*p
i <<- floor(np)
f <<- np - i
qvalue <- (1-f)*data[i] + f*data[i+1]
}
q3 <- function(data,n,p,i,f) {
np <- n*p
i <<- floor(np)
f <<- np - i
if (f==0) {
qvalue <- data[i]
} else {
qvalue <- data[i+1]
}
}
q4 <- function(data,n,p,i,f) {
np <- n*p
i <<- floor(np)
f <<- np - i
if (f==0) {
qvalue <- (data[i]+data[i+1])/2
} else {
qvalue <- data[i+1]
}
}
q5 <- function(data,n,p,i,f) {
np <- (n-1)*p
i <<- floor(np)
f <<- np - i
if (f==0) {
qvalue <- data[i+1]
} else {
qvalue <- data[i+1] + f*(data[i+2]-data[i+1])
}
}
q6 <- function(data,n,p,i,f) {
np <- n*p+0.5
i <<- floor(np)
f <<- np - i
qvalue <- data[i]
}
q7 <- function(data,n,p,i,f) {
np <- (n+1)*p
i <<- floor(np)
f <<- np - i
if (f==0) {
qvalue <- data[i]
} else {
qvalue <- f*data[i] + (1-f)*data[i+1]
}
}
q8 <- function(data,n,p,i,f) {
np <- (n+1)*p
i <<- floor(np)
f <<- np - i
if (f==0) {
qvalue <- data[i]
} else {
if (f == 0.5) {
qvalue <- (data[i]+data[i+1])/2
} else {
if (f < 0.5) {
qvalue <- data[i]
} else {
qvalue <- data[i+1]
}
}
}
}
midmean <- function(x,def) {
x <-sort(x[!is.na(x)])
n<-length(x)
if (def==1) {
qvalue1 <- q1(x,n,0.25,i,f)
qvalue3 <- q1(x,n,0.75,i,f)
}
if (def==2) {
qvalue1 <- q2(x,n,0.25,i,f)
qvalue3 <- q2(x,n,0.75,i,f)
}
if (def==3) {
qvalue1 <- q3(x,n,0.25,i,f)
qvalue3 <- q3(x,n,0.75,i,f)
}
if (def==4) {
qvalue1 <- q4(x,n,0.25,i,f)
qvalue3 <- q4(x,n,0.75,i,f)
}
if (def==5) {
qvalue1 <- q5(x,n,0.25,i,f)
qvalue3 <- q5(x,n,0.75,i,f)
}
if (def==6) {
qvalue1 <- q6(x,n,0.25,i,f)
qvalue3 <- q6(x,n,0.75,i,f)
}
if (def==7) {
qvalue1 <- q7(x,n,0.25,i,f)
qvalue3 <- q7(x,n,0.75,i,f)
}
if (def==8) {
qvalue1 <- q8(x,n,0.25,i,f)
qvalue3 <- q8(x,n,0.75,i,f)
}
midm <- 0
myn <- 0
roundno4 <- round(n/4)
round3no4 <- round(3*n/4)
for (i in 1:n) {
if ((x[i]>=qvalue1) & (x[i]<=qvalue3)){
midm = midm + x[i]
myn = myn + 1
}
}
midm = midm / myn
return(midm)
}
(arm <- mean(x))
sqrtn <- sqrt(length(x))
(armse <- sd(x) / sqrtn)
(armose <- arm / armse)
(geo <- geomean(x))
(har <- harmean(x))
(qua <- quamean(x))
(win <- winmean(x))
(tri <- trimean(x))
(midr <- midrange(x))
midm <- array(NA,dim=8)
for (j in 1:8) midm[j] <- midmean(x,j)
midm
bitmap(file='test1.png')
lb <- win[,1] - 2*win[,2]
ub <- win[,1] + 2*win[,2]
if ((ylimmin == '') | (ylimmax == '')) plot(win[,1],type='b',main=main, xlab='j', pch=19, ylab='Winsorized Mean(j/n)', ylim=c(min(lb),max(ub))) else plot(win[,1],type='l',main=main, xlab='j', pch=19, ylab='Winsorized Mean(j/n)', ylim=c(ylimmin,ylimmax))
lines(ub,lty=3)
lines(lb,lty=3)
grid()
dev.off()
bitmap(file='test2.png')
lb <- tri[,1] - 2*tri[,2]
ub <- tri[,1] + 2*tri[,2]
if ((ylimmin == '') | (ylimmax == '')) plot(tri[,1],type='b',main=main, xlab='j', pch=19, ylab='Trimmed Mean(j/n)', ylim=c(min(lb),max(ub))) else plot(tri[,1],type='l',main=main, xlab='j', pch=19, ylab='Trimmed Mean(j/n)', ylim=c(ylimmin,ylimmax))
lines(ub,lty=3)
lines(lb,lty=3)
grid()
dev.off()
load(file='createtable')
a<-table.start()
a<-table.row.start(a)
a<-table.element(a,'Central Tendency - Ungrouped Data',4,TRUE)
a<-table.row.end(a)
a<-table.row.start(a)
a<-table.element(a,'Measure',header=TRUE)
a<-table.element(a,'Value',header=TRUE)
a<-table.element(a,'S.E.',header=TRUE)
a<-table.element(a,'Value/S.E.',header=TRUE)
a<-table.row.end(a)
a<-table.row.start(a)
a<-table.element(a,hyperlink('arithmetic_mean.htm', 'Arithmetic Mean', 'click to view the definition of the Arithmetic Mean'),header=TRUE)
a<-table.element(a,arm)
a<-table.element(a,hyperlink('arithmetic_mean_standard_error.htm', armse, 'click to view the definition of the Standard Error of the Arithmetic Mean'))
a<-table.element(a,armose)
a<-table.row.end(a)
a<-table.row.start(a)
a<-table.element(a,hyperlink('geometric_mean.htm', 'Geometric Mean', 'click to view the definition of the Geometric Mean'),header=TRUE)
a<-table.element(a,geo)
a<-table.element(a,'')
a<-table.row.end(a)
a<-table.row.start(a)
a<-table.element(a,hyperlink('harmonic_mean.htm', 'Harmonic Mean', 'click to view the definition of the Harmonic Mean'),header=TRUE)
a<-table.element(a,har)
a<-table.element(a,'')
a<-table.row.end(a)
a<-table.row.start(a)
a<-table.element(a,hyperlink('quadratic_mean.htm', 'Quadratic Mean', 'click to view the definition of the Quadratic Mean'),header=TRUE)
a<-table.element(a,qua)
a<-table.element(a,'')
a<-table.row.end(a)
for (j in 1:length(win[,1])) {
a<-table.row.start(a)
mylabel <- paste('Winsorized Mean (',j)
mylabel <- paste(mylabel,'/')
mylabel <- paste(mylabel,length(win[,1]))
mylabel <- paste(mylabel,')')
a<-table.element(a,hyperlink('winsorized_mean.htm', mylabel, 'click to view the definition of the Winsorized Mean'),header=TRUE)
a<-table.element(a,win[j,1])
a<-table.element(a,win[j,2])
a<-table.element(a,win[j,1]/win[j,2])
a<-table.row.end(a)
}
for (j in 1:length(tri[,1])) {
a<-table.row.start(a)
mylabel <- paste('Trimmed Mean (',j)
mylabel <- paste(mylabel,'/')
mylabel <- paste(mylabel,length(tri[,1]))
mylabel <- paste(mylabel,')')
a<-table.element(a,hyperlink('arithmetic_mean.htm', mylabel, 'click to view the definition of the Trimmed Mean'),header=TRUE)
a<-table.element(a,tri[j,1])
a<-table.element(a,tri[j,2])
a<-table.element(a,tri[j,1]/tri[j,2])
a<-table.row.end(a)
}
a<-table.row.start(a)
a<-table.element(a,hyperlink('median_1.htm', 'Median', 'click to view the definition of the Median'),header=TRUE)
a<-table.element(a,median(x))
a<-table.element(a,'')
a<-table.row.end(a)
a<-table.row.start(a)
a<-table.element(a,hyperlink('midrange.htm', 'Midrange', 'click to view the definition of the Midrange'),header=TRUE)
a<-table.element(a,midr)
a<-table.element(a,'')
a<-table.row.end(a)
a<-table.row.start(a)
mymid <- hyperlink('midmean.htm', 'Midmean', 'click to view the definition of the Midmean')
mylabel <- paste(mymid,hyperlink('method_1.htm','Weighted Average at Xnp',''),sep=' - ')
a<-table.element(a,mylabel,header=TRUE)
a<-table.element(a,midm[1])
a<-table.element(a,'')
a<-table.row.end(a)
a<-table.row.start(a)
mymid <- hyperlink('midmean.htm', 'Midmean', 'click to view the definition of the Midmean')
mylabel <- paste(mymid,hyperlink('method_2.htm','Weighted Average at X(n+1)p',''),sep=' - ')
a<-table.element(a,mylabel,header=TRUE)
a<-table.element(a,midm[2])
a<-table.element(a,'')
a<-table.row.end(a)
a<-table.row.start(a)
mymid <- hyperlink('midmean.htm', 'Midmean', 'click to view the definition of the Midmean')
mylabel <- paste(mymid,hyperlink('method_3.htm','Empirical Distribution Function',''),sep=' - ')
a<-table.element(a,mylabel,header=TRUE)
a<-table.element(a,midm[3])
a<-table.element(a,'')
a<-table.row.end(a)
a<-table.row.start(a)
mymid <- hyperlink('midmean.htm', 'Midmean', 'click to view the definition of the Midmean')
mylabel <- paste(mymid,hyperlink('method_4.htm','Empirical Distribution Function - Averaging',''),sep=' - ')
a<-table.element(a,mylabel,header=TRUE)
a<-table.element(a,midm[4])
a<-table.element(a,'')
a<-table.row.end(a)
a<-table.row.start(a)
mymid <- hyperlink('midmean.htm', 'Midmean', 'click to view the definition of the Midmean')
mylabel <- paste(mymid,hyperlink('method_5.htm','Empirical Distribution Function - Interpolation',''),sep=' - ')
a<-table.element(a,mylabel,header=TRUE)
a<-table.element(a,midm[5])
a<-table.element(a,'')
a<-table.row.end(a)
a<-table.row.start(a)
mymid <- hyperlink('midmean.htm', 'Midmean', 'click to view the definition of the Midmean')
mylabel <- paste(mymid,hyperlink('method_6.htm','Closest Observation',''),sep=' - ')
a<-table.element(a,mylabel,header=TRUE)
a<-table.element(a,midm[6])
a<-table.element(a,'')
a<-table.row.end(a)
a<-table.row.start(a)
mymid <- hyperlink('midmean.htm', 'Midmean', 'click to view the definition of the Midmean')
mylabel <- paste(mymid,hyperlink('method_7.htm','True Basic - Statistics Graphics Toolkit',''),sep=' - ')
a<-table.element(a,mylabel,header=TRUE)
a<-table.element(a,midm[7])
a<-table.element(a,'')
a<-table.row.end(a)
a<-table.row.start(a)
mymid <- hyperlink('midmean.htm', 'Midmean', 'click to view the definition of the Midmean')
mylabel <- paste(mymid,hyperlink('method_8.htm','MS Excel (old versions)',''),sep=' - ')
a<-table.element(a,mylabel,header=TRUE)
a<-table.element(a,midm[8])
a<-table.element(a,'')
a<-table.row.end(a)
a<-table.row.start(a)
a<-table.element(a,'Number of observations',header=TRUE)
a<-table.element(a,length(x))
a<-table.element(a,'')
a<-table.row.end(a)
a<-table.end(a)
table.save(a,file='mytable.tab')