Free Statistics

of Irreproducible Research!

Author's title

Author*The author of this computation has been verified*
R Software Modulerwasp_multipleregression.wasp
Title produced by softwareMultiple Regression
Date of computationFri, 05 Dec 2008 08:26:04 -0700
Cite this page as followsStatistical Computations at FreeStatistics.org, Office for Research Development and Education, URL https://freestatistics.org/blog/index.php?v=date/2008/Dec/05/t1228490822x01jlghwavevpwv.htm/, Retrieved Thu, 16 May 2024 21:32:42 +0000
Statistical Computations at FreeStatistics.org, Office for Research Development and Education, URL https://freestatistics.org/blog/index.php?pk=29319, Retrieved Thu, 16 May 2024 21:32:42 +0000
QR Codes:

Original text written by user:
IsPrivate?No (this computation is public)
User-defined keywords
Estimated Impact178
Family? (F = Feedback message, R = changed R code, M = changed R Module, P = changed Parameters, D = changed Data)
-       [Multiple Regression] [Paper - Regressio...] [2008-12-05 15:26:04] [4127a50d3937d4bda99dae34ed7ecdc5] [Current]
Feedback Forum

Post a new message
Dataseries X:
95.2	0
95.00	0
94.00	0
92.2	0
91.00	0
91.2	0
103.4	1
105.00	0
104.6	0
103.8	0
101.8	0
102.4	0
103.8	0
103.4	0
102.00	0
101.8	0
100.2	0
101.4	0
113.8	0
116.00	0
115.6	0
113.00	0
109.4	0
111.00	0
112.4	0
112.2	0
111.00	0
108.8	0
107.4	0
108.6	0
118.8	0
122.2	1
122.6	0
122.2	0
118.8	0
119.00	0
118.2	0
117.8	0
116.8	0
114.6	0
113.4	0
113.8	0
124.2	0
125.8	0
125.6	0
122.4	0
119.00	0
119.4	0
118.6	0
118.00	0
116.00	0
114.8	0
114.6	0
114.6	0
124.00	0
125.2	0
124.00	0
117.6	1
113.2	0
111.4	0
112.2	0
109.8	0
106.4	0
105.2	0
102.2	0
99.8	0
111.00	0
113.00	0
108.4	0
105.4	0
102.00	0
102.8	0


Summary of computational transaction
Raw Inputview raw input (R code)
Raw Outputview raw output of R engine
Computing time3 seconds
R Server'Gwilym Jenkins' @ 72.249.127.135

\begin{tabular}{lllllllll}
\hline
Summary of computational transaction \tabularnewline
Raw Input & view raw input (R code)  \tabularnewline
Raw Output & view raw output of R engine  \tabularnewline
Computing time & 3 seconds \tabularnewline
R Server & 'Gwilym Jenkins' @ 72.249.127.135 \tabularnewline
\hline
\end{tabular}
%Source: https://freestatistics.org/blog/index.php?pk=29319&T=0

[TABLE]
[ROW][C]Summary of computational transaction[/C][/ROW]
[ROW][C]Raw Input[/C][C]view raw input (R code) [/C][/ROW]
[ROW][C]Raw Output[/C][C]view raw output of R engine [/C][/ROW]
[ROW][C]Computing time[/C][C]3 seconds[/C][/ROW]
[ROW][C]R Server[/C][C]'Gwilym Jenkins' @ 72.249.127.135[/C][/ROW]
[/TABLE]
Source: https://freestatistics.org/blog/index.php?pk=29319&T=0

Globally Unique Identifier (entire table): ba.freestatistics.org/blog/index.php?pk=29319&T=0

As an alternative you can also use a QR Code:  

The GUIDs for individual cells are displayed in the table below:

Summary of computational transaction
Raw Inputview raw input (R code)
Raw Outputview raw output of R engine
Computing time3 seconds
R Server'Gwilym Jenkins' @ 72.249.127.135


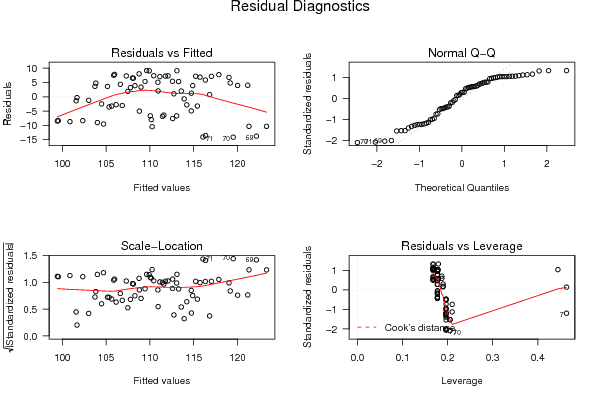
Multiple Linear Regression - Estimated Regression Equation
Werkloosheid[t] = + 103.498852223816 -0.554088952654242Dumivariabele[t] + 1.03125298900049M1[t] + 0.152654232424681M2[t] -1.69261119081780M3[t] -3.33787661406025M4[t] -4.94980870396939M5[t] -5.02840746054521M6[t] + 5.85200860832138M7[t] + 7.67340985174558M8[t] + 6.3357962697274M9[t] + 3.51621233859398M10[t] -0.121401243424195M11[t] + 0.178598756575801t + e[t]

\begin{tabular}{lllllllll}
\hline
Multiple Linear Regression - Estimated Regression Equation \tabularnewline
Werkloosheid[t] =  +  103.498852223816 -0.554088952654242Dumivariabele[t] +  1.03125298900049M1[t] +  0.152654232424681M2[t] -1.69261119081780M3[t] -3.33787661406025M4[t] -4.94980870396939M5[t] -5.02840746054521M6[t] +  5.85200860832138M7[t] +  7.67340985174558M8[t] +  6.3357962697274M9[t] +  3.51621233859398M10[t] -0.121401243424195M11[t] +  0.178598756575801t  + e[t] \tabularnewline
\hline
\end{tabular}
%Source: https://freestatistics.org/blog/index.php?pk=29319&T=1

[TABLE]
[ROW][C]Multiple Linear Regression - Estimated Regression Equation[/C][/ROW]
[ROW][C]Werkloosheid[t] =  +  103.498852223816 -0.554088952654242Dumivariabele[t] +  1.03125298900049M1[t] +  0.152654232424681M2[t] -1.69261119081780M3[t] -3.33787661406025M4[t] -4.94980870396939M5[t] -5.02840746054521M6[t] +  5.85200860832138M7[t] +  7.67340985174558M8[t] +  6.3357962697274M9[t] +  3.51621233859398M10[t] -0.121401243424195M11[t] +  0.178598756575801t  + e[t][/C][/ROW]
[/TABLE]
Source: https://freestatistics.org/blog/index.php?pk=29319&T=1

Globally Unique Identifier (entire table): ba.freestatistics.org/blog/index.php?pk=29319&T=1

As an alternative you can also use a QR Code:  

The GUIDs for individual cells are displayed in the table below:

Multiple Linear Regression - Estimated Regression Equation
Werkloosheid[t] = + 103.498852223816 -0.554088952654242Dumivariabele[t] + 1.03125298900049M1[t] + 0.152654232424681M2[t] -1.69261119081780M3[t] -3.33787661406025M4[t] -4.94980870396939M5[t] -5.02840746054521M6[t] + 5.85200860832138M7[t] + 7.67340985174558M8[t] + 6.3357962697274M9[t] + 3.51621233859398M10[t] -0.121401243424195M11[t] + 0.178598756575801t + e[t]


Multiple Linear Regression - Ordinary Least Squares
VariableParameterS.D.T-STATH0: parameter = 02-tail p-value1-tail p-value
(Intercept)103.4988522238163.60098828.741800
Dumivariabele-0.5540889526542424.808957-0.11520.9086690.454334
M11.031252989000494.4068660.2340.8158010.4079
M20.1526542324246814.4023090.03470.9724570.486229
M3-1.692611190817804.398181-0.38480.7017610.35088
M4-3.337876614060254.394484-0.75960.4505940.225297
M5-4.949808703969394.39122-1.12720.2642970.132149
M6-5.028407460545214.388389-1.14580.2565660.128283
M75.852008608321384.456051.31330.1942630.097131
M87.673409851745584.4546331.72260.0902950.045148
M96.33579626972744.3825041.44570.1536430.076821
M103.516212338593984.4530880.78960.4329710.216485
M11-0.1214012434241954.380758-0.02770.9779870.488993
t0.1785987565758010.0437254.08460.0001376.9e-05

\begin{tabular}{lllllllll}
\hline
Multiple Linear Regression - Ordinary Least Squares \tabularnewline
Variable & Parameter & S.D. & T-STATH0: parameter = 0 & 2-tail p-value & 1-tail p-value \tabularnewline
(Intercept) & 103.498852223816 & 3.600988 & 28.7418 & 0 & 0 \tabularnewline
Dumivariabele & -0.554088952654242 & 4.808957 & -0.1152 & 0.908669 & 0.454334 \tabularnewline
M1 & 1.03125298900049 & 4.406866 & 0.234 & 0.815801 & 0.4079 \tabularnewline
M2 & 0.152654232424681 & 4.402309 & 0.0347 & 0.972457 & 0.486229 \tabularnewline
M3 & -1.69261119081780 & 4.398181 & -0.3848 & 0.701761 & 0.35088 \tabularnewline
M4 & -3.33787661406025 & 4.394484 & -0.7596 & 0.450594 & 0.225297 \tabularnewline
M5 & -4.94980870396939 & 4.39122 & -1.1272 & 0.264297 & 0.132149 \tabularnewline
M6 & -5.02840746054521 & 4.388389 & -1.1458 & 0.256566 & 0.128283 \tabularnewline
M7 & 5.85200860832138 & 4.45605 & 1.3133 & 0.194263 & 0.097131 \tabularnewline
M8 & 7.67340985174558 & 4.454633 & 1.7226 & 0.090295 & 0.045148 \tabularnewline
M9 & 6.3357962697274 & 4.382504 & 1.4457 & 0.153643 & 0.076821 \tabularnewline
M10 & 3.51621233859398 & 4.453088 & 0.7896 & 0.432971 & 0.216485 \tabularnewline
M11 & -0.121401243424195 & 4.380758 & -0.0277 & 0.977987 & 0.488993 \tabularnewline
t & 0.178598756575801 & 0.043725 & 4.0846 & 0.000137 & 6.9e-05 \tabularnewline
\hline
\end{tabular}
%Source: https://freestatistics.org/blog/index.php?pk=29319&T=2

[TABLE]
[ROW][C]Multiple Linear Regression - Ordinary Least Squares[/C][/ROW]
[ROW][C]Variable[/C][C]Parameter[/C][C]S.D.[/C][C]T-STATH0: parameter = 0[/C][C]2-tail p-value[/C][C]1-tail p-value[/C][/ROW]
[ROW][C](Intercept)[/C][C]103.498852223816[/C][C]3.600988[/C][C]28.7418[/C][C]0[/C][C]0[/C][/ROW]
[ROW][C]Dumivariabele[/C][C]-0.554088952654242[/C][C]4.808957[/C][C]-0.1152[/C][C]0.908669[/C][C]0.454334[/C][/ROW]
[ROW][C]M1[/C][C]1.03125298900049[/C][C]4.406866[/C][C]0.234[/C][C]0.815801[/C][C]0.4079[/C][/ROW]
[ROW][C]M2[/C][C]0.152654232424681[/C][C]4.402309[/C][C]0.0347[/C][C]0.972457[/C][C]0.486229[/C][/ROW]
[ROW][C]M3[/C][C]-1.69261119081780[/C][C]4.398181[/C][C]-0.3848[/C][C]0.701761[/C][C]0.35088[/C][/ROW]
[ROW][C]M4[/C][C]-3.33787661406025[/C][C]4.394484[/C][C]-0.7596[/C][C]0.450594[/C][C]0.225297[/C][/ROW]
[ROW][C]M5[/C][C]-4.94980870396939[/C][C]4.39122[/C][C]-1.1272[/C][C]0.264297[/C][C]0.132149[/C][/ROW]
[ROW][C]M6[/C][C]-5.02840746054521[/C][C]4.388389[/C][C]-1.1458[/C][C]0.256566[/C][C]0.128283[/C][/ROW]
[ROW][C]M7[/C][C]5.85200860832138[/C][C]4.45605[/C][C]1.3133[/C][C]0.194263[/C][C]0.097131[/C][/ROW]
[ROW][C]M8[/C][C]7.67340985174558[/C][C]4.454633[/C][C]1.7226[/C][C]0.090295[/C][C]0.045148[/C][/ROW]
[ROW][C]M9[/C][C]6.3357962697274[/C][C]4.382504[/C][C]1.4457[/C][C]0.153643[/C][C]0.076821[/C][/ROW]
[ROW][C]M10[/C][C]3.51621233859398[/C][C]4.453088[/C][C]0.7896[/C][C]0.432971[/C][C]0.216485[/C][/ROW]
[ROW][C]M11[/C][C]-0.121401243424195[/C][C]4.380758[/C][C]-0.0277[/C][C]0.977987[/C][C]0.488993[/C][/ROW]
[ROW][C]t[/C][C]0.178598756575801[/C][C]0.043725[/C][C]4.0846[/C][C]0.000137[/C][C]6.9e-05[/C][/ROW]
[/TABLE]
Source: https://freestatistics.org/blog/index.php?pk=29319&T=2

Globally Unique Identifier (entire table): ba.freestatistics.org/blog/index.php?pk=29319&T=2

As an alternative you can also use a QR Code:  

The GUIDs for individual cells are displayed in the table below:

Multiple Linear Regression - Ordinary Least Squares
VariableParameterS.D.T-STATH0: parameter = 02-tail p-value1-tail p-value
(Intercept)103.4988522238163.60098828.741800
Dumivariabele-0.5540889526542424.808957-0.11520.9086690.454334
M11.031252989000494.4068660.2340.8158010.4079
M20.1526542324246814.4023090.03470.9724570.486229
M3-1.692611190817804.398181-0.38480.7017610.35088
M4-3.337876614060254.394484-0.75960.4505940.225297
M5-4.949808703969394.39122-1.12720.2642970.132149
M6-5.028407460545214.388389-1.14580.2565660.128283
M75.852008608321384.456051.31330.1942630.097131
M87.673409851745584.4546331.72260.0902950.045148
M96.33579626972744.3825041.44570.1536430.076821
M103.516212338593984.4530880.78960.4329710.216485
M11-0.1214012434241954.380758-0.02770.9779870.488993
t0.1785987565758010.0437254.08460.0001376.9e-05


Multiple Linear Regression - Regression Statistics
Multiple R0.640784343492286
R-squared0.410604574864839
Adjusted R-squared0.278498703713855
F-TEST (value)3.10814781574362
F-TEST (DF numerator)13
F-TEST (DF denominator)58
p-value0.00149136738186972
Multiple Linear Regression - Residual Statistics
Residual Standard Deviation7.58731818362793
Sum Squared Residuals3338.90903873744

\begin{tabular}{lllllllll}
\hline
Multiple Linear Regression - Regression Statistics \tabularnewline
Multiple R & 0.640784343492286 \tabularnewline
R-squared & 0.410604574864839 \tabularnewline
Adjusted R-squared & 0.278498703713855 \tabularnewline
F-TEST (value) & 3.10814781574362 \tabularnewline
F-TEST (DF numerator) & 13 \tabularnewline
F-TEST (DF denominator) & 58 \tabularnewline
p-value & 0.00149136738186972 \tabularnewline
Multiple Linear Regression - Residual Statistics \tabularnewline
Residual Standard Deviation & 7.58731818362793 \tabularnewline
Sum Squared Residuals & 3338.90903873744 \tabularnewline
\hline
\end{tabular}
%Source: https://freestatistics.org/blog/index.php?pk=29319&T=3

[TABLE]
[ROW][C]Multiple Linear Regression - Regression Statistics[/C][/ROW]
[ROW][C]Multiple R[/C][C]0.640784343492286[/C][/ROW]
[ROW][C]R-squared[/C][C]0.410604574864839[/C][/ROW]
[ROW][C]Adjusted R-squared[/C][C]0.278498703713855[/C][/ROW]
[ROW][C]F-TEST (value)[/C][C]3.10814781574362[/C][/ROW]
[ROW][C]F-TEST (DF numerator)[/C][C]13[/C][/ROW]
[ROW][C]F-TEST (DF denominator)[/C][C]58[/C][/ROW]
[ROW][C]p-value[/C][C]0.00149136738186972[/C][/ROW]
[ROW][C]Multiple Linear Regression - Residual Statistics[/C][/ROW]
[ROW][C]Residual Standard Deviation[/C][C]7.58731818362793[/C][/ROW]
[ROW][C]Sum Squared Residuals[/C][C]3338.90903873744[/C][/ROW]
[/TABLE]
Source: https://freestatistics.org/blog/index.php?pk=29319&T=3

Globally Unique Identifier (entire table): ba.freestatistics.org/blog/index.php?pk=29319&T=3

As an alternative you can also use a QR Code:  

The GUIDs for individual cells are displayed in the table below:

Multiple Linear Regression - Regression Statistics
Multiple R0.640784343492286
R-squared0.410604574864839
Adjusted R-squared0.278498703713855
F-TEST (value)3.10814781574362
F-TEST (DF numerator)13
F-TEST (DF denominator)58
p-value0.00149136738186972
Multiple Linear Regression - Residual Statistics
Residual Standard Deviation7.58731818362793
Sum Squared Residuals3338.90903873744


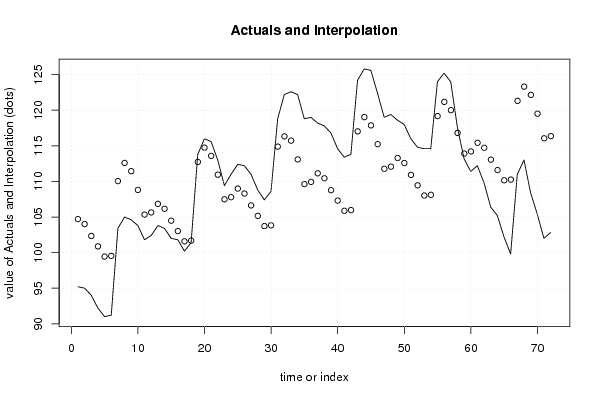
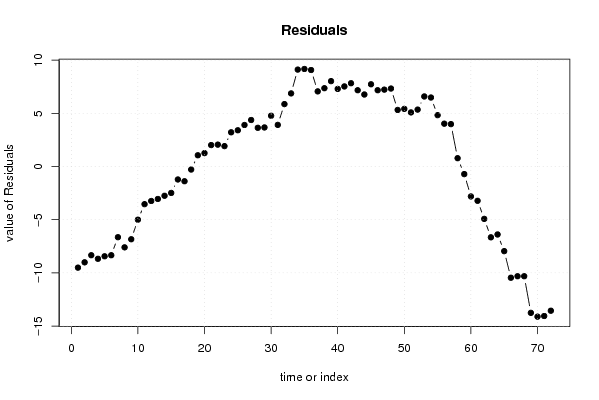
Multiple Linear Regression - Actuals, Interpolation, and Residuals
Time or IndexActualsInterpolationForecastResidualsPrediction Error
195.2104.708703969393-9.50870396939259
295104.008703969393-9.00870396939262
394102.342037302726-8.34203730272597
492.2100.875370636059-8.67537063605931
59199.442037302726-8.44203730272597
691.299.542037302726-8.34203730272596
7103.4110.046963175514-6.64696317551412
8105112.601052128168-7.60105212816832
9104.6111.442037302726-6.84203730272598
10103.8108.801052128168-5.00105212816834
11101.8105.342037302726-3.54203730272597
12102.4105.642037302726-3.24203730272596
13103.8106.851889048302-3.05188904830226
14103.4106.151889048302-2.75188904830223
15102104.485222381636-2.48522238163558
16101.8103.018555714969-1.21855571496892
17100.2101.585222381636-1.38522238163558
18101.4101.685222381636-0.285222381635574
19113.8112.7442372070781.05576279292204
20116114.7442372070781.25576279292204
21115.6113.5852223816362.01477761836441
22113110.9442372070782.05576279292204
23109.4107.4852223816361.91477761836442
24111107.7852223816363.21477761836442
25112.4108.9950741272123.40492587278813
26112.2108.2950741272123.90492587278814
27111106.6284074605454.37159253945481
28108.8105.1617407938793.63825920612147
29107.4103.7284074605453.67159253945481
30108.6103.8284074605454.7715925394548
31118.8114.8874222859883.91257771401243
32122.2116.3333333333335.86666666666665
33122.6115.7284074605456.8715925394548
34122.2113.0874222859889.11257771401244
35118.8109.6284074605459.1715925394548
36119109.9284074605459.07159253945481
37118.2111.1382592061217.06174079387852
38117.8110.4382592061217.36174079387852
39116.8108.7715925394558.02840746054519
40114.6107.3049258727887.29507412721185
41113.4105.8715925394557.5284074605452
42113.8105.9715925394557.8284074605452
43124.2117.0306073648977.16939263510282
44125.8119.0306073648976.7693926351028
45125.6117.8715925394557.7284074605452
46122.4115.2306073648977.16939263510283
47119111.7715925394557.2284074605452
48119.4112.0715925394557.3284074605452
49118.6113.2814442850315.3185557149689
50118112.5814442850315.41855571496891
51116110.9147776183645.08522238163559
52114.8109.4481109516985.35188904830225
53114.6108.0147776183646.58522238163558
54114.6108.1147776183646.48522238163558
55124119.1737924438074.82620755619321
56125.2121.1737924438074.02620755619320
57124120.0147776183643.98522238163559
58117.6116.8197034911530.78029650884743
59113.2113.914777618364-0.714777618364414
60111.4114.214777618364-2.81477761836441
61112.2115.424629363941-3.22462936394070
62109.8114.724629363941-4.9246293639407
63106.4113.057962697274-6.65796269727402
64105.2111.591296030607-6.39129603060736
65102.2110.157962697274-7.95796269727402
6699.8110.257962697274-10.4579626972740
67111121.316977522716-10.3169775227164
68113123.316977522716-10.3169775227164
69108.4122.157962697274-13.7579626972740
70105.4119.516977522716-14.1169775227164
71102116.057962697274-14.0579626972740
72102.8116.357962697274-13.5579626972740

\begin{tabular}{lllllllll}
\hline
Multiple Linear Regression - Actuals, Interpolation, and Residuals \tabularnewline
Time or Index & Actuals & InterpolationForecast & ResidualsPrediction Error \tabularnewline
1 & 95.2 & 104.708703969393 & -9.50870396939259 \tabularnewline
2 & 95 & 104.008703969393 & -9.00870396939262 \tabularnewline
3 & 94 & 102.342037302726 & -8.34203730272597 \tabularnewline
4 & 92.2 & 100.875370636059 & -8.67537063605931 \tabularnewline
5 & 91 & 99.442037302726 & -8.44203730272597 \tabularnewline
6 & 91.2 & 99.542037302726 & -8.34203730272596 \tabularnewline
7 & 103.4 & 110.046963175514 & -6.64696317551412 \tabularnewline
8 & 105 & 112.601052128168 & -7.60105212816832 \tabularnewline
9 & 104.6 & 111.442037302726 & -6.84203730272598 \tabularnewline
10 & 103.8 & 108.801052128168 & -5.00105212816834 \tabularnewline
11 & 101.8 & 105.342037302726 & -3.54203730272597 \tabularnewline
12 & 102.4 & 105.642037302726 & -3.24203730272596 \tabularnewline
13 & 103.8 & 106.851889048302 & -3.05188904830226 \tabularnewline
14 & 103.4 & 106.151889048302 & -2.75188904830223 \tabularnewline
15 & 102 & 104.485222381636 & -2.48522238163558 \tabularnewline
16 & 101.8 & 103.018555714969 & -1.21855571496892 \tabularnewline
17 & 100.2 & 101.585222381636 & -1.38522238163558 \tabularnewline
18 & 101.4 & 101.685222381636 & -0.285222381635574 \tabularnewline
19 & 113.8 & 112.744237207078 & 1.05576279292204 \tabularnewline
20 & 116 & 114.744237207078 & 1.25576279292204 \tabularnewline
21 & 115.6 & 113.585222381636 & 2.01477761836441 \tabularnewline
22 & 113 & 110.944237207078 & 2.05576279292204 \tabularnewline
23 & 109.4 & 107.485222381636 & 1.91477761836442 \tabularnewline
24 & 111 & 107.785222381636 & 3.21477761836442 \tabularnewline
25 & 112.4 & 108.995074127212 & 3.40492587278813 \tabularnewline
26 & 112.2 & 108.295074127212 & 3.90492587278814 \tabularnewline
27 & 111 & 106.628407460545 & 4.37159253945481 \tabularnewline
28 & 108.8 & 105.161740793879 & 3.63825920612147 \tabularnewline
29 & 107.4 & 103.728407460545 & 3.67159253945481 \tabularnewline
30 & 108.6 & 103.828407460545 & 4.7715925394548 \tabularnewline
31 & 118.8 & 114.887422285988 & 3.91257771401243 \tabularnewline
32 & 122.2 & 116.333333333333 & 5.86666666666665 \tabularnewline
33 & 122.6 & 115.728407460545 & 6.8715925394548 \tabularnewline
34 & 122.2 & 113.087422285988 & 9.11257771401244 \tabularnewline
35 & 118.8 & 109.628407460545 & 9.1715925394548 \tabularnewline
36 & 119 & 109.928407460545 & 9.07159253945481 \tabularnewline
37 & 118.2 & 111.138259206121 & 7.06174079387852 \tabularnewline
38 & 117.8 & 110.438259206121 & 7.36174079387852 \tabularnewline
39 & 116.8 & 108.771592539455 & 8.02840746054519 \tabularnewline
40 & 114.6 & 107.304925872788 & 7.29507412721185 \tabularnewline
41 & 113.4 & 105.871592539455 & 7.5284074605452 \tabularnewline
42 & 113.8 & 105.971592539455 & 7.8284074605452 \tabularnewline
43 & 124.2 & 117.030607364897 & 7.16939263510282 \tabularnewline
44 & 125.8 & 119.030607364897 & 6.7693926351028 \tabularnewline
45 & 125.6 & 117.871592539455 & 7.7284074605452 \tabularnewline
46 & 122.4 & 115.230607364897 & 7.16939263510283 \tabularnewline
47 & 119 & 111.771592539455 & 7.2284074605452 \tabularnewline
48 & 119.4 & 112.071592539455 & 7.3284074605452 \tabularnewline
49 & 118.6 & 113.281444285031 & 5.3185557149689 \tabularnewline
50 & 118 & 112.581444285031 & 5.41855571496891 \tabularnewline
51 & 116 & 110.914777618364 & 5.08522238163559 \tabularnewline
52 & 114.8 & 109.448110951698 & 5.35188904830225 \tabularnewline
53 & 114.6 & 108.014777618364 & 6.58522238163558 \tabularnewline
54 & 114.6 & 108.114777618364 & 6.48522238163558 \tabularnewline
55 & 124 & 119.173792443807 & 4.82620755619321 \tabularnewline
56 & 125.2 & 121.173792443807 & 4.02620755619320 \tabularnewline
57 & 124 & 120.014777618364 & 3.98522238163559 \tabularnewline
58 & 117.6 & 116.819703491153 & 0.78029650884743 \tabularnewline
59 & 113.2 & 113.914777618364 & -0.714777618364414 \tabularnewline
60 & 111.4 & 114.214777618364 & -2.81477761836441 \tabularnewline
61 & 112.2 & 115.424629363941 & -3.22462936394070 \tabularnewline
62 & 109.8 & 114.724629363941 & -4.9246293639407 \tabularnewline
63 & 106.4 & 113.057962697274 & -6.65796269727402 \tabularnewline
64 & 105.2 & 111.591296030607 & -6.39129603060736 \tabularnewline
65 & 102.2 & 110.157962697274 & -7.95796269727402 \tabularnewline
66 & 99.8 & 110.257962697274 & -10.4579626972740 \tabularnewline
67 & 111 & 121.316977522716 & -10.3169775227164 \tabularnewline
68 & 113 & 123.316977522716 & -10.3169775227164 \tabularnewline
69 & 108.4 & 122.157962697274 & -13.7579626972740 \tabularnewline
70 & 105.4 & 119.516977522716 & -14.1169775227164 \tabularnewline
71 & 102 & 116.057962697274 & -14.0579626972740 \tabularnewline
72 & 102.8 & 116.357962697274 & -13.5579626972740 \tabularnewline
\hline
\end{tabular}
%Source: https://freestatistics.org/blog/index.php?pk=29319&T=4

[TABLE]
[ROW][C]Multiple Linear Regression - Actuals, Interpolation, and Residuals[/C][/ROW]
[ROW][C]Time or Index[/C][C]Actuals[/C][C]InterpolationForecast[/C][C]ResidualsPrediction Error[/C][/ROW]
[ROW][C]1[/C][C]95.2[/C][C]104.708703969393[/C][C]-9.50870396939259[/C][/ROW]
[ROW][C]2[/C][C]95[/C][C]104.008703969393[/C][C]-9.00870396939262[/C][/ROW]
[ROW][C]3[/C][C]94[/C][C]102.342037302726[/C][C]-8.34203730272597[/C][/ROW]
[ROW][C]4[/C][C]92.2[/C][C]100.875370636059[/C][C]-8.67537063605931[/C][/ROW]
[ROW][C]5[/C][C]91[/C][C]99.442037302726[/C][C]-8.44203730272597[/C][/ROW]
[ROW][C]6[/C][C]91.2[/C][C]99.542037302726[/C][C]-8.34203730272596[/C][/ROW]
[ROW][C]7[/C][C]103.4[/C][C]110.046963175514[/C][C]-6.64696317551412[/C][/ROW]
[ROW][C]8[/C][C]105[/C][C]112.601052128168[/C][C]-7.60105212816832[/C][/ROW]
[ROW][C]9[/C][C]104.6[/C][C]111.442037302726[/C][C]-6.84203730272598[/C][/ROW]
[ROW][C]10[/C][C]103.8[/C][C]108.801052128168[/C][C]-5.00105212816834[/C][/ROW]
[ROW][C]11[/C][C]101.8[/C][C]105.342037302726[/C][C]-3.54203730272597[/C][/ROW]
[ROW][C]12[/C][C]102.4[/C][C]105.642037302726[/C][C]-3.24203730272596[/C][/ROW]
[ROW][C]13[/C][C]103.8[/C][C]106.851889048302[/C][C]-3.05188904830226[/C][/ROW]
[ROW][C]14[/C][C]103.4[/C][C]106.151889048302[/C][C]-2.75188904830223[/C][/ROW]
[ROW][C]15[/C][C]102[/C][C]104.485222381636[/C][C]-2.48522238163558[/C][/ROW]
[ROW][C]16[/C][C]101.8[/C][C]103.018555714969[/C][C]-1.21855571496892[/C][/ROW]
[ROW][C]17[/C][C]100.2[/C][C]101.585222381636[/C][C]-1.38522238163558[/C][/ROW]
[ROW][C]18[/C][C]101.4[/C][C]101.685222381636[/C][C]-0.285222381635574[/C][/ROW]
[ROW][C]19[/C][C]113.8[/C][C]112.744237207078[/C][C]1.05576279292204[/C][/ROW]
[ROW][C]20[/C][C]116[/C][C]114.744237207078[/C][C]1.25576279292204[/C][/ROW]
[ROW][C]21[/C][C]115.6[/C][C]113.585222381636[/C][C]2.01477761836441[/C][/ROW]
[ROW][C]22[/C][C]113[/C][C]110.944237207078[/C][C]2.05576279292204[/C][/ROW]
[ROW][C]23[/C][C]109.4[/C][C]107.485222381636[/C][C]1.91477761836442[/C][/ROW]
[ROW][C]24[/C][C]111[/C][C]107.785222381636[/C][C]3.21477761836442[/C][/ROW]
[ROW][C]25[/C][C]112.4[/C][C]108.995074127212[/C][C]3.40492587278813[/C][/ROW]
[ROW][C]26[/C][C]112.2[/C][C]108.295074127212[/C][C]3.90492587278814[/C][/ROW]
[ROW][C]27[/C][C]111[/C][C]106.628407460545[/C][C]4.37159253945481[/C][/ROW]
[ROW][C]28[/C][C]108.8[/C][C]105.161740793879[/C][C]3.63825920612147[/C][/ROW]
[ROW][C]29[/C][C]107.4[/C][C]103.728407460545[/C][C]3.67159253945481[/C][/ROW]
[ROW][C]30[/C][C]108.6[/C][C]103.828407460545[/C][C]4.7715925394548[/C][/ROW]
[ROW][C]31[/C][C]118.8[/C][C]114.887422285988[/C][C]3.91257771401243[/C][/ROW]
[ROW][C]32[/C][C]122.2[/C][C]116.333333333333[/C][C]5.86666666666665[/C][/ROW]
[ROW][C]33[/C][C]122.6[/C][C]115.728407460545[/C][C]6.8715925394548[/C][/ROW]
[ROW][C]34[/C][C]122.2[/C][C]113.087422285988[/C][C]9.11257771401244[/C][/ROW]
[ROW][C]35[/C][C]118.8[/C][C]109.628407460545[/C][C]9.1715925394548[/C][/ROW]
[ROW][C]36[/C][C]119[/C][C]109.928407460545[/C][C]9.07159253945481[/C][/ROW]
[ROW][C]37[/C][C]118.2[/C][C]111.138259206121[/C][C]7.06174079387852[/C][/ROW]
[ROW][C]38[/C][C]117.8[/C][C]110.438259206121[/C][C]7.36174079387852[/C][/ROW]
[ROW][C]39[/C][C]116.8[/C][C]108.771592539455[/C][C]8.02840746054519[/C][/ROW]
[ROW][C]40[/C][C]114.6[/C][C]107.304925872788[/C][C]7.29507412721185[/C][/ROW]
[ROW][C]41[/C][C]113.4[/C][C]105.871592539455[/C][C]7.5284074605452[/C][/ROW]
[ROW][C]42[/C][C]113.8[/C][C]105.971592539455[/C][C]7.8284074605452[/C][/ROW]
[ROW][C]43[/C][C]124.2[/C][C]117.030607364897[/C][C]7.16939263510282[/C][/ROW]
[ROW][C]44[/C][C]125.8[/C][C]119.030607364897[/C][C]6.7693926351028[/C][/ROW]
[ROW][C]45[/C][C]125.6[/C][C]117.871592539455[/C][C]7.7284074605452[/C][/ROW]
[ROW][C]46[/C][C]122.4[/C][C]115.230607364897[/C][C]7.16939263510283[/C][/ROW]
[ROW][C]47[/C][C]119[/C][C]111.771592539455[/C][C]7.2284074605452[/C][/ROW]
[ROW][C]48[/C][C]119.4[/C][C]112.071592539455[/C][C]7.3284074605452[/C][/ROW]
[ROW][C]49[/C][C]118.6[/C][C]113.281444285031[/C][C]5.3185557149689[/C][/ROW]
[ROW][C]50[/C][C]118[/C][C]112.581444285031[/C][C]5.41855571496891[/C][/ROW]
[ROW][C]51[/C][C]116[/C][C]110.914777618364[/C][C]5.08522238163559[/C][/ROW]
[ROW][C]52[/C][C]114.8[/C][C]109.448110951698[/C][C]5.35188904830225[/C][/ROW]
[ROW][C]53[/C][C]114.6[/C][C]108.014777618364[/C][C]6.58522238163558[/C][/ROW]
[ROW][C]54[/C][C]114.6[/C][C]108.114777618364[/C][C]6.48522238163558[/C][/ROW]
[ROW][C]55[/C][C]124[/C][C]119.173792443807[/C][C]4.82620755619321[/C][/ROW]
[ROW][C]56[/C][C]125.2[/C][C]121.173792443807[/C][C]4.02620755619320[/C][/ROW]
[ROW][C]57[/C][C]124[/C][C]120.014777618364[/C][C]3.98522238163559[/C][/ROW]
[ROW][C]58[/C][C]117.6[/C][C]116.819703491153[/C][C]0.78029650884743[/C][/ROW]
[ROW][C]59[/C][C]113.2[/C][C]113.914777618364[/C][C]-0.714777618364414[/C][/ROW]
[ROW][C]60[/C][C]111.4[/C][C]114.214777618364[/C][C]-2.81477761836441[/C][/ROW]
[ROW][C]61[/C][C]112.2[/C][C]115.424629363941[/C][C]-3.22462936394070[/C][/ROW]
[ROW][C]62[/C][C]109.8[/C][C]114.724629363941[/C][C]-4.9246293639407[/C][/ROW]
[ROW][C]63[/C][C]106.4[/C][C]113.057962697274[/C][C]-6.65796269727402[/C][/ROW]
[ROW][C]64[/C][C]105.2[/C][C]111.591296030607[/C][C]-6.39129603060736[/C][/ROW]
[ROW][C]65[/C][C]102.2[/C][C]110.157962697274[/C][C]-7.95796269727402[/C][/ROW]
[ROW][C]66[/C][C]99.8[/C][C]110.257962697274[/C][C]-10.4579626972740[/C][/ROW]
[ROW][C]67[/C][C]111[/C][C]121.316977522716[/C][C]-10.3169775227164[/C][/ROW]
[ROW][C]68[/C][C]113[/C][C]123.316977522716[/C][C]-10.3169775227164[/C][/ROW]
[ROW][C]69[/C][C]108.4[/C][C]122.157962697274[/C][C]-13.7579626972740[/C][/ROW]
[ROW][C]70[/C][C]105.4[/C][C]119.516977522716[/C][C]-14.1169775227164[/C][/ROW]
[ROW][C]71[/C][C]102[/C][C]116.057962697274[/C][C]-14.0579626972740[/C][/ROW]
[ROW][C]72[/C][C]102.8[/C][C]116.357962697274[/C][C]-13.5579626972740[/C][/ROW]
[/TABLE]
Source: https://freestatistics.org/blog/index.php?pk=29319&T=4

Globally Unique Identifier (entire table): ba.freestatistics.org/blog/index.php?pk=29319&T=4

As an alternative you can also use a QR Code:  

The GUIDs for individual cells are displayed in the table below:

Multiple Linear Regression - Actuals, Interpolation, and Residuals
Time or IndexActualsInterpolationForecastResidualsPrediction Error
195.2104.708703969393-9.50870396939259
295104.008703969393-9.00870396939262
394102.342037302726-8.34203730272597
492.2100.875370636059-8.67537063605931
59199.442037302726-8.44203730272597
691.299.542037302726-8.34203730272596
7103.4110.046963175514-6.64696317551412
8105112.601052128168-7.60105212816832
9104.6111.442037302726-6.84203730272598
10103.8108.801052128168-5.00105212816834
11101.8105.342037302726-3.54203730272597
12102.4105.642037302726-3.24203730272596
13103.8106.851889048302-3.05188904830226
14103.4106.151889048302-2.75188904830223
15102104.485222381636-2.48522238163558
16101.8103.018555714969-1.21855571496892
17100.2101.585222381636-1.38522238163558
18101.4101.685222381636-0.285222381635574
19113.8112.7442372070781.05576279292204
20116114.7442372070781.25576279292204
21115.6113.5852223816362.01477761836441
22113110.9442372070782.05576279292204
23109.4107.4852223816361.91477761836442
24111107.7852223816363.21477761836442
25112.4108.9950741272123.40492587278813
26112.2108.2950741272123.90492587278814
27111106.6284074605454.37159253945481
28108.8105.1617407938793.63825920612147
29107.4103.7284074605453.67159253945481
30108.6103.8284074605454.7715925394548
31118.8114.8874222859883.91257771401243
32122.2116.3333333333335.86666666666665
33122.6115.7284074605456.8715925394548
34122.2113.0874222859889.11257771401244
35118.8109.6284074605459.1715925394548
36119109.9284074605459.07159253945481
37118.2111.1382592061217.06174079387852
38117.8110.4382592061217.36174079387852
39116.8108.7715925394558.02840746054519
40114.6107.3049258727887.29507412721185
41113.4105.8715925394557.5284074605452
42113.8105.9715925394557.8284074605452
43124.2117.0306073648977.16939263510282
44125.8119.0306073648976.7693926351028
45125.6117.8715925394557.7284074605452
46122.4115.2306073648977.16939263510283
47119111.7715925394557.2284074605452
48119.4112.0715925394557.3284074605452
49118.6113.2814442850315.3185557149689
50118112.5814442850315.41855571496891
51116110.9147776183645.08522238163559
52114.8109.4481109516985.35188904830225
53114.6108.0147776183646.58522238163558
54114.6108.1147776183646.48522238163558
55124119.1737924438074.82620755619321
56125.2121.1737924438074.02620755619320
57124120.0147776183643.98522238163559
58117.6116.8197034911530.78029650884743
59113.2113.914777618364-0.714777618364414
60111.4114.214777618364-2.81477761836441
61112.2115.424629363941-3.22462936394070
62109.8114.724629363941-4.9246293639407
63106.4113.057962697274-6.65796269727402
64105.2111.591296030607-6.39129603060736
65102.2110.157962697274-7.95796269727402
6699.8110.257962697274-10.4579626972740
67111121.316977522716-10.3169775227164
68113123.316977522716-10.3169775227164
69108.4122.157962697274-13.7579626972740
70105.4119.516977522716-14.1169775227164
71102116.057962697274-14.0579626972740
72102.8116.357962697274-13.5579626972740


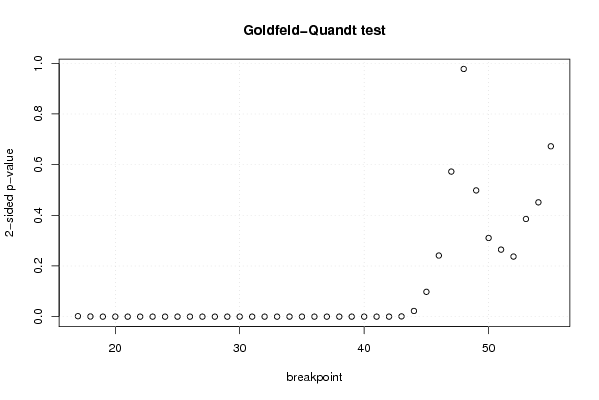
Goldfeld-Quandt test for Heteroskedasticity
p-valuesAlternative Hypothesis
breakpoint indexgreater2-sidedless
170.0009281522052962760.001856304410592550.999071847794704
180.0003092471134162120.0006184942268324250.999690752886584
193.23567820170955e-056.47135640341909e-050.999967643217983
202.63287329633982e-055.26574659267964e-050.999973671267037
211.11294142787016e-052.22588285574032e-050.999988870585721
221.87000273854808e-063.74000547709617e-060.999998129997261
231.13387395547069e-062.26774791094139e-060.999998866126045
242.52555021935058e-075.05110043870116e-070.999999747444978
257.58710922260604e-081.51742184452121e-070.999999924128908
261.99854627580138e-083.99709255160276e-080.999999980014537
275.17699671165076e-091.03539934233015e-080.999999994823003
285.59091398559214e-091.11818279711843e-080.999999994409086
295.79748195802338e-091.15949639160468e-080.999999994202518
303.25917723480674e-096.51835446961349e-090.999999996740823
311.02810985201841e-072.05621970403681e-070.999999897189015
321.15146406786644e-072.30292813573287e-070.999999884853593
338.6333596503733e-081.72667193007466e-070.999999913666404
343.7742201394031e-087.5484402788062e-080.999999962257799
351.54123613434915e-083.08247226869830e-080.999999984587639
366.85435007286094e-091.37087001457219e-080.99999999314565
375.25496176270613e-081.05099235254123e-070.999999947450382
382.28603290733624e-074.57206581467248e-070.99999977139671
393.96015106869575e-077.9203021373915e-070.999999603984893
402.29280955736129e-064.58561911472257e-060.999997707190443
411.07099269519224e-052.14198539038449e-050.999989290073048
424.34355453913659e-058.68710907827318e-050.99995656445461
430.0005619410926596830.001123882185319370.99943805890734
440.01122112276910900.02244224553821790.98877887723089
450.04898819695267020.09797639390534050.95101180304733
460.1205920831586430.2411841663172860.879407916841357
470.286294637441510.572589274883020.71370536255849
480.4888762769950720.9777525539901430.511123723004928
490.7508417584248060.4983164831503890.249158241575194
500.8446857895939430.3106284208121150.155314210406057
510.867720621802860.2645587563942790.132279378197139
520.881427137996270.2371457240074610.118572862003730
530.8072494710210320.3855010579579360.192750528978968
540.7743667298798710.4512665402402590.225633270120129
550.6637855859961790.6724288280076420.336214414003821

\begin{tabular}{lllllllll}
\hline
Goldfeld-Quandt test for Heteroskedasticity \tabularnewline
p-values & Alternative Hypothesis \tabularnewline
breakpoint index & greater & 2-sided & less \tabularnewline
17 & 0.000928152205296276 & 0.00185630441059255 & 0.999071847794704 \tabularnewline
18 & 0.000309247113416212 & 0.000618494226832425 & 0.999690752886584 \tabularnewline
19 & 3.23567820170955e-05 & 6.47135640341909e-05 & 0.999967643217983 \tabularnewline
20 & 2.63287329633982e-05 & 5.26574659267964e-05 & 0.999973671267037 \tabularnewline
21 & 1.11294142787016e-05 & 2.22588285574032e-05 & 0.999988870585721 \tabularnewline
22 & 1.87000273854808e-06 & 3.74000547709617e-06 & 0.999998129997261 \tabularnewline
23 & 1.13387395547069e-06 & 2.26774791094139e-06 & 0.999998866126045 \tabularnewline
24 & 2.52555021935058e-07 & 5.05110043870116e-07 & 0.999999747444978 \tabularnewline
25 & 7.58710922260604e-08 & 1.51742184452121e-07 & 0.999999924128908 \tabularnewline
26 & 1.99854627580138e-08 & 3.99709255160276e-08 & 0.999999980014537 \tabularnewline
27 & 5.17699671165076e-09 & 1.03539934233015e-08 & 0.999999994823003 \tabularnewline
28 & 5.59091398559214e-09 & 1.11818279711843e-08 & 0.999999994409086 \tabularnewline
29 & 5.79748195802338e-09 & 1.15949639160468e-08 & 0.999999994202518 \tabularnewline
30 & 3.25917723480674e-09 & 6.51835446961349e-09 & 0.999999996740823 \tabularnewline
31 & 1.02810985201841e-07 & 2.05621970403681e-07 & 0.999999897189015 \tabularnewline
32 & 1.15146406786644e-07 & 2.30292813573287e-07 & 0.999999884853593 \tabularnewline
33 & 8.6333596503733e-08 & 1.72667193007466e-07 & 0.999999913666404 \tabularnewline
34 & 3.7742201394031e-08 & 7.5484402788062e-08 & 0.999999962257799 \tabularnewline
35 & 1.54123613434915e-08 & 3.08247226869830e-08 & 0.999999984587639 \tabularnewline
36 & 6.85435007286094e-09 & 1.37087001457219e-08 & 0.99999999314565 \tabularnewline
37 & 5.25496176270613e-08 & 1.05099235254123e-07 & 0.999999947450382 \tabularnewline
38 & 2.28603290733624e-07 & 4.57206581467248e-07 & 0.99999977139671 \tabularnewline
39 & 3.96015106869575e-07 & 7.9203021373915e-07 & 0.999999603984893 \tabularnewline
40 & 2.29280955736129e-06 & 4.58561911472257e-06 & 0.999997707190443 \tabularnewline
41 & 1.07099269519224e-05 & 2.14198539038449e-05 & 0.999989290073048 \tabularnewline
42 & 4.34355453913659e-05 & 8.68710907827318e-05 & 0.99995656445461 \tabularnewline
43 & 0.000561941092659683 & 0.00112388218531937 & 0.99943805890734 \tabularnewline
44 & 0.0112211227691090 & 0.0224422455382179 & 0.98877887723089 \tabularnewline
45 & 0.0489881969526702 & 0.0979763939053405 & 0.95101180304733 \tabularnewline
46 & 0.120592083158643 & 0.241184166317286 & 0.879407916841357 \tabularnewline
47 & 0.28629463744151 & 0.57258927488302 & 0.71370536255849 \tabularnewline
48 & 0.488876276995072 & 0.977752553990143 & 0.511123723004928 \tabularnewline
49 & 0.750841758424806 & 0.498316483150389 & 0.249158241575194 \tabularnewline
50 & 0.844685789593943 & 0.310628420812115 & 0.155314210406057 \tabularnewline
51 & 0.86772062180286 & 0.264558756394279 & 0.132279378197139 \tabularnewline
52 & 0.88142713799627 & 0.237145724007461 & 0.118572862003730 \tabularnewline
53 & 0.807249471021032 & 0.385501057957936 & 0.192750528978968 \tabularnewline
54 & 0.774366729879871 & 0.451266540240259 & 0.225633270120129 \tabularnewline
55 & 0.663785585996179 & 0.672428828007642 & 0.336214414003821 \tabularnewline
\hline
\end{tabular}
%Source: https://freestatistics.org/blog/index.php?pk=29319&T=5

[TABLE]
[ROW][C]Goldfeld-Quandt test for Heteroskedasticity[/C][/ROW]
[ROW][C]p-values[/C][C]Alternative Hypothesis[/C][/ROW]
[ROW][C]breakpoint index[/C][C]greater[/C][C]2-sided[/C][C]less[/C][/ROW]
[ROW][C]17[/C][C]0.000928152205296276[/C][C]0.00185630441059255[/C][C]0.999071847794704[/C][/ROW]
[ROW][C]18[/C][C]0.000309247113416212[/C][C]0.000618494226832425[/C][C]0.999690752886584[/C][/ROW]
[ROW][C]19[/C][C]3.23567820170955e-05[/C][C]6.47135640341909e-05[/C][C]0.999967643217983[/C][/ROW]
[ROW][C]20[/C][C]2.63287329633982e-05[/C][C]5.26574659267964e-05[/C][C]0.999973671267037[/C][/ROW]
[ROW][C]21[/C][C]1.11294142787016e-05[/C][C]2.22588285574032e-05[/C][C]0.999988870585721[/C][/ROW]
[ROW][C]22[/C][C]1.87000273854808e-06[/C][C]3.74000547709617e-06[/C][C]0.999998129997261[/C][/ROW]
[ROW][C]23[/C][C]1.13387395547069e-06[/C][C]2.26774791094139e-06[/C][C]0.999998866126045[/C][/ROW]
[ROW][C]24[/C][C]2.52555021935058e-07[/C][C]5.05110043870116e-07[/C][C]0.999999747444978[/C][/ROW]
[ROW][C]25[/C][C]7.58710922260604e-08[/C][C]1.51742184452121e-07[/C][C]0.999999924128908[/C][/ROW]
[ROW][C]26[/C][C]1.99854627580138e-08[/C][C]3.99709255160276e-08[/C][C]0.999999980014537[/C][/ROW]
[ROW][C]27[/C][C]5.17699671165076e-09[/C][C]1.03539934233015e-08[/C][C]0.999999994823003[/C][/ROW]
[ROW][C]28[/C][C]5.59091398559214e-09[/C][C]1.11818279711843e-08[/C][C]0.999999994409086[/C][/ROW]
[ROW][C]29[/C][C]5.79748195802338e-09[/C][C]1.15949639160468e-08[/C][C]0.999999994202518[/C][/ROW]
[ROW][C]30[/C][C]3.25917723480674e-09[/C][C]6.51835446961349e-09[/C][C]0.999999996740823[/C][/ROW]
[ROW][C]31[/C][C]1.02810985201841e-07[/C][C]2.05621970403681e-07[/C][C]0.999999897189015[/C][/ROW]
[ROW][C]32[/C][C]1.15146406786644e-07[/C][C]2.30292813573287e-07[/C][C]0.999999884853593[/C][/ROW]
[ROW][C]33[/C][C]8.6333596503733e-08[/C][C]1.72667193007466e-07[/C][C]0.999999913666404[/C][/ROW]
[ROW][C]34[/C][C]3.7742201394031e-08[/C][C]7.5484402788062e-08[/C][C]0.999999962257799[/C][/ROW]
[ROW][C]35[/C][C]1.54123613434915e-08[/C][C]3.08247226869830e-08[/C][C]0.999999984587639[/C][/ROW]
[ROW][C]36[/C][C]6.85435007286094e-09[/C][C]1.37087001457219e-08[/C][C]0.99999999314565[/C][/ROW]
[ROW][C]37[/C][C]5.25496176270613e-08[/C][C]1.05099235254123e-07[/C][C]0.999999947450382[/C][/ROW]
[ROW][C]38[/C][C]2.28603290733624e-07[/C][C]4.57206581467248e-07[/C][C]0.99999977139671[/C][/ROW]
[ROW][C]39[/C][C]3.96015106869575e-07[/C][C]7.9203021373915e-07[/C][C]0.999999603984893[/C][/ROW]
[ROW][C]40[/C][C]2.29280955736129e-06[/C][C]4.58561911472257e-06[/C][C]0.999997707190443[/C][/ROW]
[ROW][C]41[/C][C]1.07099269519224e-05[/C][C]2.14198539038449e-05[/C][C]0.999989290073048[/C][/ROW]
[ROW][C]42[/C][C]4.34355453913659e-05[/C][C]8.68710907827318e-05[/C][C]0.99995656445461[/C][/ROW]
[ROW][C]43[/C][C]0.000561941092659683[/C][C]0.00112388218531937[/C][C]0.99943805890734[/C][/ROW]
[ROW][C]44[/C][C]0.0112211227691090[/C][C]0.0224422455382179[/C][C]0.98877887723089[/C][/ROW]
[ROW][C]45[/C][C]0.0489881969526702[/C][C]0.0979763939053405[/C][C]0.95101180304733[/C][/ROW]
[ROW][C]46[/C][C]0.120592083158643[/C][C]0.241184166317286[/C][C]0.879407916841357[/C][/ROW]
[ROW][C]47[/C][C]0.28629463744151[/C][C]0.57258927488302[/C][C]0.71370536255849[/C][/ROW]
[ROW][C]48[/C][C]0.488876276995072[/C][C]0.977752553990143[/C][C]0.511123723004928[/C][/ROW]
[ROW][C]49[/C][C]0.750841758424806[/C][C]0.498316483150389[/C][C]0.249158241575194[/C][/ROW]
[ROW][C]50[/C][C]0.844685789593943[/C][C]0.310628420812115[/C][C]0.155314210406057[/C][/ROW]
[ROW][C]51[/C][C]0.86772062180286[/C][C]0.264558756394279[/C][C]0.132279378197139[/C][/ROW]
[ROW][C]52[/C][C]0.88142713799627[/C][C]0.237145724007461[/C][C]0.118572862003730[/C][/ROW]
[ROW][C]53[/C][C]0.807249471021032[/C][C]0.385501057957936[/C][C]0.192750528978968[/C][/ROW]
[ROW][C]54[/C][C]0.774366729879871[/C][C]0.451266540240259[/C][C]0.225633270120129[/C][/ROW]
[ROW][C]55[/C][C]0.663785585996179[/C][C]0.672428828007642[/C][C]0.336214414003821[/C][/ROW]
[/TABLE]
Source: https://freestatistics.org/blog/index.php?pk=29319&T=5

Globally Unique Identifier (entire table): ba.freestatistics.org/blog/index.php?pk=29319&T=5

As an alternative you can also use a QR Code:  

The GUIDs for individual cells are displayed in the table below:

Goldfeld-Quandt test for Heteroskedasticity
p-valuesAlternative Hypothesis
breakpoint indexgreater2-sidedless
170.0009281522052962760.001856304410592550.999071847794704
180.0003092471134162120.0006184942268324250.999690752886584
193.23567820170955e-056.47135640341909e-050.999967643217983
202.63287329633982e-055.26574659267964e-050.999973671267037
211.11294142787016e-052.22588285574032e-050.999988870585721
221.87000273854808e-063.74000547709617e-060.999998129997261
231.13387395547069e-062.26774791094139e-060.999998866126045
242.52555021935058e-075.05110043870116e-070.999999747444978
257.58710922260604e-081.51742184452121e-070.999999924128908
261.99854627580138e-083.99709255160276e-080.999999980014537
275.17699671165076e-091.03539934233015e-080.999999994823003
285.59091398559214e-091.11818279711843e-080.999999994409086
295.79748195802338e-091.15949639160468e-080.999999994202518
303.25917723480674e-096.51835446961349e-090.999999996740823
311.02810985201841e-072.05621970403681e-070.999999897189015
321.15146406786644e-072.30292813573287e-070.999999884853593
338.6333596503733e-081.72667193007466e-070.999999913666404
343.7742201394031e-087.5484402788062e-080.999999962257799
351.54123613434915e-083.08247226869830e-080.999999984587639
366.85435007286094e-091.37087001457219e-080.99999999314565
375.25496176270613e-081.05099235254123e-070.999999947450382
382.28603290733624e-074.57206581467248e-070.99999977139671
393.96015106869575e-077.9203021373915e-070.999999603984893
402.29280955736129e-064.58561911472257e-060.999997707190443
411.07099269519224e-052.14198539038449e-050.999989290073048
424.34355453913659e-058.68710907827318e-050.99995656445461
430.0005619410926596830.001123882185319370.99943805890734
440.01122112276910900.02244224553821790.98877887723089
450.04898819695267020.09797639390534050.95101180304733
460.1205920831586430.2411841663172860.879407916841357
470.286294637441510.572589274883020.71370536255849
480.4888762769950720.9777525539901430.511123723004928
490.7508417584248060.4983164831503890.249158241575194
500.8446857895939430.3106284208121150.155314210406057
510.867720621802860.2645587563942790.132279378197139
520.881427137996270.2371457240074610.118572862003730
530.8072494710210320.3855010579579360.192750528978968
540.7743667298798710.4512665402402590.225633270120129
550.6637855859961790.6724288280076420.336214414003821


Meta Analysis of Goldfeld-Quandt test for Heteroskedasticity
Description# significant tests% significant testsOK/NOK
1% type I error level270.692307692307692NOK
5% type I error level280.717948717948718NOK
10% type I error level290.743589743589744NOK

\begin{tabular}{lllllllll}
\hline
Meta Analysis of Goldfeld-Quandt test for Heteroskedasticity \tabularnewline
Description & # significant tests & % significant tests & OK/NOK \tabularnewline
1% type I error level & 27 & 0.692307692307692 & NOK \tabularnewline
5% type I error level & 28 & 0.717948717948718 & NOK \tabularnewline
10% type I error level & 29 & 0.743589743589744 & NOK \tabularnewline
\hline
\end{tabular}
%Source: https://freestatistics.org/blog/index.php?pk=29319&T=6

[TABLE]
[ROW][C]Meta Analysis of Goldfeld-Quandt test for Heteroskedasticity[/C][/ROW]
[ROW][C]Description[/C][C]# significant tests[/C][C]% significant tests[/C][C]OK/NOK[/C][/ROW]
[ROW][C]1% type I error level[/C][C]27[/C][C]0.692307692307692[/C][C]NOK[/C][/ROW]
[ROW][C]5% type I error level[/C][C]28[/C][C]0.717948717948718[/C][C]NOK[/C][/ROW]
[ROW][C]10% type I error level[/C][C]29[/C][C]0.743589743589744[/C][C]NOK[/C][/ROW]
[/TABLE]
Source: https://freestatistics.org/blog/index.php?pk=29319&T=6

Globally Unique Identifier (entire table): ba.freestatistics.org/blog/index.php?pk=29319&T=6

As an alternative you can also use a QR Code:  

The GUIDs for individual cells are displayed in the table below:

Meta Analysis of Goldfeld-Quandt test for Heteroskedasticity
Description# significant tests% significant testsOK/NOK
1% type I error level270.692307692307692NOK
5% type I error level280.717948717948718NOK
10% type I error level290.743589743589744NOK


Parameters (Session):
par1 = 1 ; par2 = Include Monthly Dummies ; par3 = Linear Trend ;
Parameters (R input):
par1 = 1 ; par2 = Include Monthly Dummies ; par3 = Linear Trend ;
R code (references can be found in the software module):
library(lattice)
library(lmtest)
n25 <- 25 #minimum number of obs. for Goldfeld-Quandt test
par1 <- as.numeric(par1)
x <- t(y)
k <- length(x[1,])
n <- length(x[,1])
x1 <- cbind(x[,par1], x[,1:k!=par1])
mycolnames <- c(colnames(x)[par1], colnames(x)[1:k!=par1])
colnames(x1) <- mycolnames #colnames(x)[par1]
x <- x1
if (par3 == 'First Differences'){
x2 <- array(0, dim=c(n-1,k), dimnames=list(1:(n-1), paste('(1-B)',colnames(x),sep='')))
for (i in 1:n-1) {
for (j in 1:k) {
x2[i,j] <- x[i+1,j] - x[i,j]
}
}
x <- x2
}
if (par2 == 'Include Monthly Dummies'){
x2 <- array(0, dim=c(n,11), dimnames=list(1:n, paste('M', seq(1:11), sep ='')))
for (i in 1:11){
x2[seq(i,n,12),i] <- 1
}
x <- cbind(x, x2)
}
if (par2 == 'Include Quarterly Dummies'){
x2 <- array(0, dim=c(n,3), dimnames=list(1:n, paste('Q', seq(1:3), sep ='')))
for (i in 1:3){
x2[seq(i,n,4),i] <- 1
}
x <- cbind(x, x2)
}
k <- length(x[1,])
if (par3 == 'Linear Trend'){
x <- cbind(x, c(1:n))
colnames(x)[k+1] <- 't'
}
x
k <- length(x[1,])
df <- as.data.frame(x)
(mylm <- lm(df))
(mysum <- summary(mylm))
if (n > n25) {
kp3 <- k + 3
nmkm3 <- n - k - 3
gqarr <- array(NA, dim=c(nmkm3-kp3+1,3))
numgqtests <- 0
numsignificant1 <- 0
numsignificant5 <- 0
numsignificant10 <- 0
for (mypoint in kp3:nmkm3) {
j <- 0
numgqtests <- numgqtests + 1
for (myalt in c('greater', 'two.sided', 'less')) {
j <- j + 1
gqarr[mypoint-kp3+1,j] <- gqtest(mylm, point=mypoint, alternative=myalt)$p.value
}
if (gqarr[mypoint-kp3+1,2] < 0.01) numsignificant1 <- numsignificant1 + 1
if (gqarr[mypoint-kp3+1,2] < 0.05) numsignificant5 <- numsignificant5 + 1
if (gqarr[mypoint-kp3+1,2] < 0.10) numsignificant10 <- numsignificant10 + 1
}
gqarr
}
bitmap(file='test0.png')
plot(x[,1], type='l', main='Actuals and Interpolation', ylab='value of Actuals and Interpolation (dots)', xlab='time or index')
points(x[,1]-mysum$resid)
grid()
dev.off()
bitmap(file='test1.png')
plot(mysum$resid, type='b', pch=19, main='Residuals', ylab='value of Residuals', xlab='time or index')
grid()
dev.off()
bitmap(file='test2.png')
hist(mysum$resid, main='Residual Histogram', xlab='values of Residuals')
grid()
dev.off()
bitmap(file='test3.png')
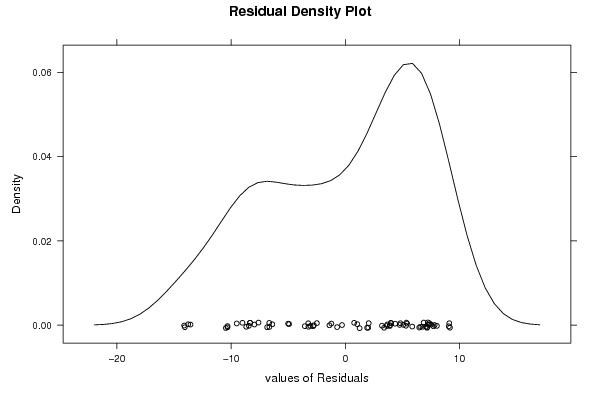
densityplot(~mysum$resid,col='black',main='Residual Density Plot', xlab='values of Residuals')
dev.off()
bitmap(file='test4.png')
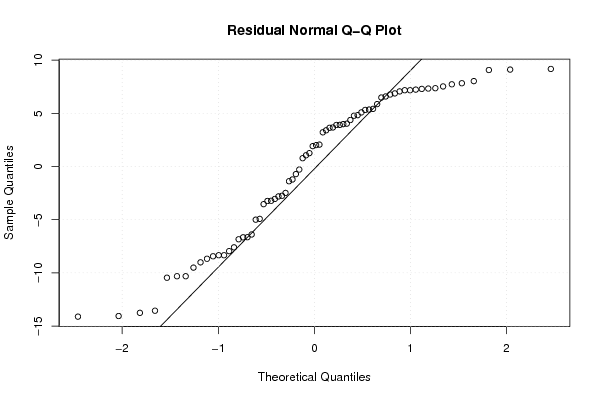
qqnorm(mysum$resid, main='Residual Normal Q-Q Plot')
qqline(mysum$resid)
grid()
dev.off()
(myerror <- as.ts(mysum$resid))
bitmap(file='test5.png')
dum <- cbind(lag(myerror,k=1),myerror)
dum
dum1 <- dum[2:length(myerror),]
dum1
z <- as.data.frame(dum1)
z
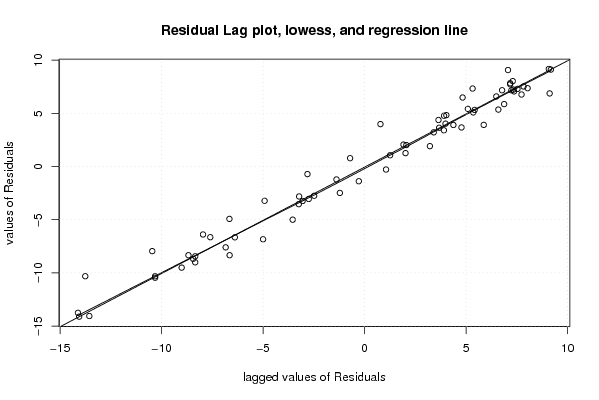
plot(z,main=paste('Residual Lag plot, lowess, and regression line'), ylab='values of Residuals', xlab='lagged values of Residuals')
lines(lowess(z))
abline(lm(z))
grid()
dev.off()
bitmap(file='test6.png')
acf(mysum$resid, lag.max=length(mysum$resid)/2, main='Residual Autocorrelation Function')
grid()
dev.off()
bitmap(file='test7.png')
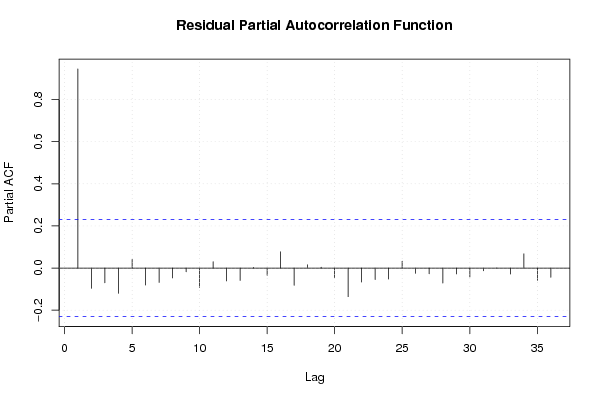
pacf(mysum$resid, lag.max=length(mysum$resid)/2, main='Residual Partial Autocorrelation Function')
grid()
dev.off()
bitmap(file='test8.png')
opar <- par(mfrow = c(2,2), oma = c(0, 0, 1.1, 0))
plot(mylm, las = 1, sub='Residual Diagnostics')
par(opar)
dev.off()
if (n > n25) {
bitmap(file='test9.png')
plot(kp3:nmkm3,gqarr[,2], main='Goldfeld-Quandt test',ylab='2-sided p-value',xlab='breakpoint')
grid()
dev.off()
}
load(file='createtable')
a<-table.start()
a<-table.row.start(a)
a<-table.element(a, 'Multiple Linear Regression - Estimated Regression Equation', 1, TRUE)
a<-table.row.end(a)
myeq <- colnames(x)[1]
myeq <- paste(myeq, '[t] = ', sep='')
for (i in 1:k){
if (mysum$coefficients[i,1] > 0) myeq <- paste(myeq, '+', '')
myeq <- paste(myeq, mysum$coefficients[i,1], sep=' ')
if (rownames(mysum$coefficients)[i] != '(Intercept)') {
myeq <- paste(myeq, rownames(mysum$coefficients)[i], sep='')
if (rownames(mysum$coefficients)[i] != 't') myeq <- paste(myeq, '[t]', sep='')
}
}
myeq <- paste(myeq, ' + e[t]')
a<-table.row.start(a)
a<-table.element(a, myeq)
a<-table.row.end(a)
a<-table.end(a)
table.save(a,file='mytable1.tab')
a<-table.start()
a<-table.row.start(a)
a<-table.element(a,hyperlink('ols1.htm','Multiple Linear Regression - Ordinary Least Squares',''), 6, TRUE)
a<-table.row.end(a)
a<-table.row.start(a)
a<-table.element(a,'Variable',header=TRUE)
a<-table.element(a,'Parameter',header=TRUE)
a<-table.element(a,'S.D.',header=TRUE)
a<-table.element(a,'T-STAT
H0: parameter = 0',header=TRUE)
a<-table.element(a,'2-tail p-value',header=TRUE)
a<-table.element(a,'1-tail p-value',header=TRUE)
a<-table.row.end(a)
for (i in 1:k){
a<-table.row.start(a)
a<-table.element(a,rownames(mysum$coefficients)[i],header=TRUE)
a<-table.element(a,mysum$coefficients[i,1])
a<-table.element(a, round(mysum$coefficients[i,2],6))
a<-table.element(a, round(mysum$coefficients[i,3],4))
a<-table.element(a, round(mysum$coefficients[i,4],6))
a<-table.element(a, round(mysum$coefficients[i,4]/2,6))
a<-table.row.end(a)
}
a<-table.end(a)
table.save(a,file='mytable2.tab')
a<-table.start()
a<-table.row.start(a)
a<-table.element(a, 'Multiple Linear Regression - Regression Statistics', 2, TRUE)
a<-table.row.end(a)
a<-table.row.start(a)
a<-table.element(a, 'Multiple R',1,TRUE)
a<-table.element(a, sqrt(mysum$r.squared))
a<-table.row.end(a)
a<-table.row.start(a)
a<-table.element(a, 'R-squared',1,TRUE)
a<-table.element(a, mysum$r.squared)
a<-table.row.end(a)
a<-table.row.start(a)
a<-table.element(a, 'Adjusted R-squared',1,TRUE)
a<-table.element(a, mysum$adj.r.squared)
a<-table.row.end(a)
a<-table.row.start(a)
a<-table.element(a, 'F-TEST (value)',1,TRUE)
a<-table.element(a, mysum$fstatistic[1])
a<-table.row.end(a)
a<-table.row.start(a)
a<-table.element(a, 'F-TEST (DF numerator)',1,TRUE)
a<-table.element(a, mysum$fstatistic[2])
a<-table.row.end(a)
a<-table.row.start(a)
a<-table.element(a, 'F-TEST (DF denominator)',1,TRUE)
a<-table.element(a, mysum$fstatistic[3])
a<-table.row.end(a)
a<-table.row.start(a)
a<-table.element(a, 'p-value',1,TRUE)
a<-table.element(a, 1-pf(mysum$fstatistic[1],mysum$fstatistic[2],mysum$fstatistic[3]))
a<-table.row.end(a)
a<-table.row.start(a)
a<-table.element(a, 'Multiple Linear Regression - Residual Statistics', 2, TRUE)
a<-table.row.end(a)
a<-table.row.start(a)
a<-table.element(a, 'Residual Standard Deviation',1,TRUE)
a<-table.element(a, mysum$sigma)
a<-table.row.end(a)
a<-table.row.start(a)
a<-table.element(a, 'Sum Squared Residuals',1,TRUE)
a<-table.element(a, sum(myerror*myerror))
a<-table.row.end(a)
a<-table.end(a)
table.save(a,file='mytable3.tab')
a<-table.start()
a<-table.row.start(a)
a<-table.element(a, 'Multiple Linear Regression - Actuals, Interpolation, and Residuals', 4, TRUE)
a<-table.row.end(a)
a<-table.row.start(a)
a<-table.element(a, 'Time or Index', 1, TRUE)
a<-table.element(a, 'Actuals', 1, TRUE)
a<-table.element(a, 'Interpolation
Forecast', 1, TRUE)
a<-table.element(a, 'Residuals
Prediction Error', 1, TRUE)
a<-table.row.end(a)
for (i in 1:n) {
a<-table.row.start(a)
a<-table.element(a,i, 1, TRUE)
a<-table.element(a,x[i])
a<-table.element(a,x[i]-mysum$resid[i])
a<-table.element(a,mysum$resid[i])
a<-table.row.end(a)
}
a<-table.end(a)
table.save(a,file='mytable4.tab')
if (n > n25) {
a<-table.start()
a<-table.row.start(a)
a<-table.element(a,'Goldfeld-Quandt test for Heteroskedasticity',4,TRUE)
a<-table.row.end(a)
a<-table.row.start(a)
a<-table.element(a,'p-values',header=TRUE)
a<-table.element(a,'Alternative Hypothesis',3,header=TRUE)
a<-table.row.end(a)
a<-table.row.start(a)
a<-table.element(a,'breakpoint index',header=TRUE)
a<-table.element(a,'greater',header=TRUE)
a<-table.element(a,'2-sided',header=TRUE)
a<-table.element(a,'less',header=TRUE)
a<-table.row.end(a)
for (mypoint in kp3:nmkm3) {
a<-table.row.start(a)
a<-table.element(a,mypoint,header=TRUE)
a<-table.element(a,gqarr[mypoint-kp3+1,1])
a<-table.element(a,gqarr[mypoint-kp3+1,2])
a<-table.element(a,gqarr[mypoint-kp3+1,3])
a<-table.row.end(a)
}
a<-table.end(a)
table.save(a,file='mytable5.tab')
a<-table.start()
a<-table.row.start(a)
a<-table.element(a,'Meta Analysis of Goldfeld-Quandt test for Heteroskedasticity',4,TRUE)
a<-table.row.end(a)
a<-table.row.start(a)
a<-table.element(a,'Description',header=TRUE)
a<-table.element(a,'# significant tests',header=TRUE)
a<-table.element(a,'% significant tests',header=TRUE)
a<-table.element(a,'OK/NOK',header=TRUE)
a<-table.row.end(a)
a<-table.row.start(a)
a<-table.element(a,'1% type I error level',header=TRUE)
a<-table.element(a,numsignificant1)
a<-table.element(a,numsignificant1/numgqtests)
if (numsignificant1/numgqtests < 0.01) dum <- 'OK' else dum <- 'NOK'
a<-table.element(a,dum)
a<-table.row.end(a)
a<-table.row.start(a)
a<-table.element(a,'5% type I error level',header=TRUE)
a<-table.element(a,numsignificant5)
a<-table.element(a,numsignificant5/numgqtests)
if (numsignificant5/numgqtests < 0.05) dum <- 'OK' else dum <- 'NOK'
a<-table.element(a,dum)
a<-table.row.end(a)
a<-table.row.start(a)
a<-table.element(a,'10% type I error level',header=TRUE)
a<-table.element(a,numsignificant10)
a<-table.element(a,numsignificant10/numgqtests)
if (numsignificant10/numgqtests < 0.1) dum <- 'OK' else dum <- 'NOK'
a<-table.element(a,dum)
a<-table.row.end(a)
a<-table.end(a)
table.save(a,file='mytable6.tab')
}