Free Statistics

of Irreproducible Research!

Author's title

Author*The author of this computation has been verified*
R Software Modulerwasp_multipleregression.wasp
Title produced by softwareMultiple Regression
Date of computationFri, 05 Dec 2008 08:23:42 -0700
Cite this page as followsStatistical Computations at FreeStatistics.org, Office for Research Development and Education, URL https://freestatistics.org/blog/index.php?v=date/2008/Dec/05/t1228490703jv7j5b4rr1elcx2.htm/, Retrieved Thu, 16 May 2024 11:51:06 +0000
Statistical Computations at FreeStatistics.org, Office for Research Development and Education, URL https://freestatistics.org/blog/index.php?pk=29316, Retrieved Thu, 16 May 2024 11:51:06 +0000
QR Codes:

Original text written by user:
IsPrivate?No (this computation is public)
User-defined keywords
Estimated Impact168
Family? (F = Feedback message, R = changed R code, M = changed R Module, P = changed Parameters, D = changed Data)
-       [Multiple Regression] [Paper - Regressio...] [2008-12-05 15:23:42] [4127a50d3937d4bda99dae34ed7ecdc5] [Current]
Feedback Forum

Post a new message
Dataseries X:
95.2	0
95.00	0
94.00	0
92.2	0
91.00	0
91.2	0
103.4	1
105.00	0
104.6	0
103.8	0
101.8	0
102.4	0
103.8	0
103.4	0
102.00	0
101.8	0
100.2	0
101.4	0
113.8	0
116.00	0
115.6	0
113.00	0
109.4	0
111.00	0
112.4	0
112.2	0
111.00	0
108.8	0
107.4	0
108.6	0
118.8	0
122.2	1
122.6	0
122.2	0
118.8	0
119.00	0
118.2	0
117.8	0
116.8	0
114.6	0
113.4	0
113.8	0
124.2	0
125.8	0
125.6	0
122.4	0
119.00	0
119.4	0
118.6	0
118.00	0
116.00	0
114.8	0
114.6	0
114.6	0
124.00	0
125.2	0
124.00	0
117.6	1
113.2	0
111.4	0
112.2	0
109.8	0
106.4	0
105.2	0
102.2	0
99.8	0
111.00	0
113.00	0
108.4	0
105.4	0
102.00	0
102.8	0


Summary of computational transaction
Raw Inputview raw input (R code)
Raw Outputview raw output of R engine
Computing time6 seconds
R Server'Sir Ronald Aylmer Fisher' @ 193.190.124.24

\begin{tabular}{lllllllll}
\hline
Summary of computational transaction \tabularnewline
Raw Input & view raw input (R code)  \tabularnewline
Raw Output & view raw output of R engine  \tabularnewline
Computing time & 6 seconds \tabularnewline
R Server & 'Sir Ronald Aylmer Fisher' @ 193.190.124.24 \tabularnewline
\hline
\end{tabular}
%Source: https://freestatistics.org/blog/index.php?pk=29316&T=0

[TABLE]
[ROW][C]Summary of computational transaction[/C][/ROW]
[ROW][C]Raw Input[/C][C]view raw input (R code) [/C][/ROW]
[ROW][C]Raw Output[/C][C]view raw output of R engine [/C][/ROW]
[ROW][C]Computing time[/C][C]6 seconds[/C][/ROW]
[ROW][C]R Server[/C][C]'Sir Ronald Aylmer Fisher' @ 193.190.124.24[/C][/ROW]
[/TABLE]
Source: https://freestatistics.org/blog/index.php?pk=29316&T=0

Globally Unique Identifier (entire table): ba.freestatistics.org/blog/index.php?pk=29316&T=0

As an alternative you can also use a QR Code:  

The GUIDs for individual cells are displayed in the table below:

Summary of computational transaction
Raw Inputview raw input (R code)
Raw Outputview raw output of R engine
Computing time6 seconds
R Server'Sir Ronald Aylmer Fisher' @ 193.190.124.24


Multiple Linear Regression - Estimated Regression Equation
Werkloosheid[t] = + 111 -1.84000000000000Dumivariabele[t] -0.933333333333302M1[t] -1.63333333333334M2[t] -3.30000000000001M3[t] -4.76666666666668M4[t] -6.20000000000001M5[t] -6.10000000000001M6[t] + 5.17333333333332M7[t] + 7.17333333333332M8[t] + 5.79999999999999M9[t] + 3.37333333333332M10[t] -0.300000000000011M11[t] + e[t]

\begin{tabular}{lllllllll}
\hline
Multiple Linear Regression - Estimated Regression Equation \tabularnewline
Werkloosheid[t] =  +  111 -1.84000000000000Dumivariabele[t] -0.933333333333302M1[t] -1.63333333333334M2[t] -3.30000000000001M3[t] -4.76666666666668M4[t] -6.20000000000001M5[t] -6.10000000000001M6[t] +  5.17333333333332M7[t] +  7.17333333333332M8[t] +  5.79999999999999M9[t] +  3.37333333333332M10[t] -0.300000000000011M11[t]  + e[t] \tabularnewline
\hline
\end{tabular}
%Source: https://freestatistics.org/blog/index.php?pk=29316&T=1

[TABLE]
[ROW][C]Multiple Linear Regression - Estimated Regression Equation[/C][/ROW]
[ROW][C]Werkloosheid[t] =  +  111 -1.84000000000000Dumivariabele[t] -0.933333333333302M1[t] -1.63333333333334M2[t] -3.30000000000001M3[t] -4.76666666666668M4[t] -6.20000000000001M5[t] -6.10000000000001M6[t] +  5.17333333333332M7[t] +  7.17333333333332M8[t] +  5.79999999999999M9[t] +  3.37333333333332M10[t] -0.300000000000011M11[t]  + e[t][/C][/ROW]
[/TABLE]
Source: https://freestatistics.org/blog/index.php?pk=29316&T=1

Globally Unique Identifier (entire table): ba.freestatistics.org/blog/index.php?pk=29316&T=1

As an alternative you can also use a QR Code:  

The GUIDs for individual cells are displayed in the table below:

Multiple Linear Regression - Estimated Regression Equation
Werkloosheid[t] = + 111 -1.84000000000000Dumivariabele[t] -0.933333333333302M1[t] -1.63333333333334M2[t] -3.30000000000001M3[t] -4.76666666666668M4[t] -6.20000000000001M5[t] -6.10000000000001M6[t] + 5.17333333333332M7[t] + 7.17333333333332M8[t] + 5.79999999999999M9[t] + 3.37333333333332M10[t] -0.300000000000011M11[t] + e[t]


Multiple Linear Regression - Ordinary Least Squares
VariableParameterS.D.T-STATH0: parameter = 02-tail p-value1-tail p-value
(Intercept)1113.48497831.85100
Dumivariabele-1.840000000000005.398905-0.34080.7344570.367229
M1-0.9333333333333024.928504-0.18940.8504490.425225
M2-1.633333333333344.928504-0.33140.7415120.370756
M3-3.300000000000014.928504-0.66960.5057410.252871
M4-4.766666666666684.928504-0.96720.337410.168705
M5-6.200000000000014.928504-1.2580.2133520.106676
M6-6.100000000000014.928504-1.23770.2207310.110365
M75.173333333333325.0099721.03260.3060020.153001
M87.173333333333325.0099721.43180.1574740.078737
M95.799999999999994.9285041.17680.243990.121995
M103.373333333333325.0099720.67330.503370.251685
M11-0.3000000000000114.928504-0.06090.9516680.475834

\begin{tabular}{lllllllll}
\hline
Multiple Linear Regression - Ordinary Least Squares \tabularnewline
Variable & Parameter & S.D. & T-STATH0: parameter = 0 & 2-tail p-value & 1-tail p-value \tabularnewline
(Intercept) & 111 & 3.484978 & 31.851 & 0 & 0 \tabularnewline
Dumivariabele & -1.84000000000000 & 5.398905 & -0.3408 & 0.734457 & 0.367229 \tabularnewline
M1 & -0.933333333333302 & 4.928504 & -0.1894 & 0.850449 & 0.425225 \tabularnewline
M2 & -1.63333333333334 & 4.928504 & -0.3314 & 0.741512 & 0.370756 \tabularnewline
M3 & -3.30000000000001 & 4.928504 & -0.6696 & 0.505741 & 0.252871 \tabularnewline
M4 & -4.76666666666668 & 4.928504 & -0.9672 & 0.33741 & 0.168705 \tabularnewline
M5 & -6.20000000000001 & 4.928504 & -1.258 & 0.213352 & 0.106676 \tabularnewline
M6 & -6.10000000000001 & 4.928504 & -1.2377 & 0.220731 & 0.110365 \tabularnewline
M7 & 5.17333333333332 & 5.009972 & 1.0326 & 0.306002 & 0.153001 \tabularnewline
M8 & 7.17333333333332 & 5.009972 & 1.4318 & 0.157474 & 0.078737 \tabularnewline
M9 & 5.79999999999999 & 4.928504 & 1.1768 & 0.24399 & 0.121995 \tabularnewline
M10 & 3.37333333333332 & 5.009972 & 0.6733 & 0.50337 & 0.251685 \tabularnewline
M11 & -0.300000000000011 & 4.928504 & -0.0609 & 0.951668 & 0.475834 \tabularnewline
\hline
\end{tabular}
%Source: https://freestatistics.org/blog/index.php?pk=29316&T=2

[TABLE]
[ROW][C]Multiple Linear Regression - Ordinary Least Squares[/C][/ROW]
[ROW][C]Variable[/C][C]Parameter[/C][C]S.D.[/C][C]T-STATH0: parameter = 0[/C][C]2-tail p-value[/C][C]1-tail p-value[/C][/ROW]
[ROW][C](Intercept)[/C][C]111[/C][C]3.484978[/C][C]31.851[/C][C]0[/C][C]0[/C][/ROW]
[ROW][C]Dumivariabele[/C][C]-1.84000000000000[/C][C]5.398905[/C][C]-0.3408[/C][C]0.734457[/C][C]0.367229[/C][/ROW]
[ROW][C]M1[/C][C]-0.933333333333302[/C][C]4.928504[/C][C]-0.1894[/C][C]0.850449[/C][C]0.425225[/C][/ROW]
[ROW][C]M2[/C][C]-1.63333333333334[/C][C]4.928504[/C][C]-0.3314[/C][C]0.741512[/C][C]0.370756[/C][/ROW]
[ROW][C]M3[/C][C]-3.30000000000001[/C][C]4.928504[/C][C]-0.6696[/C][C]0.505741[/C][C]0.252871[/C][/ROW]
[ROW][C]M4[/C][C]-4.76666666666668[/C][C]4.928504[/C][C]-0.9672[/C][C]0.33741[/C][C]0.168705[/C][/ROW]
[ROW][C]M5[/C][C]-6.20000000000001[/C][C]4.928504[/C][C]-1.258[/C][C]0.213352[/C][C]0.106676[/C][/ROW]
[ROW][C]M6[/C][C]-6.10000000000001[/C][C]4.928504[/C][C]-1.2377[/C][C]0.220731[/C][C]0.110365[/C][/ROW]
[ROW][C]M7[/C][C]5.17333333333332[/C][C]5.009972[/C][C]1.0326[/C][C]0.306002[/C][C]0.153001[/C][/ROW]
[ROW][C]M8[/C][C]7.17333333333332[/C][C]5.009972[/C][C]1.4318[/C][C]0.157474[/C][C]0.078737[/C][/ROW]
[ROW][C]M9[/C][C]5.79999999999999[/C][C]4.928504[/C][C]1.1768[/C][C]0.24399[/C][C]0.121995[/C][/ROW]
[ROW][C]M10[/C][C]3.37333333333332[/C][C]5.009972[/C][C]0.6733[/C][C]0.50337[/C][C]0.251685[/C][/ROW]
[ROW][C]M11[/C][C]-0.300000000000011[/C][C]4.928504[/C][C]-0.0609[/C][C]0.951668[/C][C]0.475834[/C][/ROW]
[/TABLE]
Source: https://freestatistics.org/blog/index.php?pk=29316&T=2

Globally Unique Identifier (entire table): ba.freestatistics.org/blog/index.php?pk=29316&T=2

As an alternative you can also use a QR Code:  

The GUIDs for individual cells are displayed in the table below:

Multiple Linear Regression - Ordinary Least Squares
VariableParameterS.D.T-STATH0: parameter = 02-tail p-value1-tail p-value
(Intercept)1113.48497831.85100
Dumivariabele-1.840000000000005.398905-0.34080.7344570.367229
M1-0.9333333333333024.928504-0.18940.8504490.425225
M2-1.633333333333344.928504-0.33140.7415120.370756
M3-3.300000000000014.928504-0.66960.5057410.252871
M4-4.766666666666684.928504-0.96720.337410.168705
M5-6.200000000000014.928504-1.2580.2133520.106676
M6-6.100000000000014.928504-1.23770.2207310.110365
M75.173333333333325.0099721.03260.3060020.153001
M87.173333333333325.0099721.43180.1574740.078737
M95.799999999999994.9285041.17680.243990.121995
M103.373333333333325.0099720.67330.503370.251685
M11-0.3000000000000114.928504-0.06090.9516680.475834


Multiple Linear Regression - Regression Statistics
Multiple R0.490981929489039
R-squared0.24106325508478
Adjusted R-squared0.08670323916982
F-TEST (value)1.56169493541376
F-TEST (DF numerator)12
F-TEST (DF denominator)59
p-value0.128496057516813
Multiple Linear Regression - Residual Statistics
Residual Standard Deviation8.53641849243381
Sum Squared Residuals4299.35599999999

\begin{tabular}{lllllllll}
\hline
Multiple Linear Regression - Regression Statistics \tabularnewline
Multiple R & 0.490981929489039 \tabularnewline
R-squared & 0.24106325508478 \tabularnewline
Adjusted R-squared & 0.08670323916982 \tabularnewline
F-TEST (value) & 1.56169493541376 \tabularnewline
F-TEST (DF numerator) & 12 \tabularnewline
F-TEST (DF denominator) & 59 \tabularnewline
p-value & 0.128496057516813 \tabularnewline
Multiple Linear Regression - Residual Statistics \tabularnewline
Residual Standard Deviation & 8.53641849243381 \tabularnewline
Sum Squared Residuals & 4299.35599999999 \tabularnewline
\hline
\end{tabular}
%Source: https://freestatistics.org/blog/index.php?pk=29316&T=3

[TABLE]
[ROW][C]Multiple Linear Regression - Regression Statistics[/C][/ROW]
[ROW][C]Multiple R[/C][C]0.490981929489039[/C][/ROW]
[ROW][C]R-squared[/C][C]0.24106325508478[/C][/ROW]
[ROW][C]Adjusted R-squared[/C][C]0.08670323916982[/C][/ROW]
[ROW][C]F-TEST (value)[/C][C]1.56169493541376[/C][/ROW]
[ROW][C]F-TEST (DF numerator)[/C][C]12[/C][/ROW]
[ROW][C]F-TEST (DF denominator)[/C][C]59[/C][/ROW]
[ROW][C]p-value[/C][C]0.128496057516813[/C][/ROW]
[ROW][C]Multiple Linear Regression - Residual Statistics[/C][/ROW]
[ROW][C]Residual Standard Deviation[/C][C]8.53641849243381[/C][/ROW]
[ROW][C]Sum Squared Residuals[/C][C]4299.35599999999[/C][/ROW]
[/TABLE]
Source: https://freestatistics.org/blog/index.php?pk=29316&T=3

Globally Unique Identifier (entire table): ba.freestatistics.org/blog/index.php?pk=29316&T=3

As an alternative you can also use a QR Code:  

The GUIDs for individual cells are displayed in the table below:

Multiple Linear Regression - Regression Statistics
Multiple R0.490981929489039
R-squared0.24106325508478
Adjusted R-squared0.08670323916982
F-TEST (value)1.56169493541376
F-TEST (DF numerator)12
F-TEST (DF denominator)59
p-value0.128496057516813
Multiple Linear Regression - Residual Statistics
Residual Standard Deviation8.53641849243381
Sum Squared Residuals4299.35599999999


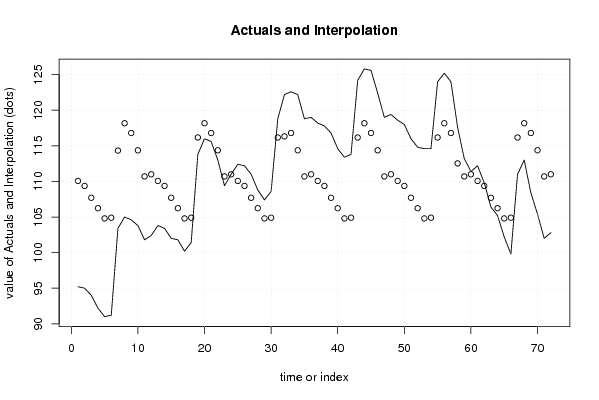
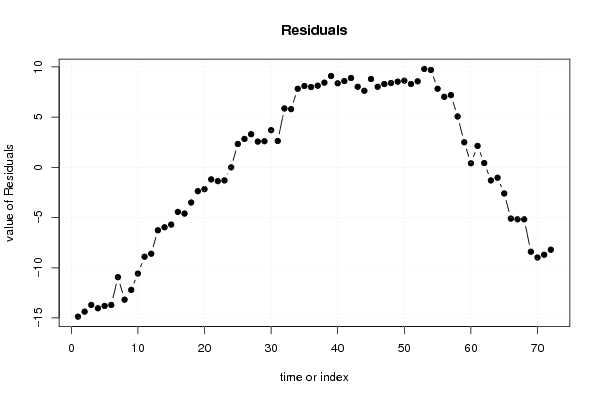
Multiple Linear Regression - Actuals, Interpolation, and Residuals
Time or IndexActualsInterpolationForecastResidualsPrediction Error
195.2110.066666666666-14.8666666666665
295109.366666666667-14.3666666666667
394107.7-13.7
492.2106.233333333333-14.0333333333333
591104.8-13.8
691.2104.9-13.7
7103.4114.333333333333-10.9333333333333
8105118.173333333333-13.1733333333333
9104.6116.8-12.2
10103.8114.373333333333-10.5733333333333
11101.8110.7-8.9
12102.4111-8.6
13103.8110.066666666667-6.26666666666671
14103.4109.366666666667-5.96666666666666
15102107.7-5.7
16101.8106.233333333333-4.43333333333334
17100.2104.8-4.6
18101.4104.9-3.49999999999999
19113.8116.173333333333-2.37333333333334
20116118.173333333333-2.17333333333333
21115.6116.8-1.2
22113114.373333333333-1.37333333333334
23109.4110.7-1.29999999999999
24111111-8.40137421437293e-15
25112.4110.0666666666672.3333333333333
26112.2109.3666666666672.83333333333334
27111107.73.3
28108.8106.2333333333332.56666666666667
29107.4104.82.60000000000000
30108.6104.93.69999999999999
31118.8116.1733333333332.62666666666666
32122.2116.3333333333335.86666666666667
33122.6116.85.8
34122.2114.3733333333337.82666666666667
35118.8110.78.1
361191117.99999999999999
37118.2110.0666666666678.1333333333333
38117.8109.3666666666678.43333333333333
39116.8107.79.1
40114.6106.2333333333338.36666666666666
41113.4104.88.6
42113.8104.98.9
43124.2116.1733333333338.02666666666667
44125.8118.1733333333337.62666666666667
45125.6116.88.8
46122.4114.3733333333338.02666666666667
47119110.78.3
48119.41118.4
49118.6110.0666666666678.53333333333329
50118109.3666666666678.63333333333333
51116107.78.3
52114.8106.2333333333338.56666666666666
53114.6104.89.8
54114.6104.99.7
55124116.1733333333337.82666666666667
56125.2118.1733333333337.02666666666667
57124116.87.2
58117.6112.5333333333335.06666666666666
59113.2110.72.5
60111.41110.399999999999996
61112.2110.0666666666672.13333333333330
62109.8109.3666666666670.433333333333331
63106.4107.7-1.29999999999999
64105.2106.233333333333-1.03333333333333
65102.2104.8-2.6
6699.8104.9-5.1
67111116.173333333333-5.17333333333333
68113118.173333333333-5.17333333333333
69108.4116.8-8.39999999999999
70105.4114.373333333333-8.97333333333333
71102110.7-8.7
72102.8111-8.20000000000001

\begin{tabular}{lllllllll}
\hline
Multiple Linear Regression - Actuals, Interpolation, and Residuals \tabularnewline
Time or Index & Actuals & InterpolationForecast & ResidualsPrediction Error \tabularnewline
1 & 95.2 & 110.066666666666 & -14.8666666666665 \tabularnewline
2 & 95 & 109.366666666667 & -14.3666666666667 \tabularnewline
3 & 94 & 107.7 & -13.7 \tabularnewline
4 & 92.2 & 106.233333333333 & -14.0333333333333 \tabularnewline
5 & 91 & 104.8 & -13.8 \tabularnewline
6 & 91.2 & 104.9 & -13.7 \tabularnewline
7 & 103.4 & 114.333333333333 & -10.9333333333333 \tabularnewline
8 & 105 & 118.173333333333 & -13.1733333333333 \tabularnewline
9 & 104.6 & 116.8 & -12.2 \tabularnewline
10 & 103.8 & 114.373333333333 & -10.5733333333333 \tabularnewline
11 & 101.8 & 110.7 & -8.9 \tabularnewline
12 & 102.4 & 111 & -8.6 \tabularnewline
13 & 103.8 & 110.066666666667 & -6.26666666666671 \tabularnewline
14 & 103.4 & 109.366666666667 & -5.96666666666666 \tabularnewline
15 & 102 & 107.7 & -5.7 \tabularnewline
16 & 101.8 & 106.233333333333 & -4.43333333333334 \tabularnewline
17 & 100.2 & 104.8 & -4.6 \tabularnewline
18 & 101.4 & 104.9 & -3.49999999999999 \tabularnewline
19 & 113.8 & 116.173333333333 & -2.37333333333334 \tabularnewline
20 & 116 & 118.173333333333 & -2.17333333333333 \tabularnewline
21 & 115.6 & 116.8 & -1.2 \tabularnewline
22 & 113 & 114.373333333333 & -1.37333333333334 \tabularnewline
23 & 109.4 & 110.7 & -1.29999999999999 \tabularnewline
24 & 111 & 111 & -8.40137421437293e-15 \tabularnewline
25 & 112.4 & 110.066666666667 & 2.3333333333333 \tabularnewline
26 & 112.2 & 109.366666666667 & 2.83333333333334 \tabularnewline
27 & 111 & 107.7 & 3.3 \tabularnewline
28 & 108.8 & 106.233333333333 & 2.56666666666667 \tabularnewline
29 & 107.4 & 104.8 & 2.60000000000000 \tabularnewline
30 & 108.6 & 104.9 & 3.69999999999999 \tabularnewline
31 & 118.8 & 116.173333333333 & 2.62666666666666 \tabularnewline
32 & 122.2 & 116.333333333333 & 5.86666666666667 \tabularnewline
33 & 122.6 & 116.8 & 5.8 \tabularnewline
34 & 122.2 & 114.373333333333 & 7.82666666666667 \tabularnewline
35 & 118.8 & 110.7 & 8.1 \tabularnewline
36 & 119 & 111 & 7.99999999999999 \tabularnewline
37 & 118.2 & 110.066666666667 & 8.1333333333333 \tabularnewline
38 & 117.8 & 109.366666666667 & 8.43333333333333 \tabularnewline
39 & 116.8 & 107.7 & 9.1 \tabularnewline
40 & 114.6 & 106.233333333333 & 8.36666666666666 \tabularnewline
41 & 113.4 & 104.8 & 8.6 \tabularnewline
42 & 113.8 & 104.9 & 8.9 \tabularnewline
43 & 124.2 & 116.173333333333 & 8.02666666666667 \tabularnewline
44 & 125.8 & 118.173333333333 & 7.62666666666667 \tabularnewline
45 & 125.6 & 116.8 & 8.8 \tabularnewline
46 & 122.4 & 114.373333333333 & 8.02666666666667 \tabularnewline
47 & 119 & 110.7 & 8.3 \tabularnewline
48 & 119.4 & 111 & 8.4 \tabularnewline
49 & 118.6 & 110.066666666667 & 8.53333333333329 \tabularnewline
50 & 118 & 109.366666666667 & 8.63333333333333 \tabularnewline
51 & 116 & 107.7 & 8.3 \tabularnewline
52 & 114.8 & 106.233333333333 & 8.56666666666666 \tabularnewline
53 & 114.6 & 104.8 & 9.8 \tabularnewline
54 & 114.6 & 104.9 & 9.7 \tabularnewline
55 & 124 & 116.173333333333 & 7.82666666666667 \tabularnewline
56 & 125.2 & 118.173333333333 & 7.02666666666667 \tabularnewline
57 & 124 & 116.8 & 7.2 \tabularnewline
58 & 117.6 & 112.533333333333 & 5.06666666666666 \tabularnewline
59 & 113.2 & 110.7 & 2.5 \tabularnewline
60 & 111.4 & 111 & 0.399999999999996 \tabularnewline
61 & 112.2 & 110.066666666667 & 2.13333333333330 \tabularnewline
62 & 109.8 & 109.366666666667 & 0.433333333333331 \tabularnewline
63 & 106.4 & 107.7 & -1.29999999999999 \tabularnewline
64 & 105.2 & 106.233333333333 & -1.03333333333333 \tabularnewline
65 & 102.2 & 104.8 & -2.6 \tabularnewline
66 & 99.8 & 104.9 & -5.1 \tabularnewline
67 & 111 & 116.173333333333 & -5.17333333333333 \tabularnewline
68 & 113 & 118.173333333333 & -5.17333333333333 \tabularnewline
69 & 108.4 & 116.8 & -8.39999999999999 \tabularnewline
70 & 105.4 & 114.373333333333 & -8.97333333333333 \tabularnewline
71 & 102 & 110.7 & -8.7 \tabularnewline
72 & 102.8 & 111 & -8.20000000000001 \tabularnewline
\hline
\end{tabular}
%Source: https://freestatistics.org/blog/index.php?pk=29316&T=4

[TABLE]
[ROW][C]Multiple Linear Regression - Actuals, Interpolation, and Residuals[/C][/ROW]
[ROW][C]Time or Index[/C][C]Actuals[/C][C]InterpolationForecast[/C][C]ResidualsPrediction Error[/C][/ROW]
[ROW][C]1[/C][C]95.2[/C][C]110.066666666666[/C][C]-14.8666666666665[/C][/ROW]
[ROW][C]2[/C][C]95[/C][C]109.366666666667[/C][C]-14.3666666666667[/C][/ROW]
[ROW][C]3[/C][C]94[/C][C]107.7[/C][C]-13.7[/C][/ROW]
[ROW][C]4[/C][C]92.2[/C][C]106.233333333333[/C][C]-14.0333333333333[/C][/ROW]
[ROW][C]5[/C][C]91[/C][C]104.8[/C][C]-13.8[/C][/ROW]
[ROW][C]6[/C][C]91.2[/C][C]104.9[/C][C]-13.7[/C][/ROW]
[ROW][C]7[/C][C]103.4[/C][C]114.333333333333[/C][C]-10.9333333333333[/C][/ROW]
[ROW][C]8[/C][C]105[/C][C]118.173333333333[/C][C]-13.1733333333333[/C][/ROW]
[ROW][C]9[/C][C]104.6[/C][C]116.8[/C][C]-12.2[/C][/ROW]
[ROW][C]10[/C][C]103.8[/C][C]114.373333333333[/C][C]-10.5733333333333[/C][/ROW]
[ROW][C]11[/C][C]101.8[/C][C]110.7[/C][C]-8.9[/C][/ROW]
[ROW][C]12[/C][C]102.4[/C][C]111[/C][C]-8.6[/C][/ROW]
[ROW][C]13[/C][C]103.8[/C][C]110.066666666667[/C][C]-6.26666666666671[/C][/ROW]
[ROW][C]14[/C][C]103.4[/C][C]109.366666666667[/C][C]-5.96666666666666[/C][/ROW]
[ROW][C]15[/C][C]102[/C][C]107.7[/C][C]-5.7[/C][/ROW]
[ROW][C]16[/C][C]101.8[/C][C]106.233333333333[/C][C]-4.43333333333334[/C][/ROW]
[ROW][C]17[/C][C]100.2[/C][C]104.8[/C][C]-4.6[/C][/ROW]
[ROW][C]18[/C][C]101.4[/C][C]104.9[/C][C]-3.49999999999999[/C][/ROW]
[ROW][C]19[/C][C]113.8[/C][C]116.173333333333[/C][C]-2.37333333333334[/C][/ROW]
[ROW][C]20[/C][C]116[/C][C]118.173333333333[/C][C]-2.17333333333333[/C][/ROW]
[ROW][C]21[/C][C]115.6[/C][C]116.8[/C][C]-1.2[/C][/ROW]
[ROW][C]22[/C][C]113[/C][C]114.373333333333[/C][C]-1.37333333333334[/C][/ROW]
[ROW][C]23[/C][C]109.4[/C][C]110.7[/C][C]-1.29999999999999[/C][/ROW]
[ROW][C]24[/C][C]111[/C][C]111[/C][C]-8.40137421437293e-15[/C][/ROW]
[ROW][C]25[/C][C]112.4[/C][C]110.066666666667[/C][C]2.3333333333333[/C][/ROW]
[ROW][C]26[/C][C]112.2[/C][C]109.366666666667[/C][C]2.83333333333334[/C][/ROW]
[ROW][C]27[/C][C]111[/C][C]107.7[/C][C]3.3[/C][/ROW]
[ROW][C]28[/C][C]108.8[/C][C]106.233333333333[/C][C]2.56666666666667[/C][/ROW]
[ROW][C]29[/C][C]107.4[/C][C]104.8[/C][C]2.60000000000000[/C][/ROW]
[ROW][C]30[/C][C]108.6[/C][C]104.9[/C][C]3.69999999999999[/C][/ROW]
[ROW][C]31[/C][C]118.8[/C][C]116.173333333333[/C][C]2.62666666666666[/C][/ROW]
[ROW][C]32[/C][C]122.2[/C][C]116.333333333333[/C][C]5.86666666666667[/C][/ROW]
[ROW][C]33[/C][C]122.6[/C][C]116.8[/C][C]5.8[/C][/ROW]
[ROW][C]34[/C][C]122.2[/C][C]114.373333333333[/C][C]7.82666666666667[/C][/ROW]
[ROW][C]35[/C][C]118.8[/C][C]110.7[/C][C]8.1[/C][/ROW]
[ROW][C]36[/C][C]119[/C][C]111[/C][C]7.99999999999999[/C][/ROW]
[ROW][C]37[/C][C]118.2[/C][C]110.066666666667[/C][C]8.1333333333333[/C][/ROW]
[ROW][C]38[/C][C]117.8[/C][C]109.366666666667[/C][C]8.43333333333333[/C][/ROW]
[ROW][C]39[/C][C]116.8[/C][C]107.7[/C][C]9.1[/C][/ROW]
[ROW][C]40[/C][C]114.6[/C][C]106.233333333333[/C][C]8.36666666666666[/C][/ROW]
[ROW][C]41[/C][C]113.4[/C][C]104.8[/C][C]8.6[/C][/ROW]
[ROW][C]42[/C][C]113.8[/C][C]104.9[/C][C]8.9[/C][/ROW]
[ROW][C]43[/C][C]124.2[/C][C]116.173333333333[/C][C]8.02666666666667[/C][/ROW]
[ROW][C]44[/C][C]125.8[/C][C]118.173333333333[/C][C]7.62666666666667[/C][/ROW]
[ROW][C]45[/C][C]125.6[/C][C]116.8[/C][C]8.8[/C][/ROW]
[ROW][C]46[/C][C]122.4[/C][C]114.373333333333[/C][C]8.02666666666667[/C][/ROW]
[ROW][C]47[/C][C]119[/C][C]110.7[/C][C]8.3[/C][/ROW]
[ROW][C]48[/C][C]119.4[/C][C]111[/C][C]8.4[/C][/ROW]
[ROW][C]49[/C][C]118.6[/C][C]110.066666666667[/C][C]8.53333333333329[/C][/ROW]
[ROW][C]50[/C][C]118[/C][C]109.366666666667[/C][C]8.63333333333333[/C][/ROW]
[ROW][C]51[/C][C]116[/C][C]107.7[/C][C]8.3[/C][/ROW]
[ROW][C]52[/C][C]114.8[/C][C]106.233333333333[/C][C]8.56666666666666[/C][/ROW]
[ROW][C]53[/C][C]114.6[/C][C]104.8[/C][C]9.8[/C][/ROW]
[ROW][C]54[/C][C]114.6[/C][C]104.9[/C][C]9.7[/C][/ROW]
[ROW][C]55[/C][C]124[/C][C]116.173333333333[/C][C]7.82666666666667[/C][/ROW]
[ROW][C]56[/C][C]125.2[/C][C]118.173333333333[/C][C]7.02666666666667[/C][/ROW]
[ROW][C]57[/C][C]124[/C][C]116.8[/C][C]7.2[/C][/ROW]
[ROW][C]58[/C][C]117.6[/C][C]112.533333333333[/C][C]5.06666666666666[/C][/ROW]
[ROW][C]59[/C][C]113.2[/C][C]110.7[/C][C]2.5[/C][/ROW]
[ROW][C]60[/C][C]111.4[/C][C]111[/C][C]0.399999999999996[/C][/ROW]
[ROW][C]61[/C][C]112.2[/C][C]110.066666666667[/C][C]2.13333333333330[/C][/ROW]
[ROW][C]62[/C][C]109.8[/C][C]109.366666666667[/C][C]0.433333333333331[/C][/ROW]
[ROW][C]63[/C][C]106.4[/C][C]107.7[/C][C]-1.29999999999999[/C][/ROW]
[ROW][C]64[/C][C]105.2[/C][C]106.233333333333[/C][C]-1.03333333333333[/C][/ROW]
[ROW][C]65[/C][C]102.2[/C][C]104.8[/C][C]-2.6[/C][/ROW]
[ROW][C]66[/C][C]99.8[/C][C]104.9[/C][C]-5.1[/C][/ROW]
[ROW][C]67[/C][C]111[/C][C]116.173333333333[/C][C]-5.17333333333333[/C][/ROW]
[ROW][C]68[/C][C]113[/C][C]118.173333333333[/C][C]-5.17333333333333[/C][/ROW]
[ROW][C]69[/C][C]108.4[/C][C]116.8[/C][C]-8.39999999999999[/C][/ROW]
[ROW][C]70[/C][C]105.4[/C][C]114.373333333333[/C][C]-8.97333333333333[/C][/ROW]
[ROW][C]71[/C][C]102[/C][C]110.7[/C][C]-8.7[/C][/ROW]
[ROW][C]72[/C][C]102.8[/C][C]111[/C][C]-8.20000000000001[/C][/ROW]
[/TABLE]
Source: https://freestatistics.org/blog/index.php?pk=29316&T=4

Globally Unique Identifier (entire table): ba.freestatistics.org/blog/index.php?pk=29316&T=4

As an alternative you can also use a QR Code:  

The GUIDs for individual cells are displayed in the table below:

Multiple Linear Regression - Actuals, Interpolation, and Residuals
Time or IndexActualsInterpolationForecastResidualsPrediction Error
195.2110.066666666666-14.8666666666665
295109.366666666667-14.3666666666667
394107.7-13.7
492.2106.233333333333-14.0333333333333
591104.8-13.8
691.2104.9-13.7
7103.4114.333333333333-10.9333333333333
8105118.173333333333-13.1733333333333
9104.6116.8-12.2
10103.8114.373333333333-10.5733333333333
11101.8110.7-8.9
12102.4111-8.6
13103.8110.066666666667-6.26666666666671
14103.4109.366666666667-5.96666666666666
15102107.7-5.7
16101.8106.233333333333-4.43333333333334
17100.2104.8-4.6
18101.4104.9-3.49999999999999
19113.8116.173333333333-2.37333333333334
20116118.173333333333-2.17333333333333
21115.6116.8-1.2
22113114.373333333333-1.37333333333334
23109.4110.7-1.29999999999999
24111111-8.40137421437293e-15
25112.4110.0666666666672.3333333333333
26112.2109.3666666666672.83333333333334
27111107.73.3
28108.8106.2333333333332.56666666666667
29107.4104.82.60000000000000
30108.6104.93.69999999999999
31118.8116.1733333333332.62666666666666
32122.2116.3333333333335.86666666666667
33122.6116.85.8
34122.2114.3733333333337.82666666666667
35118.8110.78.1
361191117.99999999999999
37118.2110.0666666666678.1333333333333
38117.8109.3666666666678.43333333333333
39116.8107.79.1
40114.6106.2333333333338.36666666666666
41113.4104.88.6
42113.8104.98.9
43124.2116.1733333333338.02666666666667
44125.8118.1733333333337.62666666666667
45125.6116.88.8
46122.4114.3733333333338.02666666666667
47119110.78.3
48119.41118.4
49118.6110.0666666666678.53333333333329
50118109.3666666666678.63333333333333
51116107.78.3
52114.8106.2333333333338.56666666666666
53114.6104.89.8
54114.6104.99.7
55124116.1733333333337.82666666666667
56125.2118.1733333333337.02666666666667
57124116.87.2
58117.6112.5333333333335.06666666666666
59113.2110.72.5
60111.41110.399999999999996
61112.2110.0666666666672.13333333333330
62109.8109.3666666666670.433333333333331
63106.4107.7-1.29999999999999
64105.2106.233333333333-1.03333333333333
65102.2104.8-2.6
6699.8104.9-5.1
67111116.173333333333-5.17333333333333
68113118.173333333333-5.17333333333333
69108.4116.8-8.39999999999999
70105.4114.373333333333-8.97333333333333
71102110.7-8.7
72102.8111-8.20000000000001


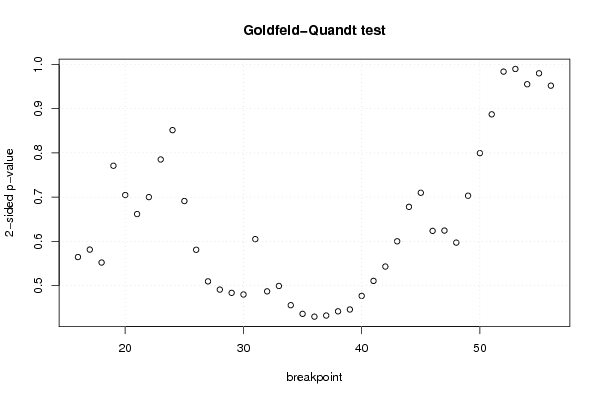
Goldfeld-Quandt test for Heteroskedasticity
p-valuesAlternative Hypothesis
breakpoint indexgreater2-sidedless
160.717803260120280.5643934797594410.282196739879721
170.7093842639580430.5812314720839140.290615736041957
180.7240072687327190.5519854625345620.275992731267281
190.6145471814620970.7709056370758060.385452818537903
200.6476626157348570.7046747685302860.352337384265143
210.6691781619850720.6616436760298560.330821838014928
220.6500136409797070.6999727180405870.349986359020293
230.6074500582531010.7850998834937990.392549941746899
240.5742790075366970.8514419849266060.425720992463303
250.654469030275460.691061939449080.34553096972454
260.7095735536097290.5808528927805420.290426446390271
270.745305366582120.5093892668357590.254694633417880
280.7546279634245560.4907440731508890.245372036575444
290.7583053249879990.4833893500240020.241694675012001
300.7601627769045930.4796744461908140.239837223095407
310.6975392752520670.6049214494958650.302460724747933
320.7566125637300850.486774872539830.243387436269915
330.7505258630422470.4989482739155060.249474136957753
340.7722725884474020.4554548231051960.227727411552598
350.7820602562751320.4358794874497360.217939743724868
360.7852230545255790.4295538909488430.214776945474421
370.783951233847780.4320975323044390.216048766152220
380.7791996215263920.4416007569472150.220800378473608
390.7771440341221770.4457119317556470.222855965877823
400.7617277688257380.4765444623485240.238272231174262
410.7447889806849490.5104220386301020.255211019315051
420.728559263351670.5428814732966590.271440736648329
430.6999792561706120.6000414876587760.300020743829388
440.6610293639140650.677941272171870.338970636085935
450.6451024249003920.7097951501992150.354897575099608
460.6882081680583620.6235836638832760.311791831941638
470.6878637832396290.6242724335207430.312136216760371
480.7015078822138380.5969842355723250.298492117786162
490.6484537565982480.7030924868035030.351546243401752
500.6002765492853680.7994469014292640.399723450714632
510.556382667516580.887234664966840.44361733248342
520.5081062892420790.9837874215158420.491893710757921
530.4949412187503580.9898824375007160.505058781249642
540.5223269545823210.9553460908353580.477673045417679
550.5099827307578410.9800345384843180.490017269242159
560.4760299813871310.9520599627742630.523970018612869

\begin{tabular}{lllllllll}
\hline
Goldfeld-Quandt test for Heteroskedasticity \tabularnewline
p-values & Alternative Hypothesis \tabularnewline
breakpoint index & greater & 2-sided & less \tabularnewline
16 & 0.71780326012028 & 0.564393479759441 & 0.282196739879721 \tabularnewline
17 & 0.709384263958043 & 0.581231472083914 & 0.290615736041957 \tabularnewline
18 & 0.724007268732719 & 0.551985462534562 & 0.275992731267281 \tabularnewline
19 & 0.614547181462097 & 0.770905637075806 & 0.385452818537903 \tabularnewline
20 & 0.647662615734857 & 0.704674768530286 & 0.352337384265143 \tabularnewline
21 & 0.669178161985072 & 0.661643676029856 & 0.330821838014928 \tabularnewline
22 & 0.650013640979707 & 0.699972718040587 & 0.349986359020293 \tabularnewline
23 & 0.607450058253101 & 0.785099883493799 & 0.392549941746899 \tabularnewline
24 & 0.574279007536697 & 0.851441984926606 & 0.425720992463303 \tabularnewline
25 & 0.65446903027546 & 0.69106193944908 & 0.34553096972454 \tabularnewline
26 & 0.709573553609729 & 0.580852892780542 & 0.290426446390271 \tabularnewline
27 & 0.74530536658212 & 0.509389266835759 & 0.254694633417880 \tabularnewline
28 & 0.754627963424556 & 0.490744073150889 & 0.245372036575444 \tabularnewline
29 & 0.758305324987999 & 0.483389350024002 & 0.241694675012001 \tabularnewline
30 & 0.760162776904593 & 0.479674446190814 & 0.239837223095407 \tabularnewline
31 & 0.697539275252067 & 0.604921449495865 & 0.302460724747933 \tabularnewline
32 & 0.756612563730085 & 0.48677487253983 & 0.243387436269915 \tabularnewline
33 & 0.750525863042247 & 0.498948273915506 & 0.249474136957753 \tabularnewline
34 & 0.772272588447402 & 0.455454823105196 & 0.227727411552598 \tabularnewline
35 & 0.782060256275132 & 0.435879487449736 & 0.217939743724868 \tabularnewline
36 & 0.785223054525579 & 0.429553890948843 & 0.214776945474421 \tabularnewline
37 & 0.78395123384778 & 0.432097532304439 & 0.216048766152220 \tabularnewline
38 & 0.779199621526392 & 0.441600756947215 & 0.220800378473608 \tabularnewline
39 & 0.777144034122177 & 0.445711931755647 & 0.222855965877823 \tabularnewline
40 & 0.761727768825738 & 0.476544462348524 & 0.238272231174262 \tabularnewline
41 & 0.744788980684949 & 0.510422038630102 & 0.255211019315051 \tabularnewline
42 & 0.72855926335167 & 0.542881473296659 & 0.271440736648329 \tabularnewline
43 & 0.699979256170612 & 0.600041487658776 & 0.300020743829388 \tabularnewline
44 & 0.661029363914065 & 0.67794127217187 & 0.338970636085935 \tabularnewline
45 & 0.645102424900392 & 0.709795150199215 & 0.354897575099608 \tabularnewline
46 & 0.688208168058362 & 0.623583663883276 & 0.311791831941638 \tabularnewline
47 & 0.687863783239629 & 0.624272433520743 & 0.312136216760371 \tabularnewline
48 & 0.701507882213838 & 0.596984235572325 & 0.298492117786162 \tabularnewline
49 & 0.648453756598248 & 0.703092486803503 & 0.351546243401752 \tabularnewline
50 & 0.600276549285368 & 0.799446901429264 & 0.399723450714632 \tabularnewline
51 & 0.55638266751658 & 0.88723466496684 & 0.44361733248342 \tabularnewline
52 & 0.508106289242079 & 0.983787421515842 & 0.491893710757921 \tabularnewline
53 & 0.494941218750358 & 0.989882437500716 & 0.505058781249642 \tabularnewline
54 & 0.522326954582321 & 0.955346090835358 & 0.477673045417679 \tabularnewline
55 & 0.509982730757841 & 0.980034538484318 & 0.490017269242159 \tabularnewline
56 & 0.476029981387131 & 0.952059962774263 & 0.523970018612869 \tabularnewline
\hline
\end{tabular}
%Source: https://freestatistics.org/blog/index.php?pk=29316&T=5

[TABLE]
[ROW][C]Goldfeld-Quandt test for Heteroskedasticity[/C][/ROW]
[ROW][C]p-values[/C][C]Alternative Hypothesis[/C][/ROW]
[ROW][C]breakpoint index[/C][C]greater[/C][C]2-sided[/C][C]less[/C][/ROW]
[ROW][C]16[/C][C]0.71780326012028[/C][C]0.564393479759441[/C][C]0.282196739879721[/C][/ROW]
[ROW][C]17[/C][C]0.709384263958043[/C][C]0.581231472083914[/C][C]0.290615736041957[/C][/ROW]
[ROW][C]18[/C][C]0.724007268732719[/C][C]0.551985462534562[/C][C]0.275992731267281[/C][/ROW]
[ROW][C]19[/C][C]0.614547181462097[/C][C]0.770905637075806[/C][C]0.385452818537903[/C][/ROW]
[ROW][C]20[/C][C]0.647662615734857[/C][C]0.704674768530286[/C][C]0.352337384265143[/C][/ROW]
[ROW][C]21[/C][C]0.669178161985072[/C][C]0.661643676029856[/C][C]0.330821838014928[/C][/ROW]
[ROW][C]22[/C][C]0.650013640979707[/C][C]0.699972718040587[/C][C]0.349986359020293[/C][/ROW]
[ROW][C]23[/C][C]0.607450058253101[/C][C]0.785099883493799[/C][C]0.392549941746899[/C][/ROW]
[ROW][C]24[/C][C]0.574279007536697[/C][C]0.851441984926606[/C][C]0.425720992463303[/C][/ROW]
[ROW][C]25[/C][C]0.65446903027546[/C][C]0.69106193944908[/C][C]0.34553096972454[/C][/ROW]
[ROW][C]26[/C][C]0.709573553609729[/C][C]0.580852892780542[/C][C]0.290426446390271[/C][/ROW]
[ROW][C]27[/C][C]0.74530536658212[/C][C]0.509389266835759[/C][C]0.254694633417880[/C][/ROW]
[ROW][C]28[/C][C]0.754627963424556[/C][C]0.490744073150889[/C][C]0.245372036575444[/C][/ROW]
[ROW][C]29[/C][C]0.758305324987999[/C][C]0.483389350024002[/C][C]0.241694675012001[/C][/ROW]
[ROW][C]30[/C][C]0.760162776904593[/C][C]0.479674446190814[/C][C]0.239837223095407[/C][/ROW]
[ROW][C]31[/C][C]0.697539275252067[/C][C]0.604921449495865[/C][C]0.302460724747933[/C][/ROW]
[ROW][C]32[/C][C]0.756612563730085[/C][C]0.48677487253983[/C][C]0.243387436269915[/C][/ROW]
[ROW][C]33[/C][C]0.750525863042247[/C][C]0.498948273915506[/C][C]0.249474136957753[/C][/ROW]
[ROW][C]34[/C][C]0.772272588447402[/C][C]0.455454823105196[/C][C]0.227727411552598[/C][/ROW]
[ROW][C]35[/C][C]0.782060256275132[/C][C]0.435879487449736[/C][C]0.217939743724868[/C][/ROW]
[ROW][C]36[/C][C]0.785223054525579[/C][C]0.429553890948843[/C][C]0.214776945474421[/C][/ROW]
[ROW][C]37[/C][C]0.78395123384778[/C][C]0.432097532304439[/C][C]0.216048766152220[/C][/ROW]
[ROW][C]38[/C][C]0.779199621526392[/C][C]0.441600756947215[/C][C]0.220800378473608[/C][/ROW]
[ROW][C]39[/C][C]0.777144034122177[/C][C]0.445711931755647[/C][C]0.222855965877823[/C][/ROW]
[ROW][C]40[/C][C]0.761727768825738[/C][C]0.476544462348524[/C][C]0.238272231174262[/C][/ROW]
[ROW][C]41[/C][C]0.744788980684949[/C][C]0.510422038630102[/C][C]0.255211019315051[/C][/ROW]
[ROW][C]42[/C][C]0.72855926335167[/C][C]0.542881473296659[/C][C]0.271440736648329[/C][/ROW]
[ROW][C]43[/C][C]0.699979256170612[/C][C]0.600041487658776[/C][C]0.300020743829388[/C][/ROW]
[ROW][C]44[/C][C]0.661029363914065[/C][C]0.67794127217187[/C][C]0.338970636085935[/C][/ROW]
[ROW][C]45[/C][C]0.645102424900392[/C][C]0.709795150199215[/C][C]0.354897575099608[/C][/ROW]
[ROW][C]46[/C][C]0.688208168058362[/C][C]0.623583663883276[/C][C]0.311791831941638[/C][/ROW]
[ROW][C]47[/C][C]0.687863783239629[/C][C]0.624272433520743[/C][C]0.312136216760371[/C][/ROW]
[ROW][C]48[/C][C]0.701507882213838[/C][C]0.596984235572325[/C][C]0.298492117786162[/C][/ROW]
[ROW][C]49[/C][C]0.648453756598248[/C][C]0.703092486803503[/C][C]0.351546243401752[/C][/ROW]
[ROW][C]50[/C][C]0.600276549285368[/C][C]0.799446901429264[/C][C]0.399723450714632[/C][/ROW]
[ROW][C]51[/C][C]0.55638266751658[/C][C]0.88723466496684[/C][C]0.44361733248342[/C][/ROW]
[ROW][C]52[/C][C]0.508106289242079[/C][C]0.983787421515842[/C][C]0.491893710757921[/C][/ROW]
[ROW][C]53[/C][C]0.494941218750358[/C][C]0.989882437500716[/C][C]0.505058781249642[/C][/ROW]
[ROW][C]54[/C][C]0.522326954582321[/C][C]0.955346090835358[/C][C]0.477673045417679[/C][/ROW]
[ROW][C]55[/C][C]0.509982730757841[/C][C]0.980034538484318[/C][C]0.490017269242159[/C][/ROW]
[ROW][C]56[/C][C]0.476029981387131[/C][C]0.952059962774263[/C][C]0.523970018612869[/C][/ROW]
[/TABLE]
Source: https://freestatistics.org/blog/index.php?pk=29316&T=5

Globally Unique Identifier (entire table): ba.freestatistics.org/blog/index.php?pk=29316&T=5

As an alternative you can also use a QR Code:  

The GUIDs for individual cells are displayed in the table below:

Goldfeld-Quandt test for Heteroskedasticity
p-valuesAlternative Hypothesis
breakpoint indexgreater2-sidedless
160.717803260120280.5643934797594410.282196739879721
170.7093842639580430.5812314720839140.290615736041957
180.7240072687327190.5519854625345620.275992731267281
190.6145471814620970.7709056370758060.385452818537903
200.6476626157348570.7046747685302860.352337384265143
210.6691781619850720.6616436760298560.330821838014928
220.6500136409797070.6999727180405870.349986359020293
230.6074500582531010.7850998834937990.392549941746899
240.5742790075366970.8514419849266060.425720992463303
250.654469030275460.691061939449080.34553096972454
260.7095735536097290.5808528927805420.290426446390271
270.745305366582120.5093892668357590.254694633417880
280.7546279634245560.4907440731508890.245372036575444
290.7583053249879990.4833893500240020.241694675012001
300.7601627769045930.4796744461908140.239837223095407
310.6975392752520670.6049214494958650.302460724747933
320.7566125637300850.486774872539830.243387436269915
330.7505258630422470.4989482739155060.249474136957753
340.7722725884474020.4554548231051960.227727411552598
350.7820602562751320.4358794874497360.217939743724868
360.7852230545255790.4295538909488430.214776945474421
370.783951233847780.4320975323044390.216048766152220
380.7791996215263920.4416007569472150.220800378473608
390.7771440341221770.4457119317556470.222855965877823
400.7617277688257380.4765444623485240.238272231174262
410.7447889806849490.5104220386301020.255211019315051
420.728559263351670.5428814732966590.271440736648329
430.6999792561706120.6000414876587760.300020743829388
440.6610293639140650.677941272171870.338970636085935
450.6451024249003920.7097951501992150.354897575099608
460.6882081680583620.6235836638832760.311791831941638
470.6878637832396290.6242724335207430.312136216760371
480.7015078822138380.5969842355723250.298492117786162
490.6484537565982480.7030924868035030.351546243401752
500.6002765492853680.7994469014292640.399723450714632
510.556382667516580.887234664966840.44361733248342
520.5081062892420790.9837874215158420.491893710757921
530.4949412187503580.9898824375007160.505058781249642
540.5223269545823210.9553460908353580.477673045417679
550.5099827307578410.9800345384843180.490017269242159
560.4760299813871310.9520599627742630.523970018612869


Meta Analysis of Goldfeld-Quandt test for Heteroskedasticity
Description# significant tests% significant testsOK/NOK
1% type I error level00OK
5% type I error level00OK
10% type I error level00OK

\begin{tabular}{lllllllll}
\hline
Meta Analysis of Goldfeld-Quandt test for Heteroskedasticity \tabularnewline
Description & # significant tests & % significant tests & OK/NOK \tabularnewline
1% type I error level & 0 & 0 & OK \tabularnewline
5% type I error level & 0 & 0 & OK \tabularnewline
10% type I error level & 0 & 0 & OK \tabularnewline
\hline
\end{tabular}
%Source: https://freestatistics.org/blog/index.php?pk=29316&T=6

[TABLE]
[ROW][C]Meta Analysis of Goldfeld-Quandt test for Heteroskedasticity[/C][/ROW]
[ROW][C]Description[/C][C]# significant tests[/C][C]% significant tests[/C][C]OK/NOK[/C][/ROW]
[ROW][C]1% type I error level[/C][C]0[/C][C]0[/C][C]OK[/C][/ROW]
[ROW][C]5% type I error level[/C][C]0[/C][C]0[/C][C]OK[/C][/ROW]
[ROW][C]10% type I error level[/C][C]0[/C][C]0[/C][C]OK[/C][/ROW]
[/TABLE]
Source: https://freestatistics.org/blog/index.php?pk=29316&T=6

Globally Unique Identifier (entire table): ba.freestatistics.org/blog/index.php?pk=29316&T=6

As an alternative you can also use a QR Code:  

The GUIDs for individual cells are displayed in the table below:

Meta Analysis of Goldfeld-Quandt test for Heteroskedasticity
Description# significant tests% significant testsOK/NOK
1% type I error level00OK
5% type I error level00OK
10% type I error level00OK


Parameters (Session):
par1 = 1 ; par2 = Include Monthly Dummies ; par3 = No Linear Trend ;
Parameters (R input):
par1 = 1 ; par2 = Include Monthly Dummies ; par3 = No Linear Trend ;
R code (references can be found in the software module):
library(lattice)
library(lmtest)
n25 <- 25 #minimum number of obs. for Goldfeld-Quandt test
par1 <- as.numeric(par1)
x <- t(y)
k <- length(x[1,])
n <- length(x[,1])
x1 <- cbind(x[,par1], x[,1:k!=par1])
mycolnames <- c(colnames(x)[par1], colnames(x)[1:k!=par1])
colnames(x1) <- mycolnames #colnames(x)[par1]
x <- x1
if (par3 == 'First Differences'){
x2 <- array(0, dim=c(n-1,k), dimnames=list(1:(n-1), paste('(1-B)',colnames(x),sep='')))
for (i in 1:n-1) {
for (j in 1:k) {
x2[i,j] <- x[i+1,j] - x[i,j]
}
}
x <- x2
}
if (par2 == 'Include Monthly Dummies'){
x2 <- array(0, dim=c(n,11), dimnames=list(1:n, paste('M', seq(1:11), sep ='')))
for (i in 1:11){
x2[seq(i,n,12),i] <- 1
}
x <- cbind(x, x2)
}
if (par2 == 'Include Quarterly Dummies'){
x2 <- array(0, dim=c(n,3), dimnames=list(1:n, paste('Q', seq(1:3), sep ='')))
for (i in 1:3){
x2[seq(i,n,4),i] <- 1
}
x <- cbind(x, x2)
}
k <- length(x[1,])
if (par3 == 'Linear Trend'){
x <- cbind(x, c(1:n))
colnames(x)[k+1] <- 't'
}
x
k <- length(x[1,])
df <- as.data.frame(x)
(mylm <- lm(df))
(mysum <- summary(mylm))
if (n > n25) {
kp3 <- k + 3
nmkm3 <- n - k - 3
gqarr <- array(NA, dim=c(nmkm3-kp3+1,3))
numgqtests <- 0
numsignificant1 <- 0
numsignificant5 <- 0
numsignificant10 <- 0
for (mypoint in kp3:nmkm3) {
j <- 0
numgqtests <- numgqtests + 1
for (myalt in c('greater', 'two.sided', 'less')) {
j <- j + 1
gqarr[mypoint-kp3+1,j] <- gqtest(mylm, point=mypoint, alternative=myalt)$p.value
}
if (gqarr[mypoint-kp3+1,2] < 0.01) numsignificant1 <- numsignificant1 + 1
if (gqarr[mypoint-kp3+1,2] < 0.05) numsignificant5 <- numsignificant5 + 1
if (gqarr[mypoint-kp3+1,2] < 0.10) numsignificant10 <- numsignificant10 + 1
}
gqarr
}
bitmap(file='test0.png')
plot(x[,1], type='l', main='Actuals and Interpolation', ylab='value of Actuals and Interpolation (dots)', xlab='time or index')
points(x[,1]-mysum$resid)
grid()
dev.off()
bitmap(file='test1.png')
plot(mysum$resid, type='b', pch=19, main='Residuals', ylab='value of Residuals', xlab='time or index')
grid()
dev.off()
bitmap(file='test2.png')
hist(mysum$resid, main='Residual Histogram', xlab='values of Residuals')
grid()
dev.off()
bitmap(file='test3.png')
densityplot(~mysum$resid,col='black',main='Residual Density Plot', xlab='values of Residuals')
dev.off()
bitmap(file='test4.png')
qqnorm(mysum$resid, main='Residual Normal Q-Q Plot')
qqline(mysum$resid)
grid()
dev.off()
(myerror <- as.ts(mysum$resid))
bitmap(file='test5.png')
dum <- cbind(lag(myerror,k=1),myerror)
dum
dum1 <- dum[2:length(myerror),]
dum1
z <- as.data.frame(dum1)
z
plot(z,main=paste('Residual Lag plot, lowess, and regression line'), ylab='values of Residuals', xlab='lagged values of Residuals')
lines(lowess(z))
abline(lm(z))
grid()
dev.off()
bitmap(file='test6.png')
acf(mysum$resid, lag.max=length(mysum$resid)/2, main='Residual Autocorrelation Function')
grid()
dev.off()
bitmap(file='test7.png')
pacf(mysum$resid, lag.max=length(mysum$resid)/2, main='Residual Partial Autocorrelation Function')
grid()
dev.off()
bitmap(file='test8.png')
opar <- par(mfrow = c(2,2), oma = c(0, 0, 1.1, 0))
plot(mylm, las = 1, sub='Residual Diagnostics')
par(opar)
dev.off()
if (n > n25) {
bitmap(file='test9.png')
plot(kp3:nmkm3,gqarr[,2], main='Goldfeld-Quandt test',ylab='2-sided p-value',xlab='breakpoint')
grid()
dev.off()
}
load(file='createtable')
a<-table.start()
a<-table.row.start(a)
a<-table.element(a, 'Multiple Linear Regression - Estimated Regression Equation', 1, TRUE)
a<-table.row.end(a)
myeq <- colnames(x)[1]
myeq <- paste(myeq, '[t] = ', sep='')
for (i in 1:k){
if (mysum$coefficients[i,1] > 0) myeq <- paste(myeq, '+', '')
myeq <- paste(myeq, mysum$coefficients[i,1], sep=' ')
if (rownames(mysum$coefficients)[i] != '(Intercept)') {
myeq <- paste(myeq, rownames(mysum$coefficients)[i], sep='')
if (rownames(mysum$coefficients)[i] != 't') myeq <- paste(myeq, '[t]', sep='')
}
}
myeq <- paste(myeq, ' + e[t]')
a<-table.row.start(a)
a<-table.element(a, myeq)
a<-table.row.end(a)
a<-table.end(a)
table.save(a,file='mytable1.tab')
a<-table.start()
a<-table.row.start(a)
a<-table.element(a,hyperlink('ols1.htm','Multiple Linear Regression - Ordinary Least Squares',''), 6, TRUE)
a<-table.row.end(a)
a<-table.row.start(a)
a<-table.element(a,'Variable',header=TRUE)
a<-table.element(a,'Parameter',header=TRUE)
a<-table.element(a,'S.D.',header=TRUE)
a<-table.element(a,'T-STAT
H0: parameter = 0',header=TRUE)
a<-table.element(a,'2-tail p-value',header=TRUE)
a<-table.element(a,'1-tail p-value',header=TRUE)
a<-table.row.end(a)
for (i in 1:k){
a<-table.row.start(a)
a<-table.element(a,rownames(mysum$coefficients)[i],header=TRUE)
a<-table.element(a,mysum$coefficients[i,1])
a<-table.element(a, round(mysum$coefficients[i,2],6))
a<-table.element(a, round(mysum$coefficients[i,3],4))
a<-table.element(a, round(mysum$coefficients[i,4],6))
a<-table.element(a, round(mysum$coefficients[i,4]/2,6))
a<-table.row.end(a)
}
a<-table.end(a)
table.save(a,file='mytable2.tab')
a<-table.start()
a<-table.row.start(a)
a<-table.element(a, 'Multiple Linear Regression - Regression Statistics', 2, TRUE)
a<-table.row.end(a)
a<-table.row.start(a)
a<-table.element(a, 'Multiple R',1,TRUE)
a<-table.element(a, sqrt(mysum$r.squared))
a<-table.row.end(a)
a<-table.row.start(a)
a<-table.element(a, 'R-squared',1,TRUE)
a<-table.element(a, mysum$r.squared)
a<-table.row.end(a)
a<-table.row.start(a)
a<-table.element(a, 'Adjusted R-squared',1,TRUE)
a<-table.element(a, mysum$adj.r.squared)
a<-table.row.end(a)
a<-table.row.start(a)
a<-table.element(a, 'F-TEST (value)',1,TRUE)
a<-table.element(a, mysum$fstatistic[1])
a<-table.row.end(a)
a<-table.row.start(a)
a<-table.element(a, 'F-TEST (DF numerator)',1,TRUE)
a<-table.element(a, mysum$fstatistic[2])
a<-table.row.end(a)
a<-table.row.start(a)
a<-table.element(a, 'F-TEST (DF denominator)',1,TRUE)
a<-table.element(a, mysum$fstatistic[3])
a<-table.row.end(a)
a<-table.row.start(a)
a<-table.element(a, 'p-value',1,TRUE)
a<-table.element(a, 1-pf(mysum$fstatistic[1],mysum$fstatistic[2],mysum$fstatistic[3]))
a<-table.row.end(a)
a<-table.row.start(a)
a<-table.element(a, 'Multiple Linear Regression - Residual Statistics', 2, TRUE)
a<-table.row.end(a)
a<-table.row.start(a)
a<-table.element(a, 'Residual Standard Deviation',1,TRUE)
a<-table.element(a, mysum$sigma)
a<-table.row.end(a)
a<-table.row.start(a)
a<-table.element(a, 'Sum Squared Residuals',1,TRUE)
a<-table.element(a, sum(myerror*myerror))
a<-table.row.end(a)
a<-table.end(a)
table.save(a,file='mytable3.tab')
a<-table.start()
a<-table.row.start(a)
a<-table.element(a, 'Multiple Linear Regression - Actuals, Interpolation, and Residuals', 4, TRUE)
a<-table.row.end(a)
a<-table.row.start(a)
a<-table.element(a, 'Time or Index', 1, TRUE)
a<-table.element(a, 'Actuals', 1, TRUE)
a<-table.element(a, 'Interpolation
Forecast', 1, TRUE)
a<-table.element(a, 'Residuals
Prediction Error', 1, TRUE)
a<-table.row.end(a)
for (i in 1:n) {
a<-table.row.start(a)
a<-table.element(a,i, 1, TRUE)
a<-table.element(a,x[i])
a<-table.element(a,x[i]-mysum$resid[i])
a<-table.element(a,mysum$resid[i])
a<-table.row.end(a)
}
a<-table.end(a)
table.save(a,file='mytable4.tab')
if (n > n25) {
a<-table.start()
a<-table.row.start(a)
a<-table.element(a,'Goldfeld-Quandt test for Heteroskedasticity',4,TRUE)
a<-table.row.end(a)
a<-table.row.start(a)
a<-table.element(a,'p-values',header=TRUE)
a<-table.element(a,'Alternative Hypothesis',3,header=TRUE)
a<-table.row.end(a)
a<-table.row.start(a)
a<-table.element(a,'breakpoint index',header=TRUE)
a<-table.element(a,'greater',header=TRUE)
a<-table.element(a,'2-sided',header=TRUE)
a<-table.element(a,'less',header=TRUE)
a<-table.row.end(a)
for (mypoint in kp3:nmkm3) {
a<-table.row.start(a)
a<-table.element(a,mypoint,header=TRUE)
a<-table.element(a,gqarr[mypoint-kp3+1,1])
a<-table.element(a,gqarr[mypoint-kp3+1,2])
a<-table.element(a,gqarr[mypoint-kp3+1,3])
a<-table.row.end(a)
}
a<-table.end(a)
table.save(a,file='mytable5.tab')
a<-table.start()
a<-table.row.start(a)
a<-table.element(a,'Meta Analysis of Goldfeld-Quandt test for Heteroskedasticity',4,TRUE)
a<-table.row.end(a)
a<-table.row.start(a)
a<-table.element(a,'Description',header=TRUE)
a<-table.element(a,'# significant tests',header=TRUE)
a<-table.element(a,'% significant tests',header=TRUE)
a<-table.element(a,'OK/NOK',header=TRUE)
a<-table.row.end(a)
a<-table.row.start(a)
a<-table.element(a,'1% type I error level',header=TRUE)
a<-table.element(a,numsignificant1)
a<-table.element(a,numsignificant1/numgqtests)
if (numsignificant1/numgqtests < 0.01) dum <- 'OK' else dum <- 'NOK'
a<-table.element(a,dum)
a<-table.row.end(a)
a<-table.row.start(a)
a<-table.element(a,'5% type I error level',header=TRUE)
a<-table.element(a,numsignificant5)
a<-table.element(a,numsignificant5/numgqtests)
if (numsignificant5/numgqtests < 0.05) dum <- 'OK' else dum <- 'NOK'
a<-table.element(a,dum)
a<-table.row.end(a)
a<-table.row.start(a)
a<-table.element(a,'10% type I error level',header=TRUE)
a<-table.element(a,numsignificant10)
a<-table.element(a,numsignificant10/numgqtests)
if (numsignificant10/numgqtests < 0.1) dum <- 'OK' else dum <- 'NOK'
a<-table.element(a,dum)
a<-table.row.end(a)
a<-table.end(a)
table.save(a,file='mytable6.tab')
}