Free Statistics

of Irreproducible Research!

Author's title

Author*The author of this computation has been verified*
R Software Modulerwasp_centraltendency.wasp
Title produced by softwareCentral Tendency
Date of computationFri, 05 Dec 2008 08:19:38 -0700
Cite this page as followsStatistical Computations at FreeStatistics.org, Office for Research Development and Education, URL https://freestatistics.org/blog/index.php?v=date/2008/Dec/05/t1228490482kykqwyvx86af3st.htm/, Retrieved Thu, 16 May 2024 14:41:00 +0000
Statistical Computations at FreeStatistics.org, Office for Research Development and Education, URL https://freestatistics.org/blog/index.php?pk=29313, Retrieved Thu, 16 May 2024 14:41:00 +0000
QR Codes:

Original text written by user:
IsPrivate?No (this computation is public)
User-defined keywords
Estimated Impact166
Family? (F = Feedback message, R = changed R code, M = changed R Module, P = changed Parameters, D = changed Data)
-       [Central Tendency] [Intermediaire goe...] [2008-12-05 15:19:38] [5925747fb2a6bb4cfcd8015825ee5e92] [Current]
Feedback Forum

Post a new message
Dataseries X:
103,1
100,6
103,1
95,5
90,5
90,9
88,8
90,7
94,3
104,6
111,1
110,8
107,2
99
99
91
96,2
96,9
96,2
100,1
99
115,4
106,9
107,1
99,3
99,2
108,3
105,6
99,5
107,4
93,1
88,1
110,7
113,1
99,6
93,6
98,6
99,6
114,3
107,8
101,2
112,5
100,5
93,9
116,2
112
106,4
95,7
96
95,8
103
102,2
98,4
111,4
86,6
91,3
107,9
101,8
104,4
93,4
100,1
98,5
112,9
101,4
107,1
110,8
90,3
95,5
111,4
113
107,5
95,9
106,3
105,2
117,2
106,9
108,2
113
97,2
99,9
108,1
118,1
109,1
93,3
112,1


Summary of computational transaction
Raw Inputview raw input (R code)
Raw Outputview raw output of R engine
Computing time1 seconds
R Server'George Udny Yule' @ 72.249.76.132

\begin{tabular}{lllllllll}
\hline
Summary of computational transaction \tabularnewline
Raw Input & view raw input (R code)  \tabularnewline
Raw Output & view raw output of R engine  \tabularnewline
Computing time & 1 seconds \tabularnewline
R Server & 'George Udny Yule' @ 72.249.76.132 \tabularnewline
\hline
\end{tabular}
%Source: https://freestatistics.org/blog/index.php?pk=29313&T=0

[TABLE]
[ROW][C]Summary of computational transaction[/C][/ROW]
[ROW][C]Raw Input[/C][C]view raw input (R code) [/C][/ROW]
[ROW][C]Raw Output[/C][C]view raw output of R engine [/C][/ROW]
[ROW][C]Computing time[/C][C]1 seconds[/C][/ROW]
[ROW][C]R Server[/C][C]'George Udny Yule' @ 72.249.76.132[/C][/ROW]
[/TABLE]
Source: https://freestatistics.org/blog/index.php?pk=29313&T=0

Globally Unique Identifier (entire table): ba.freestatistics.org/blog/index.php?pk=29313&T=0

As an alternative you can also use a QR Code:  

The GUIDs for individual cells are displayed in the table below:

Summary of computational transaction
Raw Inputview raw input (R code)
Raw Outputview raw output of R engine
Computing time1 seconds
R Server'George Udny Yule' @ 72.249.76.132


Central Tendency - Ungrouped Data
MeasureValueS.E.Value/S.E.
Arithmetic Mean102.4164705882350.840357812045329121.872456137423
Geometric Mean102.125951119340
Harmonic Mean101.834857409753
Quadratic Mean102.705668553109
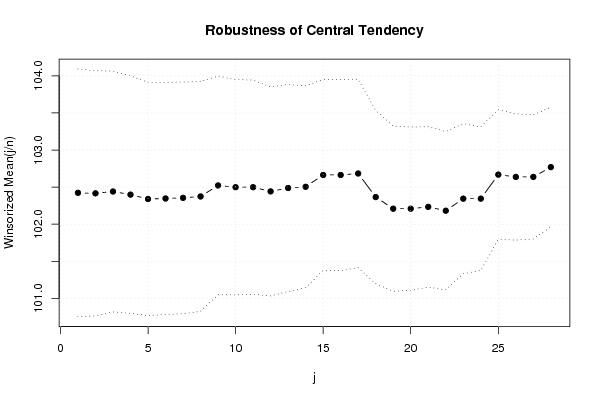
Winsorized Mean ( 1 / 28 )102.4235294117650.83428401860169122.768178615518
Winsorized Mean ( 2 / 28 )102.4164705882350.826166685555424123.965868363939
Winsorized Mean ( 3 / 28 )102.4411764705880.810758012573044126.352345437177
Winsorized Mean ( 4 / 28 )102.3988235294120.79957182890172128.067072685721
Winsorized Mean ( 5 / 28 )102.340.785477784625419130.290126599576
Winsorized Mean ( 6 / 28 )102.3470588235290.781854056307806130.903022114957
Winsorized Mean ( 7 / 28 )102.3552941176470.780423116371379131.153590879719
Winsorized Mean ( 8 / 28 )102.3741176470590.774047083703834132.258256380473
Winsorized Mean ( 9 / 28 )102.5223529411760.736414541320522139.218262525528
Winsorized Mean ( 10 / 28 )102.4988235294120.72534256200937141.310918313501
Winsorized Mean ( 11 / 28 )102.4988235294120.721359776741406142.091126833311
Winsorized Mean ( 12 / 28 )102.4423529411760.704070550622414145.500124739794
Winsorized Mean ( 13 / 28 )102.4882352941180.697276437801724146.98364914958
Winsorized Mean ( 14 / 28 )102.5047058823530.68023909514318150.689230616446
Winsorized Mean ( 15 / 28 )102.6635294117650.64299031593272159.665747473726
Winsorized Mean ( 16 / 28 )102.6635294117650.64299031593272159.665747473726
Winsorized Mean ( 17 / 28 )102.6835294117650.63470773851438161.780805843189
Winsorized Mean ( 18 / 28 )102.3658823529410.583043672639517175.571551766469
Winsorized Mean ( 19 / 28 )102.2094117647060.556068188817341183.807334820010
Winsorized Mean ( 20 / 28 )102.2094117647060.549837316223697185.890278358486
Winsorized Mean ( 21 / 28 )102.2341176470590.54002944452657189.312117484047
Winsorized Mean ( 22 / 28 )102.1823529411760.533379312979284191.575395698080
Winsorized Mean ( 23 / 28 )102.3447058823530.505101442739546202.622081867873
Winsorized Mean ( 24 / 28 )102.3447058823530.483476282972668211.685059819447
Winsorized Mean ( 25 / 28 )102.6682352941180.436734802662118235.081414781472
Winsorized Mean ( 26 / 28 )102.6376470588240.425332219701839241.311714242512
Winsorized Mean ( 27 / 28 )102.6376470588240.417616205906597245.770268507681
Winsorized Mean ( 28 / 28 )102.7694117647060.402687134949472255.209076340621
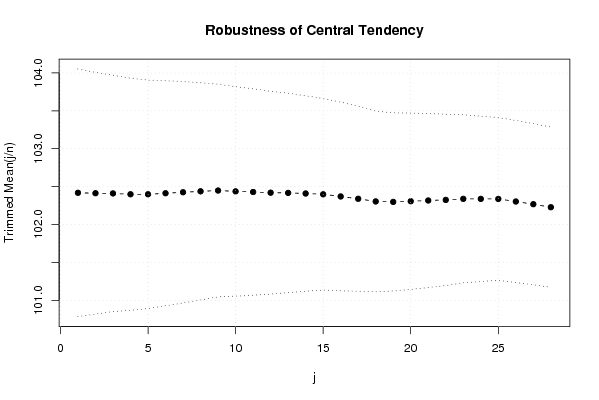
Trimmed Mean ( 1 / 28 )102.4180722891570.817288839906177125.314414302921
Trimmed Mean ( 2 / 28 )102.4123456790120.797626461036638128.396374345344
Trimmed Mean ( 3 / 28 )102.4101265822780.77982012368608131.325319098208
Trimmed Mean ( 4 / 28 )102.3987012987010.765791808080778133.716109545925
Trimmed Mean ( 5 / 28 )102.3986666666670.753204549304565135.950674702126
Trimmed Mean ( 6 / 28 )102.4123287671230.742442760544187137.939696108099
Trimmed Mean ( 7 / 28 )102.4253521126760.730559495385023140.201246797422
Trimmed Mean ( 8 / 28 )102.4376811594200.716717027065237142.926255817969
Trimmed Mean ( 9 / 28 )102.4477611940300.701598479254383146.020500647187
Trimmed Mean ( 10 / 28 )102.4369230769230.691335695866124148.172477841734
Trimmed Mean ( 11 / 28 )102.4285714285710.680988365521445150.411631996297
Trimmed Mean ( 12 / 28 )102.4196721311480.669037395412045153.085123243477
Trimmed Mean ( 13 / 28 )102.4169491525420.657604674040215155.742428841495
Trimmed Mean ( 14 / 28 )102.4087719298250.64466812925579158.855025217465
Trimmed Mean ( 15 / 28 )102.3981818181820.631733710410723162.090735591120
Trimmed Mean ( 16 / 28 )102.3698113207550.622238951539688164.518487740839
Trimmed Mean ( 17 / 28 )102.3392156862750.609969966675458167.777466559637
Trimmed Mean ( 18 / 28 )102.3040816326530.595732836182518171.728122774333
Trimmed Mean ( 19 / 28 )102.2978723404260.587500777346718174.123807635498
Trimmed Mean ( 20 / 28 )102.3066666666670.58138983600863175.969135217472
Trimmed Mean ( 21 / 28 )102.3162790697670.573867320342632178.292569454345
Trimmed Mean ( 22 / 28 )102.3243902439020.565197790631037181.041737848371
Trimmed Mean ( 23 / 28 )102.3384615384620.554269593716295184.636614922889
Trimmed Mean ( 24 / 28 )102.3378378378380.545171975392191187.716615044669
Trimmed Mean ( 25 / 28 )102.3371428571430.536751600754357190.660153995474
Trimmed Mean ( 26 / 28 )102.3030303030300.534482985252416191.405588439296
Trimmed Mean ( 27 / 28 )102.2677419354840.531975161049497192.241573335354
Trimmed Mean ( 28 / 28 )102.2275862068970.527959557520689193.627683694107
Median101.4
Midrange102.35
Midmean - Weighted Average at Xnp102.178571428571
Midmean - Weighted Average at X(n+1)p102.316279069767
Midmean - Empirical Distribution Function102.316279069767
Midmean - Empirical Distribution Function - Averaging102.316279069767
Midmean - Empirical Distribution Function - Interpolation102.316279069767
Midmean - Closest Observation102.172727272727
Midmean - True Basic - Statistics Graphics Toolkit102.316279069767
Midmean - MS Excel (old versions)102.316279069767
Number of observations85

\begin{tabular}{lllllllll}
\hline
Central Tendency - Ungrouped Data \tabularnewline
Measure & Value & S.E. & Value/S.E. \tabularnewline
Arithmetic Mean & 102.416470588235 & 0.840357812045329 & 121.872456137423 \tabularnewline
Geometric Mean & 102.125951119340 &  &  \tabularnewline
Harmonic Mean & 101.834857409753 &  &  \tabularnewline
Quadratic Mean & 102.705668553109 &  &  \tabularnewline
Winsorized Mean ( 1 / 28 ) & 102.423529411765 & 0.83428401860169 & 122.768178615518 \tabularnewline
Winsorized Mean ( 2 / 28 ) & 102.416470588235 & 0.826166685555424 & 123.965868363939 \tabularnewline
Winsorized Mean ( 3 / 28 ) & 102.441176470588 & 0.810758012573044 & 126.352345437177 \tabularnewline
Winsorized Mean ( 4 / 28 ) & 102.398823529412 & 0.79957182890172 & 128.067072685721 \tabularnewline
Winsorized Mean ( 5 / 28 ) & 102.34 & 0.785477784625419 & 130.290126599576 \tabularnewline
Winsorized Mean ( 6 / 28 ) & 102.347058823529 & 0.781854056307806 & 130.903022114957 \tabularnewline
Winsorized Mean ( 7 / 28 ) & 102.355294117647 & 0.780423116371379 & 131.153590879719 \tabularnewline
Winsorized Mean ( 8 / 28 ) & 102.374117647059 & 0.774047083703834 & 132.258256380473 \tabularnewline
Winsorized Mean ( 9 / 28 ) & 102.522352941176 & 0.736414541320522 & 139.218262525528 \tabularnewline
Winsorized Mean ( 10 / 28 ) & 102.498823529412 & 0.72534256200937 & 141.310918313501 \tabularnewline
Winsorized Mean ( 11 / 28 ) & 102.498823529412 & 0.721359776741406 & 142.091126833311 \tabularnewline
Winsorized Mean ( 12 / 28 ) & 102.442352941176 & 0.704070550622414 & 145.500124739794 \tabularnewline
Winsorized Mean ( 13 / 28 ) & 102.488235294118 & 0.697276437801724 & 146.98364914958 \tabularnewline
Winsorized Mean ( 14 / 28 ) & 102.504705882353 & 0.68023909514318 & 150.689230616446 \tabularnewline
Winsorized Mean ( 15 / 28 ) & 102.663529411765 & 0.64299031593272 & 159.665747473726 \tabularnewline
Winsorized Mean ( 16 / 28 ) & 102.663529411765 & 0.64299031593272 & 159.665747473726 \tabularnewline
Winsorized Mean ( 17 / 28 ) & 102.683529411765 & 0.63470773851438 & 161.780805843189 \tabularnewline
Winsorized Mean ( 18 / 28 ) & 102.365882352941 & 0.583043672639517 & 175.571551766469 \tabularnewline
Winsorized Mean ( 19 / 28 ) & 102.209411764706 & 0.556068188817341 & 183.807334820010 \tabularnewline
Winsorized Mean ( 20 / 28 ) & 102.209411764706 & 0.549837316223697 & 185.890278358486 \tabularnewline
Winsorized Mean ( 21 / 28 ) & 102.234117647059 & 0.54002944452657 & 189.312117484047 \tabularnewline
Winsorized Mean ( 22 / 28 ) & 102.182352941176 & 0.533379312979284 & 191.575395698080 \tabularnewline
Winsorized Mean ( 23 / 28 ) & 102.344705882353 & 0.505101442739546 & 202.622081867873 \tabularnewline
Winsorized Mean ( 24 / 28 ) & 102.344705882353 & 0.483476282972668 & 211.685059819447 \tabularnewline
Winsorized Mean ( 25 / 28 ) & 102.668235294118 & 0.436734802662118 & 235.081414781472 \tabularnewline
Winsorized Mean ( 26 / 28 ) & 102.637647058824 & 0.425332219701839 & 241.311714242512 \tabularnewline
Winsorized Mean ( 27 / 28 ) & 102.637647058824 & 0.417616205906597 & 245.770268507681 \tabularnewline
Winsorized Mean ( 28 / 28 ) & 102.769411764706 & 0.402687134949472 & 255.209076340621 \tabularnewline
Trimmed Mean ( 1 / 28 ) & 102.418072289157 & 0.817288839906177 & 125.314414302921 \tabularnewline
Trimmed Mean ( 2 / 28 ) & 102.412345679012 & 0.797626461036638 & 128.396374345344 \tabularnewline
Trimmed Mean ( 3 / 28 ) & 102.410126582278 & 0.77982012368608 & 131.325319098208 \tabularnewline
Trimmed Mean ( 4 / 28 ) & 102.398701298701 & 0.765791808080778 & 133.716109545925 \tabularnewline
Trimmed Mean ( 5 / 28 ) & 102.398666666667 & 0.753204549304565 & 135.950674702126 \tabularnewline
Trimmed Mean ( 6 / 28 ) & 102.412328767123 & 0.742442760544187 & 137.939696108099 \tabularnewline
Trimmed Mean ( 7 / 28 ) & 102.425352112676 & 0.730559495385023 & 140.201246797422 \tabularnewline
Trimmed Mean ( 8 / 28 ) & 102.437681159420 & 0.716717027065237 & 142.926255817969 \tabularnewline
Trimmed Mean ( 9 / 28 ) & 102.447761194030 & 0.701598479254383 & 146.020500647187 \tabularnewline
Trimmed Mean ( 10 / 28 ) & 102.436923076923 & 0.691335695866124 & 148.172477841734 \tabularnewline
Trimmed Mean ( 11 / 28 ) & 102.428571428571 & 0.680988365521445 & 150.411631996297 \tabularnewline
Trimmed Mean ( 12 / 28 ) & 102.419672131148 & 0.669037395412045 & 153.085123243477 \tabularnewline
Trimmed Mean ( 13 / 28 ) & 102.416949152542 & 0.657604674040215 & 155.742428841495 \tabularnewline
Trimmed Mean ( 14 / 28 ) & 102.408771929825 & 0.64466812925579 & 158.855025217465 \tabularnewline
Trimmed Mean ( 15 / 28 ) & 102.398181818182 & 0.631733710410723 & 162.090735591120 \tabularnewline
Trimmed Mean ( 16 / 28 ) & 102.369811320755 & 0.622238951539688 & 164.518487740839 \tabularnewline
Trimmed Mean ( 17 / 28 ) & 102.339215686275 & 0.609969966675458 & 167.777466559637 \tabularnewline
Trimmed Mean ( 18 / 28 ) & 102.304081632653 & 0.595732836182518 & 171.728122774333 \tabularnewline
Trimmed Mean ( 19 / 28 ) & 102.297872340426 & 0.587500777346718 & 174.123807635498 \tabularnewline
Trimmed Mean ( 20 / 28 ) & 102.306666666667 & 0.58138983600863 & 175.969135217472 \tabularnewline
Trimmed Mean ( 21 / 28 ) & 102.316279069767 & 0.573867320342632 & 178.292569454345 \tabularnewline
Trimmed Mean ( 22 / 28 ) & 102.324390243902 & 0.565197790631037 & 181.041737848371 \tabularnewline
Trimmed Mean ( 23 / 28 ) & 102.338461538462 & 0.554269593716295 & 184.636614922889 \tabularnewline
Trimmed Mean ( 24 / 28 ) & 102.337837837838 & 0.545171975392191 & 187.716615044669 \tabularnewline
Trimmed Mean ( 25 / 28 ) & 102.337142857143 & 0.536751600754357 & 190.660153995474 \tabularnewline
Trimmed Mean ( 26 / 28 ) & 102.303030303030 & 0.534482985252416 & 191.405588439296 \tabularnewline
Trimmed Mean ( 27 / 28 ) & 102.267741935484 & 0.531975161049497 & 192.241573335354 \tabularnewline
Trimmed Mean ( 28 / 28 ) & 102.227586206897 & 0.527959557520689 & 193.627683694107 \tabularnewline
Median & 101.4 &  &  \tabularnewline
Midrange & 102.35 &  &  \tabularnewline
Midmean - Weighted Average at Xnp & 102.178571428571 &  &  \tabularnewline
Midmean - Weighted Average at X(n+1)p & 102.316279069767 &  &  \tabularnewline
Midmean - Empirical Distribution Function & 102.316279069767 &  &  \tabularnewline
Midmean - Empirical Distribution Function - Averaging & 102.316279069767 &  &  \tabularnewline
Midmean - Empirical Distribution Function - Interpolation & 102.316279069767 &  &  \tabularnewline
Midmean - Closest Observation & 102.172727272727 &  &  \tabularnewline
Midmean - True Basic - Statistics Graphics Toolkit & 102.316279069767 &  &  \tabularnewline
Midmean - MS Excel (old versions) & 102.316279069767 &  &  \tabularnewline
Number of observations & 85 &  &  \tabularnewline
\hline
\end{tabular}
%Source: https://freestatistics.org/blog/index.php?pk=29313&T=1

[TABLE]
[ROW][C]Central Tendency - Ungrouped Data[/C][/ROW]
[ROW][C]Measure[/C][C]Value[/C][C]S.E.[/C][C]Value/S.E.[/C][/ROW]
[ROW][C]Arithmetic Mean[/C][C]102.416470588235[/C][C]0.840357812045329[/C][C]121.872456137423[/C][/ROW]
[ROW][C]Geometric Mean[/C][C]102.125951119340[/C][C][/C][C][/C][/ROW]
[ROW][C]Harmonic Mean[/C][C]101.834857409753[/C][C][/C][C][/C][/ROW]
[ROW][C]Quadratic Mean[/C][C]102.705668553109[/C][C][/C][C][/C][/ROW]
[ROW][C]Winsorized Mean ( 1 / 28 )[/C][C]102.423529411765[/C][C]0.83428401860169[/C][C]122.768178615518[/C][/ROW]
[ROW][C]Winsorized Mean ( 2 / 28 )[/C][C]102.416470588235[/C][C]0.826166685555424[/C][C]123.965868363939[/C][/ROW]
[ROW][C]Winsorized Mean ( 3 / 28 )[/C][C]102.441176470588[/C][C]0.810758012573044[/C][C]126.352345437177[/C][/ROW]
[ROW][C]Winsorized Mean ( 4 / 28 )[/C][C]102.398823529412[/C][C]0.79957182890172[/C][C]128.067072685721[/C][/ROW]
[ROW][C]Winsorized Mean ( 5 / 28 )[/C][C]102.34[/C][C]0.785477784625419[/C][C]130.290126599576[/C][/ROW]
[ROW][C]Winsorized Mean ( 6 / 28 )[/C][C]102.347058823529[/C][C]0.781854056307806[/C][C]130.903022114957[/C][/ROW]
[ROW][C]Winsorized Mean ( 7 / 28 )[/C][C]102.355294117647[/C][C]0.780423116371379[/C][C]131.153590879719[/C][/ROW]
[ROW][C]Winsorized Mean ( 8 / 28 )[/C][C]102.374117647059[/C][C]0.774047083703834[/C][C]132.258256380473[/C][/ROW]
[ROW][C]Winsorized Mean ( 9 / 28 )[/C][C]102.522352941176[/C][C]0.736414541320522[/C][C]139.218262525528[/C][/ROW]
[ROW][C]Winsorized Mean ( 10 / 28 )[/C][C]102.498823529412[/C][C]0.72534256200937[/C][C]141.310918313501[/C][/ROW]
[ROW][C]Winsorized Mean ( 11 / 28 )[/C][C]102.498823529412[/C][C]0.721359776741406[/C][C]142.091126833311[/C][/ROW]
[ROW][C]Winsorized Mean ( 12 / 28 )[/C][C]102.442352941176[/C][C]0.704070550622414[/C][C]145.500124739794[/C][/ROW]
[ROW][C]Winsorized Mean ( 13 / 28 )[/C][C]102.488235294118[/C][C]0.697276437801724[/C][C]146.98364914958[/C][/ROW]
[ROW][C]Winsorized Mean ( 14 / 28 )[/C][C]102.504705882353[/C][C]0.68023909514318[/C][C]150.689230616446[/C][/ROW]
[ROW][C]Winsorized Mean ( 15 / 28 )[/C][C]102.663529411765[/C][C]0.64299031593272[/C][C]159.665747473726[/C][/ROW]
[ROW][C]Winsorized Mean ( 16 / 28 )[/C][C]102.663529411765[/C][C]0.64299031593272[/C][C]159.665747473726[/C][/ROW]
[ROW][C]Winsorized Mean ( 17 / 28 )[/C][C]102.683529411765[/C][C]0.63470773851438[/C][C]161.780805843189[/C][/ROW]
[ROW][C]Winsorized Mean ( 18 / 28 )[/C][C]102.365882352941[/C][C]0.583043672639517[/C][C]175.571551766469[/C][/ROW]
[ROW][C]Winsorized Mean ( 19 / 28 )[/C][C]102.209411764706[/C][C]0.556068188817341[/C][C]183.807334820010[/C][/ROW]
[ROW][C]Winsorized Mean ( 20 / 28 )[/C][C]102.209411764706[/C][C]0.549837316223697[/C][C]185.890278358486[/C][/ROW]
[ROW][C]Winsorized Mean ( 21 / 28 )[/C][C]102.234117647059[/C][C]0.54002944452657[/C][C]189.312117484047[/C][/ROW]
[ROW][C]Winsorized Mean ( 22 / 28 )[/C][C]102.182352941176[/C][C]0.533379312979284[/C][C]191.575395698080[/C][/ROW]
[ROW][C]Winsorized Mean ( 23 / 28 )[/C][C]102.344705882353[/C][C]0.505101442739546[/C][C]202.622081867873[/C][/ROW]
[ROW][C]Winsorized Mean ( 24 / 28 )[/C][C]102.344705882353[/C][C]0.483476282972668[/C][C]211.685059819447[/C][/ROW]
[ROW][C]Winsorized Mean ( 25 / 28 )[/C][C]102.668235294118[/C][C]0.436734802662118[/C][C]235.081414781472[/C][/ROW]
[ROW][C]Winsorized Mean ( 26 / 28 )[/C][C]102.637647058824[/C][C]0.425332219701839[/C][C]241.311714242512[/C][/ROW]
[ROW][C]Winsorized Mean ( 27 / 28 )[/C][C]102.637647058824[/C][C]0.417616205906597[/C][C]245.770268507681[/C][/ROW]
[ROW][C]Winsorized Mean ( 28 / 28 )[/C][C]102.769411764706[/C][C]0.402687134949472[/C][C]255.209076340621[/C][/ROW]
[ROW][C]Trimmed Mean ( 1 / 28 )[/C][C]102.418072289157[/C][C]0.817288839906177[/C][C]125.314414302921[/C][/ROW]
[ROW][C]Trimmed Mean ( 2 / 28 )[/C][C]102.412345679012[/C][C]0.797626461036638[/C][C]128.396374345344[/C][/ROW]
[ROW][C]Trimmed Mean ( 3 / 28 )[/C][C]102.410126582278[/C][C]0.77982012368608[/C][C]131.325319098208[/C][/ROW]
[ROW][C]Trimmed Mean ( 4 / 28 )[/C][C]102.398701298701[/C][C]0.765791808080778[/C][C]133.716109545925[/C][/ROW]
[ROW][C]Trimmed Mean ( 5 / 28 )[/C][C]102.398666666667[/C][C]0.753204549304565[/C][C]135.950674702126[/C][/ROW]
[ROW][C]Trimmed Mean ( 6 / 28 )[/C][C]102.412328767123[/C][C]0.742442760544187[/C][C]137.939696108099[/C][/ROW]
[ROW][C]Trimmed Mean ( 7 / 28 )[/C][C]102.425352112676[/C][C]0.730559495385023[/C][C]140.201246797422[/C][/ROW]
[ROW][C]Trimmed Mean ( 8 / 28 )[/C][C]102.437681159420[/C][C]0.716717027065237[/C][C]142.926255817969[/C][/ROW]
[ROW][C]Trimmed Mean ( 9 / 28 )[/C][C]102.447761194030[/C][C]0.701598479254383[/C][C]146.020500647187[/C][/ROW]
[ROW][C]Trimmed Mean ( 10 / 28 )[/C][C]102.436923076923[/C][C]0.691335695866124[/C][C]148.172477841734[/C][/ROW]
[ROW][C]Trimmed Mean ( 11 / 28 )[/C][C]102.428571428571[/C][C]0.680988365521445[/C][C]150.411631996297[/C][/ROW]
[ROW][C]Trimmed Mean ( 12 / 28 )[/C][C]102.419672131148[/C][C]0.669037395412045[/C][C]153.085123243477[/C][/ROW]
[ROW][C]Trimmed Mean ( 13 / 28 )[/C][C]102.416949152542[/C][C]0.657604674040215[/C][C]155.742428841495[/C][/ROW]
[ROW][C]Trimmed Mean ( 14 / 28 )[/C][C]102.408771929825[/C][C]0.64466812925579[/C][C]158.855025217465[/C][/ROW]
[ROW][C]Trimmed Mean ( 15 / 28 )[/C][C]102.398181818182[/C][C]0.631733710410723[/C][C]162.090735591120[/C][/ROW]
[ROW][C]Trimmed Mean ( 16 / 28 )[/C][C]102.369811320755[/C][C]0.622238951539688[/C][C]164.518487740839[/C][/ROW]
[ROW][C]Trimmed Mean ( 17 / 28 )[/C][C]102.339215686275[/C][C]0.609969966675458[/C][C]167.777466559637[/C][/ROW]
[ROW][C]Trimmed Mean ( 18 / 28 )[/C][C]102.304081632653[/C][C]0.595732836182518[/C][C]171.728122774333[/C][/ROW]
[ROW][C]Trimmed Mean ( 19 / 28 )[/C][C]102.297872340426[/C][C]0.587500777346718[/C][C]174.123807635498[/C][/ROW]
[ROW][C]Trimmed Mean ( 20 / 28 )[/C][C]102.306666666667[/C][C]0.58138983600863[/C][C]175.969135217472[/C][/ROW]
[ROW][C]Trimmed Mean ( 21 / 28 )[/C][C]102.316279069767[/C][C]0.573867320342632[/C][C]178.292569454345[/C][/ROW]
[ROW][C]Trimmed Mean ( 22 / 28 )[/C][C]102.324390243902[/C][C]0.565197790631037[/C][C]181.041737848371[/C][/ROW]
[ROW][C]Trimmed Mean ( 23 / 28 )[/C][C]102.338461538462[/C][C]0.554269593716295[/C][C]184.636614922889[/C][/ROW]
[ROW][C]Trimmed Mean ( 24 / 28 )[/C][C]102.337837837838[/C][C]0.545171975392191[/C][C]187.716615044669[/C][/ROW]
[ROW][C]Trimmed Mean ( 25 / 28 )[/C][C]102.337142857143[/C][C]0.536751600754357[/C][C]190.660153995474[/C][/ROW]
[ROW][C]Trimmed Mean ( 26 / 28 )[/C][C]102.303030303030[/C][C]0.534482985252416[/C][C]191.405588439296[/C][/ROW]
[ROW][C]Trimmed Mean ( 27 / 28 )[/C][C]102.267741935484[/C][C]0.531975161049497[/C][C]192.241573335354[/C][/ROW]
[ROW][C]Trimmed Mean ( 28 / 28 )[/C][C]102.227586206897[/C][C]0.527959557520689[/C][C]193.627683694107[/C][/ROW]
[ROW][C]Median[/C][C]101.4[/C][C][/C][C][/C][/ROW]
[ROW][C]Midrange[/C][C]102.35[/C][C][/C][C][/C][/ROW]
[ROW][C]Midmean - Weighted Average at Xnp[/C][C]102.178571428571[/C][C][/C][C][/C][/ROW]
[ROW][C]Midmean - Weighted Average at X(n+1)p[/C][C]102.316279069767[/C][C][/C][C][/C][/ROW]
[ROW][C]Midmean - Empirical Distribution Function[/C][C]102.316279069767[/C][C][/C][C][/C][/ROW]
[ROW][C]Midmean - Empirical Distribution Function - Averaging[/C][C]102.316279069767[/C][C][/C][C][/C][/ROW]
[ROW][C]Midmean - Empirical Distribution Function - Interpolation[/C][C]102.316279069767[/C][C][/C][C][/C][/ROW]
[ROW][C]Midmean - Closest Observation[/C][C]102.172727272727[/C][C][/C][C][/C][/ROW]
[ROW][C]Midmean - True Basic - Statistics Graphics Toolkit[/C][C]102.316279069767[/C][C][/C][C][/C][/ROW]
[ROW][C]Midmean - MS Excel (old versions)[/C][C]102.316279069767[/C][C][/C][C][/C][/ROW]
[ROW][C]Number of observations[/C][C]85[/C][C][/C][C][/C][/ROW]
[/TABLE]
Source: https://freestatistics.org/blog/index.php?pk=29313&T=1

Globally Unique Identifier (entire table): ba.freestatistics.org/blog/index.php?pk=29313&T=1

As an alternative you can also use a QR Code:  

The GUIDs for individual cells are displayed in the table below:

Central Tendency - Ungrouped Data
MeasureValueS.E.Value/S.E.
Arithmetic Mean102.4164705882350.840357812045329121.872456137423
Geometric Mean102.125951119340
Harmonic Mean101.834857409753
Quadratic Mean102.705668553109
Winsorized Mean ( 1 / 28 )102.4235294117650.83428401860169122.768178615518
Winsorized Mean ( 2 / 28 )102.4164705882350.826166685555424123.965868363939
Winsorized Mean ( 3 / 28 )102.4411764705880.810758012573044126.352345437177
Winsorized Mean ( 4 / 28 )102.3988235294120.79957182890172128.067072685721
Winsorized Mean ( 5 / 28 )102.340.785477784625419130.290126599576
Winsorized Mean ( 6 / 28 )102.3470588235290.781854056307806130.903022114957
Winsorized Mean ( 7 / 28 )102.3552941176470.780423116371379131.153590879719
Winsorized Mean ( 8 / 28 )102.3741176470590.774047083703834132.258256380473
Winsorized Mean ( 9 / 28 )102.5223529411760.736414541320522139.218262525528
Winsorized Mean ( 10 / 28 )102.4988235294120.72534256200937141.310918313501
Winsorized Mean ( 11 / 28 )102.4988235294120.721359776741406142.091126833311
Winsorized Mean ( 12 / 28 )102.4423529411760.704070550622414145.500124739794
Winsorized Mean ( 13 / 28 )102.4882352941180.697276437801724146.98364914958
Winsorized Mean ( 14 / 28 )102.5047058823530.68023909514318150.689230616446
Winsorized Mean ( 15 / 28 )102.6635294117650.64299031593272159.665747473726
Winsorized Mean ( 16 / 28 )102.6635294117650.64299031593272159.665747473726
Winsorized Mean ( 17 / 28 )102.6835294117650.63470773851438161.780805843189
Winsorized Mean ( 18 / 28 )102.3658823529410.583043672639517175.571551766469
Winsorized Mean ( 19 / 28 )102.2094117647060.556068188817341183.807334820010
Winsorized Mean ( 20 / 28 )102.2094117647060.549837316223697185.890278358486
Winsorized Mean ( 21 / 28 )102.2341176470590.54002944452657189.312117484047
Winsorized Mean ( 22 / 28 )102.1823529411760.533379312979284191.575395698080
Winsorized Mean ( 23 / 28 )102.3447058823530.505101442739546202.622081867873
Winsorized Mean ( 24 / 28 )102.3447058823530.483476282972668211.685059819447
Winsorized Mean ( 25 / 28 )102.6682352941180.436734802662118235.081414781472
Winsorized Mean ( 26 / 28 )102.6376470588240.425332219701839241.311714242512
Winsorized Mean ( 27 / 28 )102.6376470588240.417616205906597245.770268507681
Winsorized Mean ( 28 / 28 )102.7694117647060.402687134949472255.209076340621
Trimmed Mean ( 1 / 28 )102.4180722891570.817288839906177125.314414302921
Trimmed Mean ( 2 / 28 )102.4123456790120.797626461036638128.396374345344
Trimmed Mean ( 3 / 28 )102.4101265822780.77982012368608131.325319098208
Trimmed Mean ( 4 / 28 )102.3987012987010.765791808080778133.716109545925
Trimmed Mean ( 5 / 28 )102.3986666666670.753204549304565135.950674702126
Trimmed Mean ( 6 / 28 )102.4123287671230.742442760544187137.939696108099
Trimmed Mean ( 7 / 28 )102.4253521126760.730559495385023140.201246797422
Trimmed Mean ( 8 / 28 )102.4376811594200.716717027065237142.926255817969
Trimmed Mean ( 9 / 28 )102.4477611940300.701598479254383146.020500647187
Trimmed Mean ( 10 / 28 )102.4369230769230.691335695866124148.172477841734
Trimmed Mean ( 11 / 28 )102.4285714285710.680988365521445150.411631996297
Trimmed Mean ( 12 / 28 )102.4196721311480.669037395412045153.085123243477
Trimmed Mean ( 13 / 28 )102.4169491525420.657604674040215155.742428841495
Trimmed Mean ( 14 / 28 )102.4087719298250.64466812925579158.855025217465
Trimmed Mean ( 15 / 28 )102.3981818181820.631733710410723162.090735591120
Trimmed Mean ( 16 / 28 )102.3698113207550.622238951539688164.518487740839
Trimmed Mean ( 17 / 28 )102.3392156862750.609969966675458167.777466559637
Trimmed Mean ( 18 / 28 )102.3040816326530.595732836182518171.728122774333
Trimmed Mean ( 19 / 28 )102.2978723404260.587500777346718174.123807635498
Trimmed Mean ( 20 / 28 )102.3066666666670.58138983600863175.969135217472
Trimmed Mean ( 21 / 28 )102.3162790697670.573867320342632178.292569454345
Trimmed Mean ( 22 / 28 )102.3243902439020.565197790631037181.041737848371
Trimmed Mean ( 23 / 28 )102.3384615384620.554269593716295184.636614922889
Trimmed Mean ( 24 / 28 )102.3378378378380.545171975392191187.716615044669
Trimmed Mean ( 25 / 28 )102.3371428571430.536751600754357190.660153995474
Trimmed Mean ( 26 / 28 )102.3030303030300.534482985252416191.405588439296
Trimmed Mean ( 27 / 28 )102.2677419354840.531975161049497192.241573335354
Trimmed Mean ( 28 / 28 )102.2275862068970.527959557520689193.627683694107
Median101.4
Midrange102.35
Midmean - Weighted Average at Xnp102.178571428571
Midmean - Weighted Average at X(n+1)p102.316279069767
Midmean - Empirical Distribution Function102.316279069767
Midmean - Empirical Distribution Function - Averaging102.316279069767
Midmean - Empirical Distribution Function - Interpolation102.316279069767
Midmean - Closest Observation102.172727272727
Midmean - True Basic - Statistics Graphics Toolkit102.316279069767
Midmean - MS Excel (old versions)102.316279069767
Number of observations85


Parameters (Session):
Parameters (R input):
R code (references can be found in the software module):
geomean <- function(x) {
return(exp(mean(log(x))))
}
harmean <- function(x) {
return(1/mean(1/x))
}
quamean <- function(x) {
return(sqrt(mean(x*x)))
}
winmean <- function(x) {
x <-sort(x[!is.na(x)])
n<-length(x)
denom <- 3
nodenom <- n/denom
if (nodenom>40) denom <- n/40
sqrtn = sqrt(n)
roundnodenom = floor(nodenom)
win <- array(NA,dim=c(roundnodenom,2))
for (j in 1:roundnodenom) {
win[j,1] <- (j*x[j+1]+sum(x[(j+1):(n-j)])+j*x[n-j])/n
win[j,2] <- sd(c(rep(x[j+1],j),x[(j+1):(n-j)],rep(x[n-j],j)))/sqrtn
}
return(win)
}
trimean <- function(x) {
x <-sort(x[!is.na(x)])
n<-length(x)
denom <- 3
nodenom <- n/denom
if (nodenom>40) denom <- n/40
sqrtn = sqrt(n)
roundnodenom = floor(nodenom)
tri <- array(NA,dim=c(roundnodenom,2))
for (j in 1:roundnodenom) {
tri[j,1] <- mean(x,trim=j/n)
tri[j,2] <- sd(x[(j+1):(n-j)]) / sqrt(n-j*2)
}
return(tri)
}
midrange <- function(x) {
return((max(x)+min(x))/2)
}
q1 <- function(data,n,p,i,f) {
np <- n*p;
i <<- floor(np)
f <<- np - i
qvalue <- (1-f)*data[i] + f*data[i+1]
}
q2 <- function(data,n,p,i,f) {
np <- (n+1)*p
i <<- floor(np)
f <<- np - i
qvalue <- (1-f)*data[i] + f*data[i+1]
}
q3 <- function(data,n,p,i,f) {
np <- n*p
i <<- floor(np)
f <<- np - i
if (f==0) {
qvalue <- data[i]
} else {
qvalue <- data[i+1]
}
}
q4 <- function(data,n,p,i,f) {
np <- n*p
i <<- floor(np)
f <<- np - i
if (f==0) {
qvalue <- (data[i]+data[i+1])/2
} else {
qvalue <- data[i+1]
}
}
q5 <- function(data,n,p,i,f) {
np <- (n-1)*p
i <<- floor(np)
f <<- np - i
if (f==0) {
qvalue <- data[i+1]
} else {
qvalue <- data[i+1] + f*(data[i+2]-data[i+1])
}
}
q6 <- function(data,n,p,i,f) {
np <- n*p+0.5
i <<- floor(np)
f <<- np - i
qvalue <- data[i]
}
q7 <- function(data,n,p,i,f) {
np <- (n+1)*p
i <<- floor(np)
f <<- np - i
if (f==0) {
qvalue <- data[i]
} else {
qvalue <- f*data[i] + (1-f)*data[i+1]
}
}
q8 <- function(data,n,p,i,f) {
np <- (n+1)*p
i <<- floor(np)
f <<- np - i
if (f==0) {
qvalue <- data[i]
} else {
if (f == 0.5) {
qvalue <- (data[i]+data[i+1])/2
} else {
if (f < 0.5) {
qvalue <- data[i]
} else {
qvalue <- data[i+1]
}
}
}
}
midmean <- function(x,def) {
x <-sort(x[!is.na(x)])
n<-length(x)
if (def==1) {
qvalue1 <- q1(x,n,0.25,i,f)
qvalue3 <- q1(x,n,0.75,i,f)
}
if (def==2) {
qvalue1 <- q2(x,n,0.25,i,f)
qvalue3 <- q2(x,n,0.75,i,f)
}
if (def==3) {
qvalue1 <- q3(x,n,0.25,i,f)
qvalue3 <- q3(x,n,0.75,i,f)
}
if (def==4) {
qvalue1 <- q4(x,n,0.25,i,f)
qvalue3 <- q4(x,n,0.75,i,f)
}
if (def==5) {
qvalue1 <- q5(x,n,0.25,i,f)
qvalue3 <- q5(x,n,0.75,i,f)
}
if (def==6) {
qvalue1 <- q6(x,n,0.25,i,f)
qvalue3 <- q6(x,n,0.75,i,f)
}
if (def==7) {
qvalue1 <- q7(x,n,0.25,i,f)
qvalue3 <- q7(x,n,0.75,i,f)
}
if (def==8) {
qvalue1 <- q8(x,n,0.25,i,f)
qvalue3 <- q8(x,n,0.75,i,f)
}
midm <- 0
myn <- 0
roundno4 <- round(n/4)
round3no4 <- round(3*n/4)
for (i in 1:n) {
if ((x[i]>=qvalue1) & (x[i]<=qvalue3)){
midm = midm + x[i]
myn = myn + 1
}
}
midm = midm / myn
return(midm)
}
(arm <- mean(x))
sqrtn <- sqrt(length(x))
(armse <- sd(x) / sqrtn)
(armose <- arm / armse)
(geo <- geomean(x))
(har <- harmean(x))
(qua <- quamean(x))
(win <- winmean(x))
(tri <- trimean(x))
(midr <- midrange(x))
midm <- array(NA,dim=8)
for (j in 1:8) midm[j] <- midmean(x,j)
midm
bitmap(file='test1.png')
lb <- win[,1] - 2*win[,2]
ub <- win[,1] + 2*win[,2]
if ((ylimmin == '') | (ylimmax == '')) plot(win[,1],type='b',main=main, xlab='j', pch=19, ylab='Winsorized Mean(j/n)', ylim=c(min(lb),max(ub))) else plot(win[,1],type='l',main=main, xlab='j', pch=19, ylab='Winsorized Mean(j/n)', ylim=c(ylimmin,ylimmax))
lines(ub,lty=3)
lines(lb,lty=3)
grid()
dev.off()
bitmap(file='test2.png')
lb <- tri[,1] - 2*tri[,2]
ub <- tri[,1] + 2*tri[,2]
if ((ylimmin == '') | (ylimmax == '')) plot(tri[,1],type='b',main=main, xlab='j', pch=19, ylab='Trimmed Mean(j/n)', ylim=c(min(lb),max(ub))) else plot(tri[,1],type='l',main=main, xlab='j', pch=19, ylab='Trimmed Mean(j/n)', ylim=c(ylimmin,ylimmax))
lines(ub,lty=3)
lines(lb,lty=3)
grid()
dev.off()
load(file='createtable')
a<-table.start()
a<-table.row.start(a)
a<-table.element(a,'Central Tendency - Ungrouped Data',4,TRUE)
a<-table.row.end(a)
a<-table.row.start(a)
a<-table.element(a,'Measure',header=TRUE)
a<-table.element(a,'Value',header=TRUE)
a<-table.element(a,'S.E.',header=TRUE)
a<-table.element(a,'Value/S.E.',header=TRUE)
a<-table.row.end(a)
a<-table.row.start(a)
a<-table.element(a,hyperlink('arithmetic_mean.htm', 'Arithmetic Mean', 'click to view the definition of the Arithmetic Mean'),header=TRUE)
a<-table.element(a,arm)
a<-table.element(a,hyperlink('arithmetic_mean_standard_error.htm', armse, 'click to view the definition of the Standard Error of the Arithmetic Mean'))
a<-table.element(a,armose)
a<-table.row.end(a)
a<-table.row.start(a)
a<-table.element(a,hyperlink('geometric_mean.htm', 'Geometric Mean', 'click to view the definition of the Geometric Mean'),header=TRUE)
a<-table.element(a,geo)
a<-table.element(a,'')
a<-table.row.end(a)
a<-table.row.start(a)
a<-table.element(a,hyperlink('harmonic_mean.htm', 'Harmonic Mean', 'click to view the definition of the Harmonic Mean'),header=TRUE)
a<-table.element(a,har)
a<-table.element(a,'')
a<-table.row.end(a)
a<-table.row.start(a)
a<-table.element(a,hyperlink('quadratic_mean.htm', 'Quadratic Mean', 'click to view the definition of the Quadratic Mean'),header=TRUE)
a<-table.element(a,qua)
a<-table.element(a,'')
a<-table.row.end(a)
for (j in 1:length(win[,1])) {
a<-table.row.start(a)
mylabel <- paste('Winsorized Mean (',j)
mylabel <- paste(mylabel,'/')
mylabel <- paste(mylabel,length(win[,1]))
mylabel <- paste(mylabel,')')
a<-table.element(a,hyperlink('winsorized_mean.htm', mylabel, 'click to view the definition of the Winsorized Mean'),header=TRUE)
a<-table.element(a,win[j,1])
a<-table.element(a,win[j,2])
a<-table.element(a,win[j,1]/win[j,2])
a<-table.row.end(a)
}
for (j in 1:length(tri[,1])) {
a<-table.row.start(a)
mylabel <- paste('Trimmed Mean (',j)
mylabel <- paste(mylabel,'/')
mylabel <- paste(mylabel,length(tri[,1]))
mylabel <- paste(mylabel,')')
a<-table.element(a,hyperlink('arithmetic_mean.htm', mylabel, 'click to view the definition of the Trimmed Mean'),header=TRUE)
a<-table.element(a,tri[j,1])
a<-table.element(a,tri[j,2])
a<-table.element(a,tri[j,1]/tri[j,2])
a<-table.row.end(a)
}
a<-table.row.start(a)
a<-table.element(a,hyperlink('median_1.htm', 'Median', 'click to view the definition of the Median'),header=TRUE)
a<-table.element(a,median(x))
a<-table.element(a,'')
a<-table.row.end(a)
a<-table.row.start(a)
a<-table.element(a,hyperlink('midrange.htm', 'Midrange', 'click to view the definition of the Midrange'),header=TRUE)
a<-table.element(a,midr)
a<-table.element(a,'')
a<-table.row.end(a)
a<-table.row.start(a)
mymid <- hyperlink('midmean.htm', 'Midmean', 'click to view the definition of the Midmean')
mylabel <- paste(mymid,hyperlink('method_1.htm','Weighted Average at Xnp',''),sep=' - ')
a<-table.element(a,mylabel,header=TRUE)
a<-table.element(a,midm[1])
a<-table.element(a,'')
a<-table.row.end(a)
a<-table.row.start(a)
mymid <- hyperlink('midmean.htm', 'Midmean', 'click to view the definition of the Midmean')
mylabel <- paste(mymid,hyperlink('method_2.htm','Weighted Average at X(n+1)p',''),sep=' - ')
a<-table.element(a,mylabel,header=TRUE)
a<-table.element(a,midm[2])
a<-table.element(a,'')
a<-table.row.end(a)
a<-table.row.start(a)
mymid <- hyperlink('midmean.htm', 'Midmean', 'click to view the definition of the Midmean')
mylabel <- paste(mymid,hyperlink('method_3.htm','Empirical Distribution Function',''),sep=' - ')
a<-table.element(a,mylabel,header=TRUE)
a<-table.element(a,midm[3])
a<-table.element(a,'')
a<-table.row.end(a)
a<-table.row.start(a)
mymid <- hyperlink('midmean.htm', 'Midmean', 'click to view the definition of the Midmean')
mylabel <- paste(mymid,hyperlink('method_4.htm','Empirical Distribution Function - Averaging',''),sep=' - ')
a<-table.element(a,mylabel,header=TRUE)
a<-table.element(a,midm[4])
a<-table.element(a,'')
a<-table.row.end(a)
a<-table.row.start(a)
mymid <- hyperlink('midmean.htm', 'Midmean', 'click to view the definition of the Midmean')
mylabel <- paste(mymid,hyperlink('method_5.htm','Empirical Distribution Function - Interpolation',''),sep=' - ')
a<-table.element(a,mylabel,header=TRUE)
a<-table.element(a,midm[5])
a<-table.element(a,'')
a<-table.row.end(a)
a<-table.row.start(a)
mymid <- hyperlink('midmean.htm', 'Midmean', 'click to view the definition of the Midmean')
mylabel <- paste(mymid,hyperlink('method_6.htm','Closest Observation',''),sep=' - ')
a<-table.element(a,mylabel,header=TRUE)
a<-table.element(a,midm[6])
a<-table.element(a,'')
a<-table.row.end(a)
a<-table.row.start(a)
mymid <- hyperlink('midmean.htm', 'Midmean', 'click to view the definition of the Midmean')
mylabel <- paste(mymid,hyperlink('method_7.htm','True Basic - Statistics Graphics Toolkit',''),sep=' - ')
a<-table.element(a,mylabel,header=TRUE)
a<-table.element(a,midm[7])
a<-table.element(a,'')
a<-table.row.end(a)
a<-table.row.start(a)
mymid <- hyperlink('midmean.htm', 'Midmean', 'click to view the definition of the Midmean')
mylabel <- paste(mymid,hyperlink('method_8.htm','MS Excel (old versions)',''),sep=' - ')
a<-table.element(a,mylabel,header=TRUE)
a<-table.element(a,midm[8])
a<-table.element(a,'')
a<-table.row.end(a)
a<-table.row.start(a)
a<-table.element(a,'Number of observations',header=TRUE)
a<-table.element(a,length(x))
a<-table.element(a,'')
a<-table.row.end(a)
a<-table.end(a)
table.save(a,file='mytable.tab')