Free Statistics

of Irreproducible Research!

Author's title

Author*The author of this computation has been verified*
R Software Modulerwasp_multipleregression.wasp
Title produced by softwareMultiple Regression
Date of computationFri, 05 Dec 2008 08:10:56 -0700
Cite this page as followsStatistical Computations at FreeStatistics.org, Office for Research Development and Education, URL https://freestatistics.org/blog/index.php?v=date/2008/Dec/05/t1228490437zidds7yjd9aslym.htm/, Retrieved Thu, 16 May 2024 03:34:46 +0000
Statistical Computations at FreeStatistics.org, Office for Research Development and Education, URL https://freestatistics.org/blog/index.php?pk=29312, Retrieved Thu, 16 May 2024 03:34:46 +0000
QR Codes:

Original text written by user:
IsPrivate?No (this computation is public)
User-defined keywords
Estimated Impact183
Family? (F = Feedback message, R = changed R code, M = changed R Module, P = changed Parameters, D = changed Data)
-       [Multiple Regression] [] [2008-12-05 15:10:56] [4127a50d3937d4bda99dae34ed7ecdc5] [Current]
Feedback Forum

Post a new message
Dataseries X:
95.2	0
95.00	0
94.00	0
92.2	0
91.00	0
91.2	0
103.4	1
105.00	0
104.6	0
103.8	0
101.8	0
102.4	0
103.8	0
103.4	0
102.00	0
101.8	0
100.2	0
101.4	0
113.8	0
116.00	0
115.6	0
113.00	0
109.4	0
111.00	0
112.4	0
112.2	0
111.00	0
108.8	0
107.4	0
108.6	0
118.8	0
122.2	1
122.6	0
122.2	0
118.8	0
119.00	0
118.2	0
117.8	0
116.8	0
114.6	0
113.4	0
113.8	0
124.2	0
125.8	0
125.6	0
122.4	0
119.00	0
119.4	0
118.6	0
118.00	0
116.00	0
114.8	0
114.6	0
114.6	0
124.00	0
125.2	0
124.00	0
117.6	1
113.2	0
111.4	0
112.2	0
109.8	0
106.4	0
105.2	0
102.2	0
99.8	0
111.00	0
113.00	0
108.4	0
105.4	0
102.00	0
102.8	0


Summary of computational transaction
Raw Inputview raw input (R code)
Raw Outputview raw output of R engine
Computing time3 seconds
R Server'Gwilym Jenkins' @ 72.249.127.135

\begin{tabular}{lllllllll}
\hline
Summary of computational transaction \tabularnewline
Raw Input & view raw input (R code)  \tabularnewline
Raw Output & view raw output of R engine  \tabularnewline
Computing time & 3 seconds \tabularnewline
R Server & 'Gwilym Jenkins' @ 72.249.127.135 \tabularnewline
\hline
\end{tabular}
%Source: https://freestatistics.org/blog/index.php?pk=29312&T=0

[TABLE]
[ROW][C]Summary of computational transaction[/C][/ROW]
[ROW][C]Raw Input[/C][C]view raw input (R code) [/C][/ROW]
[ROW][C]Raw Output[/C][C]view raw output of R engine [/C][/ROW]
[ROW][C]Computing time[/C][C]3 seconds[/C][/ROW]
[ROW][C]R Server[/C][C]'Gwilym Jenkins' @ 72.249.127.135[/C][/ROW]
[/TABLE]
Source: https://freestatistics.org/blog/index.php?pk=29312&T=0

Globally Unique Identifier (entire table): ba.freestatistics.org/blog/index.php?pk=29312&T=0

As an alternative you can also use a QR Code:  

The GUIDs for individual cells are displayed in the table below:

Summary of computational transaction
Raw Inputview raw input (R code)
Raw Outputview raw output of R engine
Computing time3 seconds
R Server'Gwilym Jenkins' @ 72.249.127.135


Multiple Linear Regression - Estimated Regression Equation
Werkloosheid[t] = + 110.623188405797 + 3.7768115942029Dumivariabele[t] + e[t]

\begin{tabular}{lllllllll}
\hline
Multiple Linear Regression - Estimated Regression Equation \tabularnewline
Werkloosheid[t] =  +  110.623188405797 +  3.7768115942029Dumivariabele[t]  + e[t] \tabularnewline
\hline
\end{tabular}
%Source: https://freestatistics.org/blog/index.php?pk=29312&T=1

[TABLE]
[ROW][C]Multiple Linear Regression - Estimated Regression Equation[/C][/ROW]
[ROW][C]Werkloosheid[t] =  +  110.623188405797 +  3.7768115942029Dumivariabele[t]  + e[t][/C][/ROW]
[/TABLE]
Source: https://freestatistics.org/blog/index.php?pk=29312&T=1

Globally Unique Identifier (entire table): ba.freestatistics.org/blog/index.php?pk=29312&T=1

As an alternative you can also use a QR Code:  

The GUIDs for individual cells are displayed in the table below:

Multiple Linear Regression - Estimated Regression Equation
Werkloosheid[t] = + 110.623188405797 + 3.7768115942029Dumivariabele[t] + e[t]


Multiple Linear Regression - Ordinary Least Squares
VariableParameterS.D.T-STATH0: parameter = 02-tail p-value1-tail p-value
(Intercept)110.6231884057971.079065102.517600
Dumivariabele3.77681159420295.2863180.71450.4773250.238662

\begin{tabular}{lllllllll}
\hline
Multiple Linear Regression - Ordinary Least Squares \tabularnewline
Variable & Parameter & S.D. & T-STATH0: parameter = 0 & 2-tail p-value & 1-tail p-value \tabularnewline
(Intercept) & 110.623188405797 & 1.079065 & 102.5176 & 0 & 0 \tabularnewline
Dumivariabele & 3.7768115942029 & 5.286318 & 0.7145 & 0.477325 & 0.238662 \tabularnewline
\hline
\end{tabular}
%Source: https://freestatistics.org/blog/index.php?pk=29312&T=2

[TABLE]
[ROW][C]Multiple Linear Regression - Ordinary Least Squares[/C][/ROW]
[ROW][C]Variable[/C][C]Parameter[/C][C]S.D.[/C][C]T-STATH0: parameter = 0[/C][C]2-tail p-value[/C][C]1-tail p-value[/C][/ROW]
[ROW][C](Intercept)[/C][C]110.623188405797[/C][C]1.079065[/C][C]102.5176[/C][C]0[/C][C]0[/C][/ROW]
[ROW][C]Dumivariabele[/C][C]3.7768115942029[/C][C]5.286318[/C][C]0.7145[/C][C]0.477325[/C][C]0.238662[/C][/ROW]
[/TABLE]
Source: https://freestatistics.org/blog/index.php?pk=29312&T=2

Globally Unique Identifier (entire table): ba.freestatistics.org/blog/index.php?pk=29312&T=2

As an alternative you can also use a QR Code:  

The GUIDs for individual cells are displayed in the table below:

Multiple Linear Regression - Ordinary Least Squares
VariableParameterS.D.T-STATH0: parameter = 02-tail p-value1-tail p-value
(Intercept)110.6231884057971.079065102.517600
Dumivariabele3.77681159420295.2863180.71450.4773250.238662


Multiple Linear Regression - Regression Statistics
Multiple R0.0850834970138966
R-squared0.00723920146411376
Adjusted R-squared-0.00694309565782736
F-TEST (value)0.510439275236597
F-TEST (DF numerator)1
F-TEST (DF denominator)70
p-value0.477324574359064
Multiple Linear Regression - Residual Statistics
Residual Standard Deviation8.96338814969837
Sum Squared Residuals5623.96289855072

\begin{tabular}{lllllllll}
\hline
Multiple Linear Regression - Regression Statistics \tabularnewline
Multiple R & 0.0850834970138966 \tabularnewline
R-squared & 0.00723920146411376 \tabularnewline
Adjusted R-squared & -0.00694309565782736 \tabularnewline
F-TEST (value) & 0.510439275236597 \tabularnewline
F-TEST (DF numerator) & 1 \tabularnewline
F-TEST (DF denominator) & 70 \tabularnewline
p-value & 0.477324574359064 \tabularnewline
Multiple Linear Regression - Residual Statistics \tabularnewline
Residual Standard Deviation & 8.96338814969837 \tabularnewline
Sum Squared Residuals & 5623.96289855072 \tabularnewline
\hline
\end{tabular}
%Source: https://freestatistics.org/blog/index.php?pk=29312&T=3

[TABLE]
[ROW][C]Multiple Linear Regression - Regression Statistics[/C][/ROW]
[ROW][C]Multiple R[/C][C]0.0850834970138966[/C][/ROW]
[ROW][C]R-squared[/C][C]0.00723920146411376[/C][/ROW]
[ROW][C]Adjusted R-squared[/C][C]-0.00694309565782736[/C][/ROW]
[ROW][C]F-TEST (value)[/C][C]0.510439275236597[/C][/ROW]
[ROW][C]F-TEST (DF numerator)[/C][C]1[/C][/ROW]
[ROW][C]F-TEST (DF denominator)[/C][C]70[/C][/ROW]
[ROW][C]p-value[/C][C]0.477324574359064[/C][/ROW]
[ROW][C]Multiple Linear Regression - Residual Statistics[/C][/ROW]
[ROW][C]Residual Standard Deviation[/C][C]8.96338814969837[/C][/ROW]
[ROW][C]Sum Squared Residuals[/C][C]5623.96289855072[/C][/ROW]
[/TABLE]
Source: https://freestatistics.org/blog/index.php?pk=29312&T=3

Globally Unique Identifier (entire table): ba.freestatistics.org/blog/index.php?pk=29312&T=3

As an alternative you can also use a QR Code:  

The GUIDs for individual cells are displayed in the table below:

Multiple Linear Regression - Regression Statistics
Multiple R0.0850834970138966
R-squared0.00723920146411376
Adjusted R-squared-0.00694309565782736
F-TEST (value)0.510439275236597
F-TEST (DF numerator)1
F-TEST (DF denominator)70
p-value0.477324574359064
Multiple Linear Regression - Residual Statistics
Residual Standard Deviation8.96338814969837
Sum Squared Residuals5623.96289855072


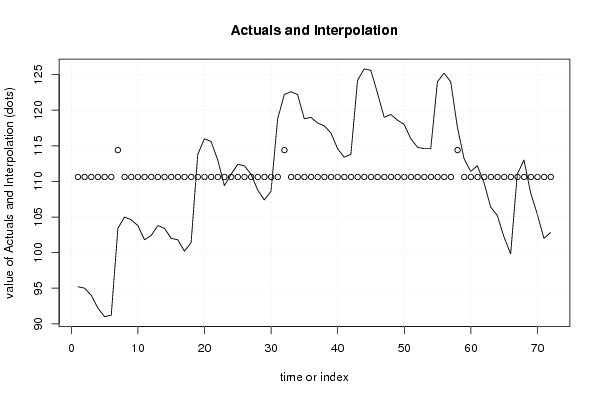
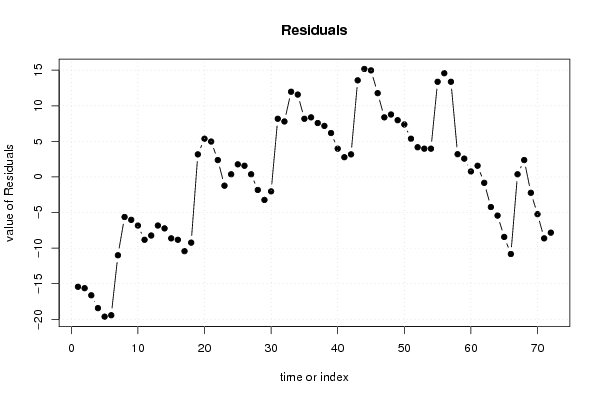
Multiple Linear Regression - Actuals, Interpolation, and Residuals
Time or IndexActualsInterpolationForecastResidualsPrediction Error
195.2110.623188405797-15.4231884057970
295110.623188405797-15.6231884057971
394110.623188405797-16.6231884057971
492.2110.623188405797-18.4231884057971
591110.623188405797-19.6231884057971
691.2110.623188405797-19.4231884057971
7103.4114.4-11.0000000000000
8105110.623188405797-5.6231884057971
9104.6110.623188405797-6.02318840579711
10103.8110.623188405797-6.8231884057971
11101.8110.623188405797-8.8231884057971
12102.4110.623188405797-8.2231884057971
13103.8110.623188405797-6.8231884057971
14103.4110.623188405797-7.2231884057971
15102110.623188405797-8.6231884057971
16101.8110.623188405797-8.8231884057971
17100.2110.623188405797-10.4231884057971
18101.4110.623188405797-9.2231884057971
19113.8110.6231884057973.17681159420289
20116110.6231884057975.3768115942029
21115.6110.6231884057974.97681159420289
22113110.6231884057972.37681159420290
23109.4110.623188405797-1.22318840579710
24111110.6231884057970.376811594202896
25112.4110.6231884057971.77681159420290
26112.2110.6231884057971.5768115942029
27111110.6231884057970.376811594202896
28108.8110.623188405797-1.82318840579711
29107.4110.623188405797-3.2231884057971
30108.6110.623188405797-2.02318840579711
31118.8110.6231884057978.1768115942029
32122.2114.47.79999999999998
33122.6110.62318840579711.9768115942029
34122.2110.62318840579711.5768115942029
35118.8110.6231884057978.1768115942029
36119110.6231884057978.3768115942029
37118.2110.6231884057977.5768115942029
38117.8110.6231884057977.1768115942029
39116.8110.6231884057976.1768115942029
40114.6110.6231884057973.97681159420289
41113.4110.6231884057972.7768115942029
42113.8110.6231884057973.17681159420289
43124.2110.62318840579713.5768115942029
44125.8110.62318840579715.1768115942029
45125.6110.62318840579714.9768115942029
46122.4110.62318840579711.7768115942029
47119110.6231884057978.3768115942029
48119.4110.6231884057978.7768115942029
49118.6110.6231884057977.97681159420289
50118110.6231884057977.3768115942029
51116110.6231884057975.3768115942029
52114.8110.6231884057974.17681159420289
53114.6110.6231884057973.97681159420289
54114.6110.6231884057973.97681159420289
55124110.62318840579713.3768115942029
56125.2110.62318840579714.5768115942029
57124110.62318840579713.3768115942029
58117.6114.43.19999999999997
59113.2110.6231884057972.5768115942029
60111.4110.6231884057970.776811594202902
61112.2110.6231884057971.5768115942029
62109.8110.623188405797-0.823188405797107
63106.4110.623188405797-4.2231884057971
64105.2110.623188405797-5.4231884057971
65102.2110.623188405797-8.4231884057971
6699.8110.623188405797-10.8231884057971
67111110.6231884057970.376811594202896
68113110.6231884057972.37681159420290
69108.4110.623188405797-2.22318840579710
70105.4110.623188405797-5.2231884057971
71102110.623188405797-8.6231884057971
72102.8110.623188405797-7.8231884057971

\begin{tabular}{lllllllll}
\hline
Multiple Linear Regression - Actuals, Interpolation, and Residuals \tabularnewline
Time or Index & Actuals & InterpolationForecast & ResidualsPrediction Error \tabularnewline
1 & 95.2 & 110.623188405797 & -15.4231884057970 \tabularnewline
2 & 95 & 110.623188405797 & -15.6231884057971 \tabularnewline
3 & 94 & 110.623188405797 & -16.6231884057971 \tabularnewline
4 & 92.2 & 110.623188405797 & -18.4231884057971 \tabularnewline
5 & 91 & 110.623188405797 & -19.6231884057971 \tabularnewline
6 & 91.2 & 110.623188405797 & -19.4231884057971 \tabularnewline
7 & 103.4 & 114.4 & -11.0000000000000 \tabularnewline
8 & 105 & 110.623188405797 & -5.6231884057971 \tabularnewline
9 & 104.6 & 110.623188405797 & -6.02318840579711 \tabularnewline
10 & 103.8 & 110.623188405797 & -6.8231884057971 \tabularnewline
11 & 101.8 & 110.623188405797 & -8.8231884057971 \tabularnewline
12 & 102.4 & 110.623188405797 & -8.2231884057971 \tabularnewline
13 & 103.8 & 110.623188405797 & -6.8231884057971 \tabularnewline
14 & 103.4 & 110.623188405797 & -7.2231884057971 \tabularnewline
15 & 102 & 110.623188405797 & -8.6231884057971 \tabularnewline
16 & 101.8 & 110.623188405797 & -8.8231884057971 \tabularnewline
17 & 100.2 & 110.623188405797 & -10.4231884057971 \tabularnewline
18 & 101.4 & 110.623188405797 & -9.2231884057971 \tabularnewline
19 & 113.8 & 110.623188405797 & 3.17681159420289 \tabularnewline
20 & 116 & 110.623188405797 & 5.3768115942029 \tabularnewline
21 & 115.6 & 110.623188405797 & 4.97681159420289 \tabularnewline
22 & 113 & 110.623188405797 & 2.37681159420290 \tabularnewline
23 & 109.4 & 110.623188405797 & -1.22318840579710 \tabularnewline
24 & 111 & 110.623188405797 & 0.376811594202896 \tabularnewline
25 & 112.4 & 110.623188405797 & 1.77681159420290 \tabularnewline
26 & 112.2 & 110.623188405797 & 1.5768115942029 \tabularnewline
27 & 111 & 110.623188405797 & 0.376811594202896 \tabularnewline
28 & 108.8 & 110.623188405797 & -1.82318840579711 \tabularnewline
29 & 107.4 & 110.623188405797 & -3.2231884057971 \tabularnewline
30 & 108.6 & 110.623188405797 & -2.02318840579711 \tabularnewline
31 & 118.8 & 110.623188405797 & 8.1768115942029 \tabularnewline
32 & 122.2 & 114.4 & 7.79999999999998 \tabularnewline
33 & 122.6 & 110.623188405797 & 11.9768115942029 \tabularnewline
34 & 122.2 & 110.623188405797 & 11.5768115942029 \tabularnewline
35 & 118.8 & 110.623188405797 & 8.1768115942029 \tabularnewline
36 & 119 & 110.623188405797 & 8.3768115942029 \tabularnewline
37 & 118.2 & 110.623188405797 & 7.5768115942029 \tabularnewline
38 & 117.8 & 110.623188405797 & 7.1768115942029 \tabularnewline
39 & 116.8 & 110.623188405797 & 6.1768115942029 \tabularnewline
40 & 114.6 & 110.623188405797 & 3.97681159420289 \tabularnewline
41 & 113.4 & 110.623188405797 & 2.7768115942029 \tabularnewline
42 & 113.8 & 110.623188405797 & 3.17681159420289 \tabularnewline
43 & 124.2 & 110.623188405797 & 13.5768115942029 \tabularnewline
44 & 125.8 & 110.623188405797 & 15.1768115942029 \tabularnewline
45 & 125.6 & 110.623188405797 & 14.9768115942029 \tabularnewline
46 & 122.4 & 110.623188405797 & 11.7768115942029 \tabularnewline
47 & 119 & 110.623188405797 & 8.3768115942029 \tabularnewline
48 & 119.4 & 110.623188405797 & 8.7768115942029 \tabularnewline
49 & 118.6 & 110.623188405797 & 7.97681159420289 \tabularnewline
50 & 118 & 110.623188405797 & 7.3768115942029 \tabularnewline
51 & 116 & 110.623188405797 & 5.3768115942029 \tabularnewline
52 & 114.8 & 110.623188405797 & 4.17681159420289 \tabularnewline
53 & 114.6 & 110.623188405797 & 3.97681159420289 \tabularnewline
54 & 114.6 & 110.623188405797 & 3.97681159420289 \tabularnewline
55 & 124 & 110.623188405797 & 13.3768115942029 \tabularnewline
56 & 125.2 & 110.623188405797 & 14.5768115942029 \tabularnewline
57 & 124 & 110.623188405797 & 13.3768115942029 \tabularnewline
58 & 117.6 & 114.4 & 3.19999999999997 \tabularnewline
59 & 113.2 & 110.623188405797 & 2.5768115942029 \tabularnewline
60 & 111.4 & 110.623188405797 & 0.776811594202902 \tabularnewline
61 & 112.2 & 110.623188405797 & 1.5768115942029 \tabularnewline
62 & 109.8 & 110.623188405797 & -0.823188405797107 \tabularnewline
63 & 106.4 & 110.623188405797 & -4.2231884057971 \tabularnewline
64 & 105.2 & 110.623188405797 & -5.4231884057971 \tabularnewline
65 & 102.2 & 110.623188405797 & -8.4231884057971 \tabularnewline
66 & 99.8 & 110.623188405797 & -10.8231884057971 \tabularnewline
67 & 111 & 110.623188405797 & 0.376811594202896 \tabularnewline
68 & 113 & 110.623188405797 & 2.37681159420290 \tabularnewline
69 & 108.4 & 110.623188405797 & -2.22318840579710 \tabularnewline
70 & 105.4 & 110.623188405797 & -5.2231884057971 \tabularnewline
71 & 102 & 110.623188405797 & -8.6231884057971 \tabularnewline
72 & 102.8 & 110.623188405797 & -7.8231884057971 \tabularnewline
\hline
\end{tabular}
%Source: https://freestatistics.org/blog/index.php?pk=29312&T=4

[TABLE]
[ROW][C]Multiple Linear Regression - Actuals, Interpolation, and Residuals[/C][/ROW]
[ROW][C]Time or Index[/C][C]Actuals[/C][C]InterpolationForecast[/C][C]ResidualsPrediction Error[/C][/ROW]
[ROW][C]1[/C][C]95.2[/C][C]110.623188405797[/C][C]-15.4231884057970[/C][/ROW]
[ROW][C]2[/C][C]95[/C][C]110.623188405797[/C][C]-15.6231884057971[/C][/ROW]
[ROW][C]3[/C][C]94[/C][C]110.623188405797[/C][C]-16.6231884057971[/C][/ROW]
[ROW][C]4[/C][C]92.2[/C][C]110.623188405797[/C][C]-18.4231884057971[/C][/ROW]
[ROW][C]5[/C][C]91[/C][C]110.623188405797[/C][C]-19.6231884057971[/C][/ROW]
[ROW][C]6[/C][C]91.2[/C][C]110.623188405797[/C][C]-19.4231884057971[/C][/ROW]
[ROW][C]7[/C][C]103.4[/C][C]114.4[/C][C]-11.0000000000000[/C][/ROW]
[ROW][C]8[/C][C]105[/C][C]110.623188405797[/C][C]-5.6231884057971[/C][/ROW]
[ROW][C]9[/C][C]104.6[/C][C]110.623188405797[/C][C]-6.02318840579711[/C][/ROW]
[ROW][C]10[/C][C]103.8[/C][C]110.623188405797[/C][C]-6.8231884057971[/C][/ROW]
[ROW][C]11[/C][C]101.8[/C][C]110.623188405797[/C][C]-8.8231884057971[/C][/ROW]
[ROW][C]12[/C][C]102.4[/C][C]110.623188405797[/C][C]-8.2231884057971[/C][/ROW]
[ROW][C]13[/C][C]103.8[/C][C]110.623188405797[/C][C]-6.8231884057971[/C][/ROW]
[ROW][C]14[/C][C]103.4[/C][C]110.623188405797[/C][C]-7.2231884057971[/C][/ROW]
[ROW][C]15[/C][C]102[/C][C]110.623188405797[/C][C]-8.6231884057971[/C][/ROW]
[ROW][C]16[/C][C]101.8[/C][C]110.623188405797[/C][C]-8.8231884057971[/C][/ROW]
[ROW][C]17[/C][C]100.2[/C][C]110.623188405797[/C][C]-10.4231884057971[/C][/ROW]
[ROW][C]18[/C][C]101.4[/C][C]110.623188405797[/C][C]-9.2231884057971[/C][/ROW]
[ROW][C]19[/C][C]113.8[/C][C]110.623188405797[/C][C]3.17681159420289[/C][/ROW]
[ROW][C]20[/C][C]116[/C][C]110.623188405797[/C][C]5.3768115942029[/C][/ROW]
[ROW][C]21[/C][C]115.6[/C][C]110.623188405797[/C][C]4.97681159420289[/C][/ROW]
[ROW][C]22[/C][C]113[/C][C]110.623188405797[/C][C]2.37681159420290[/C][/ROW]
[ROW][C]23[/C][C]109.4[/C][C]110.623188405797[/C][C]-1.22318840579710[/C][/ROW]
[ROW][C]24[/C][C]111[/C][C]110.623188405797[/C][C]0.376811594202896[/C][/ROW]
[ROW][C]25[/C][C]112.4[/C][C]110.623188405797[/C][C]1.77681159420290[/C][/ROW]
[ROW][C]26[/C][C]112.2[/C][C]110.623188405797[/C][C]1.5768115942029[/C][/ROW]
[ROW][C]27[/C][C]111[/C][C]110.623188405797[/C][C]0.376811594202896[/C][/ROW]
[ROW][C]28[/C][C]108.8[/C][C]110.623188405797[/C][C]-1.82318840579711[/C][/ROW]
[ROW][C]29[/C][C]107.4[/C][C]110.623188405797[/C][C]-3.2231884057971[/C][/ROW]
[ROW][C]30[/C][C]108.6[/C][C]110.623188405797[/C][C]-2.02318840579711[/C][/ROW]
[ROW][C]31[/C][C]118.8[/C][C]110.623188405797[/C][C]8.1768115942029[/C][/ROW]
[ROW][C]32[/C][C]122.2[/C][C]114.4[/C][C]7.79999999999998[/C][/ROW]
[ROW][C]33[/C][C]122.6[/C][C]110.623188405797[/C][C]11.9768115942029[/C][/ROW]
[ROW][C]34[/C][C]122.2[/C][C]110.623188405797[/C][C]11.5768115942029[/C][/ROW]
[ROW][C]35[/C][C]118.8[/C][C]110.623188405797[/C][C]8.1768115942029[/C][/ROW]
[ROW][C]36[/C][C]119[/C][C]110.623188405797[/C][C]8.3768115942029[/C][/ROW]
[ROW][C]37[/C][C]118.2[/C][C]110.623188405797[/C][C]7.5768115942029[/C][/ROW]
[ROW][C]38[/C][C]117.8[/C][C]110.623188405797[/C][C]7.1768115942029[/C][/ROW]
[ROW][C]39[/C][C]116.8[/C][C]110.623188405797[/C][C]6.1768115942029[/C][/ROW]
[ROW][C]40[/C][C]114.6[/C][C]110.623188405797[/C][C]3.97681159420289[/C][/ROW]
[ROW][C]41[/C][C]113.4[/C][C]110.623188405797[/C][C]2.7768115942029[/C][/ROW]
[ROW][C]42[/C][C]113.8[/C][C]110.623188405797[/C][C]3.17681159420289[/C][/ROW]
[ROW][C]43[/C][C]124.2[/C][C]110.623188405797[/C][C]13.5768115942029[/C][/ROW]
[ROW][C]44[/C][C]125.8[/C][C]110.623188405797[/C][C]15.1768115942029[/C][/ROW]
[ROW][C]45[/C][C]125.6[/C][C]110.623188405797[/C][C]14.9768115942029[/C][/ROW]
[ROW][C]46[/C][C]122.4[/C][C]110.623188405797[/C][C]11.7768115942029[/C][/ROW]
[ROW][C]47[/C][C]119[/C][C]110.623188405797[/C][C]8.3768115942029[/C][/ROW]
[ROW][C]48[/C][C]119.4[/C][C]110.623188405797[/C][C]8.7768115942029[/C][/ROW]
[ROW][C]49[/C][C]118.6[/C][C]110.623188405797[/C][C]7.97681159420289[/C][/ROW]
[ROW][C]50[/C][C]118[/C][C]110.623188405797[/C][C]7.3768115942029[/C][/ROW]
[ROW][C]51[/C][C]116[/C][C]110.623188405797[/C][C]5.3768115942029[/C][/ROW]
[ROW][C]52[/C][C]114.8[/C][C]110.623188405797[/C][C]4.17681159420289[/C][/ROW]
[ROW][C]53[/C][C]114.6[/C][C]110.623188405797[/C][C]3.97681159420289[/C][/ROW]
[ROW][C]54[/C][C]114.6[/C][C]110.623188405797[/C][C]3.97681159420289[/C][/ROW]
[ROW][C]55[/C][C]124[/C][C]110.623188405797[/C][C]13.3768115942029[/C][/ROW]
[ROW][C]56[/C][C]125.2[/C][C]110.623188405797[/C][C]14.5768115942029[/C][/ROW]
[ROW][C]57[/C][C]124[/C][C]110.623188405797[/C][C]13.3768115942029[/C][/ROW]
[ROW][C]58[/C][C]117.6[/C][C]114.4[/C][C]3.19999999999997[/C][/ROW]
[ROW][C]59[/C][C]113.2[/C][C]110.623188405797[/C][C]2.5768115942029[/C][/ROW]
[ROW][C]60[/C][C]111.4[/C][C]110.623188405797[/C][C]0.776811594202902[/C][/ROW]
[ROW][C]61[/C][C]112.2[/C][C]110.623188405797[/C][C]1.5768115942029[/C][/ROW]
[ROW][C]62[/C][C]109.8[/C][C]110.623188405797[/C][C]-0.823188405797107[/C][/ROW]
[ROW][C]63[/C][C]106.4[/C][C]110.623188405797[/C][C]-4.2231884057971[/C][/ROW]
[ROW][C]64[/C][C]105.2[/C][C]110.623188405797[/C][C]-5.4231884057971[/C][/ROW]
[ROW][C]65[/C][C]102.2[/C][C]110.623188405797[/C][C]-8.4231884057971[/C][/ROW]
[ROW][C]66[/C][C]99.8[/C][C]110.623188405797[/C][C]-10.8231884057971[/C][/ROW]
[ROW][C]67[/C][C]111[/C][C]110.623188405797[/C][C]0.376811594202896[/C][/ROW]
[ROW][C]68[/C][C]113[/C][C]110.623188405797[/C][C]2.37681159420290[/C][/ROW]
[ROW][C]69[/C][C]108.4[/C][C]110.623188405797[/C][C]-2.22318840579710[/C][/ROW]
[ROW][C]70[/C][C]105.4[/C][C]110.623188405797[/C][C]-5.2231884057971[/C][/ROW]
[ROW][C]71[/C][C]102[/C][C]110.623188405797[/C][C]-8.6231884057971[/C][/ROW]
[ROW][C]72[/C][C]102.8[/C][C]110.623188405797[/C][C]-7.8231884057971[/C][/ROW]
[/TABLE]
Source: https://freestatistics.org/blog/index.php?pk=29312&T=4

Globally Unique Identifier (entire table): ba.freestatistics.org/blog/index.php?pk=29312&T=4

As an alternative you can also use a QR Code:  

The GUIDs for individual cells are displayed in the table below:

Multiple Linear Regression - Actuals, Interpolation, and Residuals
Time or IndexActualsInterpolationForecastResidualsPrediction Error
195.2110.623188405797-15.4231884057970
295110.623188405797-15.6231884057971
394110.623188405797-16.6231884057971
492.2110.623188405797-18.4231884057971
591110.623188405797-19.6231884057971
691.2110.623188405797-19.4231884057971
7103.4114.4-11.0000000000000
8105110.623188405797-5.6231884057971
9104.6110.623188405797-6.02318840579711
10103.8110.623188405797-6.8231884057971
11101.8110.623188405797-8.8231884057971
12102.4110.623188405797-8.2231884057971
13103.8110.623188405797-6.8231884057971
14103.4110.623188405797-7.2231884057971
15102110.623188405797-8.6231884057971
16101.8110.623188405797-8.8231884057971
17100.2110.623188405797-10.4231884057971
18101.4110.623188405797-9.2231884057971
19113.8110.6231884057973.17681159420289
20116110.6231884057975.3768115942029
21115.6110.6231884057974.97681159420289
22113110.6231884057972.37681159420290
23109.4110.623188405797-1.22318840579710
24111110.6231884057970.376811594202896
25112.4110.6231884057971.77681159420290
26112.2110.6231884057971.5768115942029
27111110.6231884057970.376811594202896
28108.8110.623188405797-1.82318840579711
29107.4110.623188405797-3.2231884057971
30108.6110.623188405797-2.02318840579711
31118.8110.6231884057978.1768115942029
32122.2114.47.79999999999998
33122.6110.62318840579711.9768115942029
34122.2110.62318840579711.5768115942029
35118.8110.6231884057978.1768115942029
36119110.6231884057978.3768115942029
37118.2110.6231884057977.5768115942029
38117.8110.6231884057977.1768115942029
39116.8110.6231884057976.1768115942029
40114.6110.6231884057973.97681159420289
41113.4110.6231884057972.7768115942029
42113.8110.6231884057973.17681159420289
43124.2110.62318840579713.5768115942029
44125.8110.62318840579715.1768115942029
45125.6110.62318840579714.9768115942029
46122.4110.62318840579711.7768115942029
47119110.6231884057978.3768115942029
48119.4110.6231884057978.7768115942029
49118.6110.6231884057977.97681159420289
50118110.6231884057977.3768115942029
51116110.6231884057975.3768115942029
52114.8110.6231884057974.17681159420289
53114.6110.6231884057973.97681159420289
54114.6110.6231884057973.97681159420289
55124110.62318840579713.3768115942029
56125.2110.62318840579714.5768115942029
57124110.62318840579713.3768115942029
58117.6114.43.19999999999997
59113.2110.6231884057972.5768115942029
60111.4110.6231884057970.776811594202902
61112.2110.6231884057971.5768115942029
62109.8110.623188405797-0.823188405797107
63106.4110.623188405797-4.2231884057971
64105.2110.623188405797-5.4231884057971
65102.2110.623188405797-8.4231884057971
6699.8110.623188405797-10.8231884057971
67111110.6231884057970.376811594202896
68113110.6231884057972.37681159420290
69108.4110.623188405797-2.22318840579710
70105.4110.623188405797-5.2231884057971
71102110.623188405797-8.6231884057971
72102.8110.623188405797-7.8231884057971


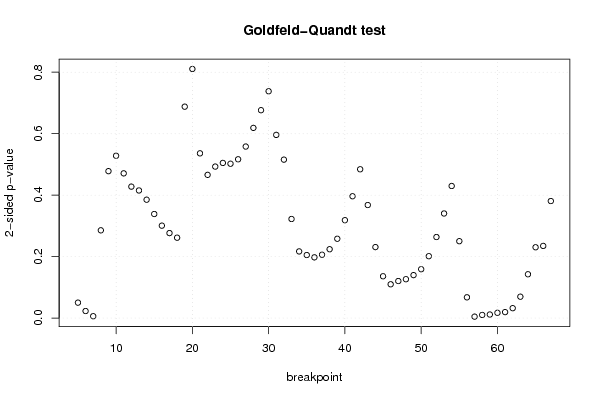
Goldfeld-Quandt test for Heteroskedasticity
p-valuesAlternative Hypothesis
breakpoint indexgreater2-sidedless
50.02510841228486340.05021682456972670.974891587715137
60.01144931524248130.02289863048496270.988550684757519
70.003032650141082080.006065300282164170.996967349858918
80.1428055508087690.2856111016175380.85719444919123
90.239044687341280.478089374682560.76095531265872
100.2641015095060860.5282030190121720.735898490493914
110.235490822562370.470981645124740.76450917743763
120.2138681449691570.4277362899383140.786131855030843
130.2076422748431720.4152845496863430.792357725156828
140.1926194665868430.3852389331736860.807380533413157
150.1693243296671850.3386486593343690.830675670332815
160.1503794686006350.3007589372012690.849620531399365
170.138296773229510.276593546459020.86170322677049
180.1308012477045500.2616024954091010.86919875229545
190.3439529078176890.6879058156353780.656047092182311
200.594665348058280.8106693038834410.405334651941720
210.7319490466351410.5361019067297180.268050953364859
220.7669726928499950.4660546143000090.233027307150005
230.7535264930275180.4929470139449630.246473506972482
240.7475772996854750.504845400629050.252422700314525
250.7488534465952860.5022931068094280.251146553404714
260.7416593788660760.5166812422678480.258340621133924
270.7209186212901650.558162757419670.279081378709835
280.6905398012564430.6189203974871140.309460198743557
290.6617642803500650.676471439299870.338235719649935
300.6309694199410040.7380611601179920.369030580058996
310.7019629065852350.596074186829530.298037093414765
320.7421966400938950.515606719812210.257803359906105
330.8387725056608120.3224549886783760.161227494339188
340.8915391540033920.2169216919932160.108460845996608
350.8974297216793960.2051405566412080.102570278320604
360.9011519399609520.1976961200780950.0988480600390477
370.8969121073348480.2061757853303030.103087892665152
380.887984504190710.2240309916185790.112015495809290
390.8709523828448250.258095234310350.129047617155175
400.8407131601887730.3185736796224530.159286839811227
410.8017873612052530.3964252775894950.198212638794748
420.7578665349122620.4842669301754760.242133465087738
430.8160634267595060.3678731464809880.183936573240494
440.8844954550408110.2310090899183770.115504544959189
450.9319534439910370.1360931120179260.0680465560089629
460.9450004554221120.1099990891557750.0549995445778877
470.9397424123706080.1205151752587850.0602575876293923
480.936732811567630.1265343768647390.0632671884323697
490.9301210031209030.1397579937581930.0698789968790967
500.920479988794370.1590400224112590.0795200112056297
510.8993170457580720.2013659084838560.100682954241928
520.8681572362701860.2636855274596280.131842763729814
530.8298182824218130.3403634351563740.170181717578187
540.7850831863952950.429833627209410.214916813604705
550.8749046191078080.2501907617843830.125095380892191
560.9662005277525130.06759894449497440.0337994722474872
570.9976732642050050.004653471589990270.00232673579499513
580.9949007003540350.01019859929193060.0050992996459653
590.9941954772570920.01160904548581550.00580452274290775
600.9914103297779780.01717934044404450.00858967022202224
610.990267922728280.01946415454343920.00973207727171961
620.9838931058208540.03221378835829120.0161068941791456
630.9651965069656460.06960698606870850.0348034930343543
640.9286932504429070.1426134991141850.0713067495570927
650.8847913926459760.2304172147080480.115208607354024
660.8825931920679320.2348136158641350.117406807932068
670.8095636814090450.3808726371819100.190436318590955

\begin{tabular}{lllllllll}
\hline
Goldfeld-Quandt test for Heteroskedasticity \tabularnewline
p-values & Alternative Hypothesis \tabularnewline
breakpoint index & greater & 2-sided & less \tabularnewline
5 & 0.0251084122848634 & 0.0502168245697267 & 0.974891587715137 \tabularnewline
6 & 0.0114493152424813 & 0.0228986304849627 & 0.988550684757519 \tabularnewline
7 & 0.00303265014108208 & 0.00606530028216417 & 0.996967349858918 \tabularnewline
8 & 0.142805550808769 & 0.285611101617538 & 0.85719444919123 \tabularnewline
9 & 0.23904468734128 & 0.47808937468256 & 0.76095531265872 \tabularnewline
10 & 0.264101509506086 & 0.528203019012172 & 0.735898490493914 \tabularnewline
11 & 0.23549082256237 & 0.47098164512474 & 0.76450917743763 \tabularnewline
12 & 0.213868144969157 & 0.427736289938314 & 0.786131855030843 \tabularnewline
13 & 0.207642274843172 & 0.415284549686343 & 0.792357725156828 \tabularnewline
14 & 0.192619466586843 & 0.385238933173686 & 0.807380533413157 \tabularnewline
15 & 0.169324329667185 & 0.338648659334369 & 0.830675670332815 \tabularnewline
16 & 0.150379468600635 & 0.300758937201269 & 0.849620531399365 \tabularnewline
17 & 0.13829677322951 & 0.27659354645902 & 0.86170322677049 \tabularnewline
18 & 0.130801247704550 & 0.261602495409101 & 0.86919875229545 \tabularnewline
19 & 0.343952907817689 & 0.687905815635378 & 0.656047092182311 \tabularnewline
20 & 0.59466534805828 & 0.810669303883441 & 0.405334651941720 \tabularnewline
21 & 0.731949046635141 & 0.536101906729718 & 0.268050953364859 \tabularnewline
22 & 0.766972692849995 & 0.466054614300009 & 0.233027307150005 \tabularnewline
23 & 0.753526493027518 & 0.492947013944963 & 0.246473506972482 \tabularnewline
24 & 0.747577299685475 & 0.50484540062905 & 0.252422700314525 \tabularnewline
25 & 0.748853446595286 & 0.502293106809428 & 0.251146553404714 \tabularnewline
26 & 0.741659378866076 & 0.516681242267848 & 0.258340621133924 \tabularnewline
27 & 0.720918621290165 & 0.55816275741967 & 0.279081378709835 \tabularnewline
28 & 0.690539801256443 & 0.618920397487114 & 0.309460198743557 \tabularnewline
29 & 0.661764280350065 & 0.67647143929987 & 0.338235719649935 \tabularnewline
30 & 0.630969419941004 & 0.738061160117992 & 0.369030580058996 \tabularnewline
31 & 0.701962906585235 & 0.59607418682953 & 0.298037093414765 \tabularnewline
32 & 0.742196640093895 & 0.51560671981221 & 0.257803359906105 \tabularnewline
33 & 0.838772505660812 & 0.322454988678376 & 0.161227494339188 \tabularnewline
34 & 0.891539154003392 & 0.216921691993216 & 0.108460845996608 \tabularnewline
35 & 0.897429721679396 & 0.205140556641208 & 0.102570278320604 \tabularnewline
36 & 0.901151939960952 & 0.197696120078095 & 0.0988480600390477 \tabularnewline
37 & 0.896912107334848 & 0.206175785330303 & 0.103087892665152 \tabularnewline
38 & 0.88798450419071 & 0.224030991618579 & 0.112015495809290 \tabularnewline
39 & 0.870952382844825 & 0.25809523431035 & 0.129047617155175 \tabularnewline
40 & 0.840713160188773 & 0.318573679622453 & 0.159286839811227 \tabularnewline
41 & 0.801787361205253 & 0.396425277589495 & 0.198212638794748 \tabularnewline
42 & 0.757866534912262 & 0.484266930175476 & 0.242133465087738 \tabularnewline
43 & 0.816063426759506 & 0.367873146480988 & 0.183936573240494 \tabularnewline
44 & 0.884495455040811 & 0.231009089918377 & 0.115504544959189 \tabularnewline
45 & 0.931953443991037 & 0.136093112017926 & 0.0680465560089629 \tabularnewline
46 & 0.945000455422112 & 0.109999089155775 & 0.0549995445778877 \tabularnewline
47 & 0.939742412370608 & 0.120515175258785 & 0.0602575876293923 \tabularnewline
48 & 0.93673281156763 & 0.126534376864739 & 0.0632671884323697 \tabularnewline
49 & 0.930121003120903 & 0.139757993758193 & 0.0698789968790967 \tabularnewline
50 & 0.92047998879437 & 0.159040022411259 & 0.0795200112056297 \tabularnewline
51 & 0.899317045758072 & 0.201365908483856 & 0.100682954241928 \tabularnewline
52 & 0.868157236270186 & 0.263685527459628 & 0.131842763729814 \tabularnewline
53 & 0.829818282421813 & 0.340363435156374 & 0.170181717578187 \tabularnewline
54 & 0.785083186395295 & 0.42983362720941 & 0.214916813604705 \tabularnewline
55 & 0.874904619107808 & 0.250190761784383 & 0.125095380892191 \tabularnewline
56 & 0.966200527752513 & 0.0675989444949744 & 0.0337994722474872 \tabularnewline
57 & 0.997673264205005 & 0.00465347158999027 & 0.00232673579499513 \tabularnewline
58 & 0.994900700354035 & 0.0101985992919306 & 0.0050992996459653 \tabularnewline
59 & 0.994195477257092 & 0.0116090454858155 & 0.00580452274290775 \tabularnewline
60 & 0.991410329777978 & 0.0171793404440445 & 0.00858967022202224 \tabularnewline
61 & 0.99026792272828 & 0.0194641545434392 & 0.00973207727171961 \tabularnewline
62 & 0.983893105820854 & 0.0322137883582912 & 0.0161068941791456 \tabularnewline
63 & 0.965196506965646 & 0.0696069860687085 & 0.0348034930343543 \tabularnewline
64 & 0.928693250442907 & 0.142613499114185 & 0.0713067495570927 \tabularnewline
65 & 0.884791392645976 & 0.230417214708048 & 0.115208607354024 \tabularnewline
66 & 0.882593192067932 & 0.234813615864135 & 0.117406807932068 \tabularnewline
67 & 0.809563681409045 & 0.380872637181910 & 0.190436318590955 \tabularnewline
\hline
\end{tabular}
%Source: https://freestatistics.org/blog/index.php?pk=29312&T=5

[TABLE]
[ROW][C]Goldfeld-Quandt test for Heteroskedasticity[/C][/ROW]
[ROW][C]p-values[/C][C]Alternative Hypothesis[/C][/ROW]
[ROW][C]breakpoint index[/C][C]greater[/C][C]2-sided[/C][C]less[/C][/ROW]
[ROW][C]5[/C][C]0.0251084122848634[/C][C]0.0502168245697267[/C][C]0.974891587715137[/C][/ROW]
[ROW][C]6[/C][C]0.0114493152424813[/C][C]0.0228986304849627[/C][C]0.988550684757519[/C][/ROW]
[ROW][C]7[/C][C]0.00303265014108208[/C][C]0.00606530028216417[/C][C]0.996967349858918[/C][/ROW]
[ROW][C]8[/C][C]0.142805550808769[/C][C]0.285611101617538[/C][C]0.85719444919123[/C][/ROW]
[ROW][C]9[/C][C]0.23904468734128[/C][C]0.47808937468256[/C][C]0.76095531265872[/C][/ROW]
[ROW][C]10[/C][C]0.264101509506086[/C][C]0.528203019012172[/C][C]0.735898490493914[/C][/ROW]
[ROW][C]11[/C][C]0.23549082256237[/C][C]0.47098164512474[/C][C]0.76450917743763[/C][/ROW]
[ROW][C]12[/C][C]0.213868144969157[/C][C]0.427736289938314[/C][C]0.786131855030843[/C][/ROW]
[ROW][C]13[/C][C]0.207642274843172[/C][C]0.415284549686343[/C][C]0.792357725156828[/C][/ROW]
[ROW][C]14[/C][C]0.192619466586843[/C][C]0.385238933173686[/C][C]0.807380533413157[/C][/ROW]
[ROW][C]15[/C][C]0.169324329667185[/C][C]0.338648659334369[/C][C]0.830675670332815[/C][/ROW]
[ROW][C]16[/C][C]0.150379468600635[/C][C]0.300758937201269[/C][C]0.849620531399365[/C][/ROW]
[ROW][C]17[/C][C]0.13829677322951[/C][C]0.27659354645902[/C][C]0.86170322677049[/C][/ROW]
[ROW][C]18[/C][C]0.130801247704550[/C][C]0.261602495409101[/C][C]0.86919875229545[/C][/ROW]
[ROW][C]19[/C][C]0.343952907817689[/C][C]0.687905815635378[/C][C]0.656047092182311[/C][/ROW]
[ROW][C]20[/C][C]0.59466534805828[/C][C]0.810669303883441[/C][C]0.405334651941720[/C][/ROW]
[ROW][C]21[/C][C]0.731949046635141[/C][C]0.536101906729718[/C][C]0.268050953364859[/C][/ROW]
[ROW][C]22[/C][C]0.766972692849995[/C][C]0.466054614300009[/C][C]0.233027307150005[/C][/ROW]
[ROW][C]23[/C][C]0.753526493027518[/C][C]0.492947013944963[/C][C]0.246473506972482[/C][/ROW]
[ROW][C]24[/C][C]0.747577299685475[/C][C]0.50484540062905[/C][C]0.252422700314525[/C][/ROW]
[ROW][C]25[/C][C]0.748853446595286[/C][C]0.502293106809428[/C][C]0.251146553404714[/C][/ROW]
[ROW][C]26[/C][C]0.741659378866076[/C][C]0.516681242267848[/C][C]0.258340621133924[/C][/ROW]
[ROW][C]27[/C][C]0.720918621290165[/C][C]0.55816275741967[/C][C]0.279081378709835[/C][/ROW]
[ROW][C]28[/C][C]0.690539801256443[/C][C]0.618920397487114[/C][C]0.309460198743557[/C][/ROW]
[ROW][C]29[/C][C]0.661764280350065[/C][C]0.67647143929987[/C][C]0.338235719649935[/C][/ROW]
[ROW][C]30[/C][C]0.630969419941004[/C][C]0.738061160117992[/C][C]0.369030580058996[/C][/ROW]
[ROW][C]31[/C][C]0.701962906585235[/C][C]0.59607418682953[/C][C]0.298037093414765[/C][/ROW]
[ROW][C]32[/C][C]0.742196640093895[/C][C]0.51560671981221[/C][C]0.257803359906105[/C][/ROW]
[ROW][C]33[/C][C]0.838772505660812[/C][C]0.322454988678376[/C][C]0.161227494339188[/C][/ROW]
[ROW][C]34[/C][C]0.891539154003392[/C][C]0.216921691993216[/C][C]0.108460845996608[/C][/ROW]
[ROW][C]35[/C][C]0.897429721679396[/C][C]0.205140556641208[/C][C]0.102570278320604[/C][/ROW]
[ROW][C]36[/C][C]0.901151939960952[/C][C]0.197696120078095[/C][C]0.0988480600390477[/C][/ROW]
[ROW][C]37[/C][C]0.896912107334848[/C][C]0.206175785330303[/C][C]0.103087892665152[/C][/ROW]
[ROW][C]38[/C][C]0.88798450419071[/C][C]0.224030991618579[/C][C]0.112015495809290[/C][/ROW]
[ROW][C]39[/C][C]0.870952382844825[/C][C]0.25809523431035[/C][C]0.129047617155175[/C][/ROW]
[ROW][C]40[/C][C]0.840713160188773[/C][C]0.318573679622453[/C][C]0.159286839811227[/C][/ROW]
[ROW][C]41[/C][C]0.801787361205253[/C][C]0.396425277589495[/C][C]0.198212638794748[/C][/ROW]
[ROW][C]42[/C][C]0.757866534912262[/C][C]0.484266930175476[/C][C]0.242133465087738[/C][/ROW]
[ROW][C]43[/C][C]0.816063426759506[/C][C]0.367873146480988[/C][C]0.183936573240494[/C][/ROW]
[ROW][C]44[/C][C]0.884495455040811[/C][C]0.231009089918377[/C][C]0.115504544959189[/C][/ROW]
[ROW][C]45[/C][C]0.931953443991037[/C][C]0.136093112017926[/C][C]0.0680465560089629[/C][/ROW]
[ROW][C]46[/C][C]0.945000455422112[/C][C]0.109999089155775[/C][C]0.0549995445778877[/C][/ROW]
[ROW][C]47[/C][C]0.939742412370608[/C][C]0.120515175258785[/C][C]0.0602575876293923[/C][/ROW]
[ROW][C]48[/C][C]0.93673281156763[/C][C]0.126534376864739[/C][C]0.0632671884323697[/C][/ROW]
[ROW][C]49[/C][C]0.930121003120903[/C][C]0.139757993758193[/C][C]0.0698789968790967[/C][/ROW]
[ROW][C]50[/C][C]0.92047998879437[/C][C]0.159040022411259[/C][C]0.0795200112056297[/C][/ROW]
[ROW][C]51[/C][C]0.899317045758072[/C][C]0.201365908483856[/C][C]0.100682954241928[/C][/ROW]
[ROW][C]52[/C][C]0.868157236270186[/C][C]0.263685527459628[/C][C]0.131842763729814[/C][/ROW]
[ROW][C]53[/C][C]0.829818282421813[/C][C]0.340363435156374[/C][C]0.170181717578187[/C][/ROW]
[ROW][C]54[/C][C]0.785083186395295[/C][C]0.42983362720941[/C][C]0.214916813604705[/C][/ROW]
[ROW][C]55[/C][C]0.874904619107808[/C][C]0.250190761784383[/C][C]0.125095380892191[/C][/ROW]
[ROW][C]56[/C][C]0.966200527752513[/C][C]0.0675989444949744[/C][C]0.0337994722474872[/C][/ROW]
[ROW][C]57[/C][C]0.997673264205005[/C][C]0.00465347158999027[/C][C]0.00232673579499513[/C][/ROW]
[ROW][C]58[/C][C]0.994900700354035[/C][C]0.0101985992919306[/C][C]0.0050992996459653[/C][/ROW]
[ROW][C]59[/C][C]0.994195477257092[/C][C]0.0116090454858155[/C][C]0.00580452274290775[/C][/ROW]
[ROW][C]60[/C][C]0.991410329777978[/C][C]0.0171793404440445[/C][C]0.00858967022202224[/C][/ROW]
[ROW][C]61[/C][C]0.99026792272828[/C][C]0.0194641545434392[/C][C]0.00973207727171961[/C][/ROW]
[ROW][C]62[/C][C]0.983893105820854[/C][C]0.0322137883582912[/C][C]0.0161068941791456[/C][/ROW]
[ROW][C]63[/C][C]0.965196506965646[/C][C]0.0696069860687085[/C][C]0.0348034930343543[/C][/ROW]
[ROW][C]64[/C][C]0.928693250442907[/C][C]0.142613499114185[/C][C]0.0713067495570927[/C][/ROW]
[ROW][C]65[/C][C]0.884791392645976[/C][C]0.230417214708048[/C][C]0.115208607354024[/C][/ROW]
[ROW][C]66[/C][C]0.882593192067932[/C][C]0.234813615864135[/C][C]0.117406807932068[/C][/ROW]
[ROW][C]67[/C][C]0.809563681409045[/C][C]0.380872637181910[/C][C]0.190436318590955[/C][/ROW]
[/TABLE]
Source: https://freestatistics.org/blog/index.php?pk=29312&T=5

Globally Unique Identifier (entire table): ba.freestatistics.org/blog/index.php?pk=29312&T=5

As an alternative you can also use a QR Code:  

The GUIDs for individual cells are displayed in the table below:

Goldfeld-Quandt test for Heteroskedasticity
p-valuesAlternative Hypothesis
breakpoint indexgreater2-sidedless
50.02510841228486340.05021682456972670.974891587715137
60.01144931524248130.02289863048496270.988550684757519
70.003032650141082080.006065300282164170.996967349858918
80.1428055508087690.2856111016175380.85719444919123
90.239044687341280.478089374682560.76095531265872
100.2641015095060860.5282030190121720.735898490493914
110.235490822562370.470981645124740.76450917743763
120.2138681449691570.4277362899383140.786131855030843
130.2076422748431720.4152845496863430.792357725156828
140.1926194665868430.3852389331736860.807380533413157
150.1693243296671850.3386486593343690.830675670332815
160.1503794686006350.3007589372012690.849620531399365
170.138296773229510.276593546459020.86170322677049
180.1308012477045500.2616024954091010.86919875229545
190.3439529078176890.6879058156353780.656047092182311
200.594665348058280.8106693038834410.405334651941720
210.7319490466351410.5361019067297180.268050953364859
220.7669726928499950.4660546143000090.233027307150005
230.7535264930275180.4929470139449630.246473506972482
240.7475772996854750.504845400629050.252422700314525
250.7488534465952860.5022931068094280.251146553404714
260.7416593788660760.5166812422678480.258340621133924
270.7209186212901650.558162757419670.279081378709835
280.6905398012564430.6189203974871140.309460198743557
290.6617642803500650.676471439299870.338235719649935
300.6309694199410040.7380611601179920.369030580058996
310.7019629065852350.596074186829530.298037093414765
320.7421966400938950.515606719812210.257803359906105
330.8387725056608120.3224549886783760.161227494339188
340.8915391540033920.2169216919932160.108460845996608
350.8974297216793960.2051405566412080.102570278320604
360.9011519399609520.1976961200780950.0988480600390477
370.8969121073348480.2061757853303030.103087892665152
380.887984504190710.2240309916185790.112015495809290
390.8709523828448250.258095234310350.129047617155175
400.8407131601887730.3185736796224530.159286839811227
410.8017873612052530.3964252775894950.198212638794748
420.7578665349122620.4842669301754760.242133465087738
430.8160634267595060.3678731464809880.183936573240494
440.8844954550408110.2310090899183770.115504544959189
450.9319534439910370.1360931120179260.0680465560089629
460.9450004554221120.1099990891557750.0549995445778877
470.9397424123706080.1205151752587850.0602575876293923
480.936732811567630.1265343768647390.0632671884323697
490.9301210031209030.1397579937581930.0698789968790967
500.920479988794370.1590400224112590.0795200112056297
510.8993170457580720.2013659084838560.100682954241928
520.8681572362701860.2636855274596280.131842763729814
530.8298182824218130.3403634351563740.170181717578187
540.7850831863952950.429833627209410.214916813604705
550.8749046191078080.2501907617843830.125095380892191
560.9662005277525130.06759894449497440.0337994722474872
570.9976732642050050.004653471589990270.00232673579499513
580.9949007003540350.01019859929193060.0050992996459653
590.9941954772570920.01160904548581550.00580452274290775
600.9914103297779780.01717934044404450.00858967022202224
610.990267922728280.01946415454343920.00973207727171961
620.9838931058208540.03221378835829120.0161068941791456
630.9651965069656460.06960698606870850.0348034930343543
640.9286932504429070.1426134991141850.0713067495570927
650.8847913926459760.2304172147080480.115208607354024
660.8825931920679320.2348136158641350.117406807932068
670.8095636814090450.3808726371819100.190436318590955


Meta Analysis of Goldfeld-Quandt test for Heteroskedasticity
Description# significant tests% significant testsOK/NOK
1% type I error level20.0317460317460317NOK
5% type I error level80.126984126984127NOK
10% type I error level110.174603174603175NOK

\begin{tabular}{lllllllll}
\hline
Meta Analysis of Goldfeld-Quandt test for Heteroskedasticity \tabularnewline
Description & # significant tests & % significant tests & OK/NOK \tabularnewline
1% type I error level & 2 & 0.0317460317460317 & NOK \tabularnewline
5% type I error level & 8 & 0.126984126984127 & NOK \tabularnewline
10% type I error level & 11 & 0.174603174603175 & NOK \tabularnewline
\hline
\end{tabular}
%Source: https://freestatistics.org/blog/index.php?pk=29312&T=6

[TABLE]
[ROW][C]Meta Analysis of Goldfeld-Quandt test for Heteroskedasticity[/C][/ROW]
[ROW][C]Description[/C][C]# significant tests[/C][C]% significant tests[/C][C]OK/NOK[/C][/ROW]
[ROW][C]1% type I error level[/C][C]2[/C][C]0.0317460317460317[/C][C]NOK[/C][/ROW]
[ROW][C]5% type I error level[/C][C]8[/C][C]0.126984126984127[/C][C]NOK[/C][/ROW]
[ROW][C]10% type I error level[/C][C]11[/C][C]0.174603174603175[/C][C]NOK[/C][/ROW]
[/TABLE]
Source: https://freestatistics.org/blog/index.php?pk=29312&T=6

Globally Unique Identifier (entire table): ba.freestatistics.org/blog/index.php?pk=29312&T=6

As an alternative you can also use a QR Code:  

The GUIDs for individual cells are displayed in the table below:

Meta Analysis of Goldfeld-Quandt test for Heteroskedasticity
Description# significant tests% significant testsOK/NOK
1% type I error level20.0317460317460317NOK
5% type I error level80.126984126984127NOK
10% type I error level110.174603174603175NOK


Parameters (Session):
par1 = 1 ; par2 = Do not include Seasonal Dummies ; par3 = No Linear Trend ;
Parameters (R input):
par1 = 1 ; par2 = Do not include Seasonal Dummies ; par3 = No Linear Trend ;
R code (references can be found in the software module):
library(lattice)
library(lmtest)
n25 <- 25 #minimum number of obs. for Goldfeld-Quandt test
par1 <- as.numeric(par1)
x <- t(y)
k <- length(x[1,])
n <- length(x[,1])
x1 <- cbind(x[,par1], x[,1:k!=par1])
mycolnames <- c(colnames(x)[par1], colnames(x)[1:k!=par1])
colnames(x1) <- mycolnames #colnames(x)[par1]
x <- x1
if (par3 == 'First Differences'){
x2 <- array(0, dim=c(n-1,k), dimnames=list(1:(n-1), paste('(1-B)',colnames(x),sep='')))
for (i in 1:n-1) {
for (j in 1:k) {
x2[i,j] <- x[i+1,j] - x[i,j]
}
}
x <- x2
}
if (par2 == 'Include Monthly Dummies'){
x2 <- array(0, dim=c(n,11), dimnames=list(1:n, paste('M', seq(1:11), sep ='')))
for (i in 1:11){
x2[seq(i,n,12),i] <- 1
}
x <- cbind(x, x2)
}
if (par2 == 'Include Quarterly Dummies'){
x2 <- array(0, dim=c(n,3), dimnames=list(1:n, paste('Q', seq(1:3), sep ='')))
for (i in 1:3){
x2[seq(i,n,4),i] <- 1
}
x <- cbind(x, x2)
}
k <- length(x[1,])
if (par3 == 'Linear Trend'){
x <- cbind(x, c(1:n))
colnames(x)[k+1] <- 't'
}
x
k <- length(x[1,])
df <- as.data.frame(x)
(mylm <- lm(df))
(mysum <- summary(mylm))
if (n > n25) {
kp3 <- k + 3
nmkm3 <- n - k - 3
gqarr <- array(NA, dim=c(nmkm3-kp3+1,3))
numgqtests <- 0
numsignificant1 <- 0
numsignificant5 <- 0
numsignificant10 <- 0
for (mypoint in kp3:nmkm3) {
j <- 0
numgqtests <- numgqtests + 1
for (myalt in c('greater', 'two.sided', 'less')) {
j <- j + 1
gqarr[mypoint-kp3+1,j] <- gqtest(mylm, point=mypoint, alternative=myalt)$p.value
}
if (gqarr[mypoint-kp3+1,2] < 0.01) numsignificant1 <- numsignificant1 + 1
if (gqarr[mypoint-kp3+1,2] < 0.05) numsignificant5 <- numsignificant5 + 1
if (gqarr[mypoint-kp3+1,2] < 0.10) numsignificant10 <- numsignificant10 + 1
}
gqarr
}
bitmap(file='test0.png')
plot(x[,1], type='l', main='Actuals and Interpolation', ylab='value of Actuals and Interpolation (dots)', xlab='time or index')
points(x[,1]-mysum$resid)
grid()
dev.off()
bitmap(file='test1.png')
plot(mysum$resid, type='b', pch=19, main='Residuals', ylab='value of Residuals', xlab='time or index')
grid()
dev.off()
bitmap(file='test2.png')
hist(mysum$resid, main='Residual Histogram', xlab='values of Residuals')
grid()
dev.off()
bitmap(file='test3.png')
densityplot(~mysum$resid,col='black',main='Residual Density Plot', xlab='values of Residuals')
dev.off()
bitmap(file='test4.png')
qqnorm(mysum$resid, main='Residual Normal Q-Q Plot')
qqline(mysum$resid)
grid()
dev.off()
(myerror <- as.ts(mysum$resid))
bitmap(file='test5.png')
dum <- cbind(lag(myerror,k=1),myerror)
dum
dum1 <- dum[2:length(myerror),]
dum1
z <- as.data.frame(dum1)
z
plot(z,main=paste('Residual Lag plot, lowess, and regression line'), ylab='values of Residuals', xlab='lagged values of Residuals')
lines(lowess(z))
abline(lm(z))
grid()
dev.off()
bitmap(file='test6.png')
acf(mysum$resid, lag.max=length(mysum$resid)/2, main='Residual Autocorrelation Function')
grid()
dev.off()
bitmap(file='test7.png')
pacf(mysum$resid, lag.max=length(mysum$resid)/2, main='Residual Partial Autocorrelation Function')
grid()
dev.off()
bitmap(file='test8.png')
opar <- par(mfrow = c(2,2), oma = c(0, 0, 1.1, 0))
plot(mylm, las = 1, sub='Residual Diagnostics')
par(opar)
dev.off()
if (n > n25) {
bitmap(file='test9.png')
plot(kp3:nmkm3,gqarr[,2], main='Goldfeld-Quandt test',ylab='2-sided p-value',xlab='breakpoint')
grid()
dev.off()
}
load(file='createtable')
a<-table.start()
a<-table.row.start(a)
a<-table.element(a, 'Multiple Linear Regression - Estimated Regression Equation', 1, TRUE)
a<-table.row.end(a)
myeq <- colnames(x)[1]
myeq <- paste(myeq, '[t] = ', sep='')
for (i in 1:k){
if (mysum$coefficients[i,1] > 0) myeq <- paste(myeq, '+', '')
myeq <- paste(myeq, mysum$coefficients[i,1], sep=' ')
if (rownames(mysum$coefficients)[i] != '(Intercept)') {
myeq <- paste(myeq, rownames(mysum$coefficients)[i], sep='')
if (rownames(mysum$coefficients)[i] != 't') myeq <- paste(myeq, '[t]', sep='')
}
}
myeq <- paste(myeq, ' + e[t]')
a<-table.row.start(a)
a<-table.element(a, myeq)
a<-table.row.end(a)
a<-table.end(a)
table.save(a,file='mytable1.tab')
a<-table.start()
a<-table.row.start(a)
a<-table.element(a,hyperlink('ols1.htm','Multiple Linear Regression - Ordinary Least Squares',''), 6, TRUE)
a<-table.row.end(a)
a<-table.row.start(a)
a<-table.element(a,'Variable',header=TRUE)
a<-table.element(a,'Parameter',header=TRUE)
a<-table.element(a,'S.D.',header=TRUE)
a<-table.element(a,'T-STAT
H0: parameter = 0',header=TRUE)
a<-table.element(a,'2-tail p-value',header=TRUE)
a<-table.element(a,'1-tail p-value',header=TRUE)
a<-table.row.end(a)
for (i in 1:k){
a<-table.row.start(a)
a<-table.element(a,rownames(mysum$coefficients)[i],header=TRUE)
a<-table.element(a,mysum$coefficients[i,1])
a<-table.element(a, round(mysum$coefficients[i,2],6))
a<-table.element(a, round(mysum$coefficients[i,3],4))
a<-table.element(a, round(mysum$coefficients[i,4],6))
a<-table.element(a, round(mysum$coefficients[i,4]/2,6))
a<-table.row.end(a)
}
a<-table.end(a)
table.save(a,file='mytable2.tab')
a<-table.start()
a<-table.row.start(a)
a<-table.element(a, 'Multiple Linear Regression - Regression Statistics', 2, TRUE)
a<-table.row.end(a)
a<-table.row.start(a)
a<-table.element(a, 'Multiple R',1,TRUE)
a<-table.element(a, sqrt(mysum$r.squared))
a<-table.row.end(a)
a<-table.row.start(a)
a<-table.element(a, 'R-squared',1,TRUE)
a<-table.element(a, mysum$r.squared)
a<-table.row.end(a)
a<-table.row.start(a)
a<-table.element(a, 'Adjusted R-squared',1,TRUE)
a<-table.element(a, mysum$adj.r.squared)
a<-table.row.end(a)
a<-table.row.start(a)
a<-table.element(a, 'F-TEST (value)',1,TRUE)
a<-table.element(a, mysum$fstatistic[1])
a<-table.row.end(a)
a<-table.row.start(a)
a<-table.element(a, 'F-TEST (DF numerator)',1,TRUE)
a<-table.element(a, mysum$fstatistic[2])
a<-table.row.end(a)
a<-table.row.start(a)
a<-table.element(a, 'F-TEST (DF denominator)',1,TRUE)
a<-table.element(a, mysum$fstatistic[3])
a<-table.row.end(a)
a<-table.row.start(a)
a<-table.element(a, 'p-value',1,TRUE)
a<-table.element(a, 1-pf(mysum$fstatistic[1],mysum$fstatistic[2],mysum$fstatistic[3]))
a<-table.row.end(a)
a<-table.row.start(a)
a<-table.element(a, 'Multiple Linear Regression - Residual Statistics', 2, TRUE)
a<-table.row.end(a)
a<-table.row.start(a)
a<-table.element(a, 'Residual Standard Deviation',1,TRUE)
a<-table.element(a, mysum$sigma)
a<-table.row.end(a)
a<-table.row.start(a)
a<-table.element(a, 'Sum Squared Residuals',1,TRUE)
a<-table.element(a, sum(myerror*myerror))
a<-table.row.end(a)
a<-table.end(a)
table.save(a,file='mytable3.tab')
a<-table.start()
a<-table.row.start(a)
a<-table.element(a, 'Multiple Linear Regression - Actuals, Interpolation, and Residuals', 4, TRUE)
a<-table.row.end(a)
a<-table.row.start(a)
a<-table.element(a, 'Time or Index', 1, TRUE)
a<-table.element(a, 'Actuals', 1, TRUE)
a<-table.element(a, 'Interpolation
Forecast', 1, TRUE)
a<-table.element(a, 'Residuals
Prediction Error', 1, TRUE)
a<-table.row.end(a)
for (i in 1:n) {
a<-table.row.start(a)
a<-table.element(a,i, 1, TRUE)
a<-table.element(a,x[i])
a<-table.element(a,x[i]-mysum$resid[i])
a<-table.element(a,mysum$resid[i])
a<-table.row.end(a)
}
a<-table.end(a)
table.save(a,file='mytable4.tab')
if (n > n25) {
a<-table.start()
a<-table.row.start(a)
a<-table.element(a,'Goldfeld-Quandt test for Heteroskedasticity',4,TRUE)
a<-table.row.end(a)
a<-table.row.start(a)
a<-table.element(a,'p-values',header=TRUE)
a<-table.element(a,'Alternative Hypothesis',3,header=TRUE)
a<-table.row.end(a)
a<-table.row.start(a)
a<-table.element(a,'breakpoint index',header=TRUE)
a<-table.element(a,'greater',header=TRUE)
a<-table.element(a,'2-sided',header=TRUE)
a<-table.element(a,'less',header=TRUE)
a<-table.row.end(a)
for (mypoint in kp3:nmkm3) {
a<-table.row.start(a)
a<-table.element(a,mypoint,header=TRUE)
a<-table.element(a,gqarr[mypoint-kp3+1,1])
a<-table.element(a,gqarr[mypoint-kp3+1,2])
a<-table.element(a,gqarr[mypoint-kp3+1,3])
a<-table.row.end(a)
}
a<-table.end(a)
table.save(a,file='mytable5.tab')
a<-table.start()
a<-table.row.start(a)
a<-table.element(a,'Meta Analysis of Goldfeld-Quandt test for Heteroskedasticity',4,TRUE)
a<-table.row.end(a)
a<-table.row.start(a)
a<-table.element(a,'Description',header=TRUE)
a<-table.element(a,'# significant tests',header=TRUE)
a<-table.element(a,'% significant tests',header=TRUE)
a<-table.element(a,'OK/NOK',header=TRUE)
a<-table.row.end(a)
a<-table.row.start(a)
a<-table.element(a,'1% type I error level',header=TRUE)
a<-table.element(a,numsignificant1)
a<-table.element(a,numsignificant1/numgqtests)
if (numsignificant1/numgqtests < 0.01) dum <- 'OK' else dum <- 'NOK'
a<-table.element(a,dum)
a<-table.row.end(a)
a<-table.row.start(a)
a<-table.element(a,'5% type I error level',header=TRUE)
a<-table.element(a,numsignificant5)
a<-table.element(a,numsignificant5/numgqtests)
if (numsignificant5/numgqtests < 0.05) dum <- 'OK' else dum <- 'NOK'
a<-table.element(a,dum)
a<-table.row.end(a)
a<-table.row.start(a)
a<-table.element(a,'10% type I error level',header=TRUE)
a<-table.element(a,numsignificant10)
a<-table.element(a,numsignificant10/numgqtests)
if (numsignificant10/numgqtests < 0.1) dum <- 'OK' else dum <- 'NOK'
a<-table.element(a,dum)
a<-table.row.end(a)
a<-table.end(a)
table.save(a,file='mytable6.tab')
}