Free Statistics

of Irreproducible Research!

Author's title

Author*The author of this computation has been verified*
R Software Modulerwasp_smp.wasp
Title produced by softwareStandard Deviation-Mean Plot
Date of computationFri, 05 Dec 2008 06:12:40 -0700
Cite this page as followsStatistical Computations at FreeStatistics.org, Office for Research Development and Education, URL https://freestatistics.org/blog/index.php?v=date/2008/Dec/05/t122848285795xk3gpgz0ebdt0.htm/, Retrieved Thu, 16 May 2024 13:34:49 +0000
Statistical Computations at FreeStatistics.org, Office for Research Development and Education, URL https://freestatistics.org/blog/index.php?pk=29238, Retrieved Thu, 16 May 2024 13:34:49 +0000
QR Codes:

Original text written by user:
IsPrivate?No (this computation is public)
User-defined keywords
Estimated Impact208
Family? (F = Feedback message, R = changed R code, M = changed R Module, P = changed Parameters, D = changed Data)
-     [Univariate Data Series] [data set] [2008-12-01 19:54:57] [b98453cac15ba1066b407e146608df68]
- RMP   [Standard Deviation-Mean Plot] [SDMP] [2008-12-05 07:29:02] [c5a66f1c8528a963efc2b82a8519f117]
-    D      [Standard Deviation-Mean Plot] [SDMP] [2008-12-05 13:12:40] [b4fc5040f26b33db57f84cfb8d1d2b82] [Current]
-    D        [Standard Deviation-Mean Plot] [SDMP woninghuur] [2008-12-08 18:10:50] [c5a66f1c8528a963efc2b82a8519f117]
- RM D          [Variance Reduction Matrix] [VRM - woninghuur] [2008-12-08 18:17:24] [c5a66f1c8528a963efc2b82a8519f117]
Feedback Forum

Post a new message
Dataseries X:
1515
1510
1225
1577
1417
1224
1693
1633
1639
1914
1586
1552
2081
1500
1437
1470
1849
1387
1592
1589
1798
1935
1887
2027
2080
1556
1682
1785
1869
1781
2082
2570
1862
1936
1504
1765
1607
1577
1493
1615
1700
1335
1523
1623
1540
1637
1524
1419
1821
1593
1357
1263
1750
1405
1393
1639
1679
1551
1744
1429
1784


Summary of computational transaction
Raw Inputview raw input (R code)
Raw Outputview raw output of R engine
Computing time1 seconds
R Server'George Udny Yule' @ 72.249.76.132

\begin{tabular}{lllllllll}
\hline
Summary of computational transaction \tabularnewline
Raw Input & view raw input (R code)  \tabularnewline
Raw Output & view raw output of R engine  \tabularnewline
Computing time & 1 seconds \tabularnewline
R Server & 'George Udny Yule' @ 72.249.76.132 \tabularnewline
\hline
\end{tabular}
%Source: https://freestatistics.org/blog/index.php?pk=29238&T=0

[TABLE]
[ROW][C]Summary of computational transaction[/C][/ROW]
[ROW][C]Raw Input[/C][C]view raw input (R code) [/C][/ROW]
[ROW][C]Raw Output[/C][C]view raw output of R engine [/C][/ROW]
[ROW][C]Computing time[/C][C]1 seconds[/C][/ROW]
[ROW][C]R Server[/C][C]'George Udny Yule' @ 72.249.76.132[/C][/ROW]
[/TABLE]
Source: https://freestatistics.org/blog/index.php?pk=29238&T=0

Globally Unique Identifier (entire table): ba.freestatistics.org/blog/index.php?pk=29238&T=0

As an alternative you can also use a QR Code:  

The GUIDs for individual cells are displayed in the table below:

Summary of computational transaction
Raw Inputview raw input (R code)
Raw Outputview raw output of R engine
Computing time1 seconds
R Server'George Udny Yule' @ 72.249.76.132


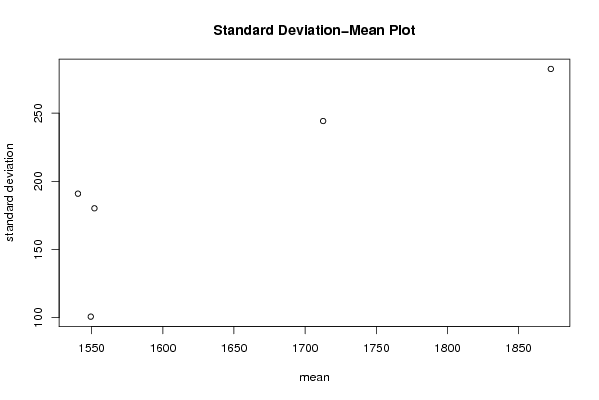
Standard Deviation-Mean Plot
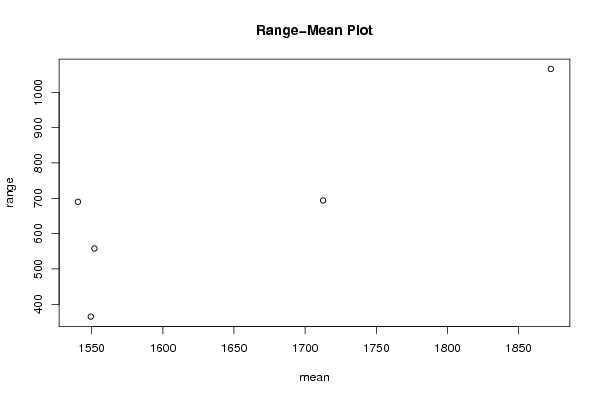
SectionMeanStandard DeviationRange
11540.41666666667190.953806090913690
21712.66666666667244.240318811889694
31872.66666666667282.4320781849661066
41549.41666666667100.786415330398365
51552180.245791780406558

\begin{tabular}{lllllllll}
\hline
Standard Deviation-Mean Plot \tabularnewline
Section & Mean & Standard Deviation & Range \tabularnewline
1 & 1540.41666666667 & 190.953806090913 & 690 \tabularnewline
2 & 1712.66666666667 & 244.240318811889 & 694 \tabularnewline
3 & 1872.66666666667 & 282.432078184966 & 1066 \tabularnewline
4 & 1549.41666666667 & 100.786415330398 & 365 \tabularnewline
5 & 1552 & 180.245791780406 & 558 \tabularnewline
\hline
\end{tabular}
%Source: https://freestatistics.org/blog/index.php?pk=29238&T=1

[TABLE]
[ROW][C]Standard Deviation-Mean Plot[/C][/ROW]
[ROW][C]Section[/C][C]Mean[/C][C]Standard Deviation[/C][C]Range[/C][/ROW]
[ROW][C]1[/C][C]1540.41666666667[/C][C]190.953806090913[/C][C]690[/C][/ROW]
[ROW][C]2[/C][C]1712.66666666667[/C][C]244.240318811889[/C][C]694[/C][/ROW]
[ROW][C]3[/C][C]1872.66666666667[/C][C]282.432078184966[/C][C]1066[/C][/ROW]
[ROW][C]4[/C][C]1549.41666666667[/C][C]100.786415330398[/C][C]365[/C][/ROW]
[ROW][C]5[/C][C]1552[/C][C]180.245791780406[/C][C]558[/C][/ROW]
[/TABLE]
Source: https://freestatistics.org/blog/index.php?pk=29238&T=1

Globally Unique Identifier (entire table): ba.freestatistics.org/blog/index.php?pk=29238&T=1

As an alternative you can also use a QR Code:  

The GUIDs for individual cells are displayed in the table below:

Standard Deviation-Mean Plot
SectionMeanStandard DeviationRange
11540.41666666667190.953806090913690
21712.66666666667244.240318811889694
31872.66666666667282.4320781849661066
41549.41666666667100.786415330398365
51552180.245791780406558


Regression: S.E.(k) = alpha + beta * Mean(k)
alpha-457.94843280254
beta0.399700250091519
S.D.0.146299768920177
T-STAT2.73206344098602
p-value0.071815901494291

\begin{tabular}{lllllllll}
\hline
Regression: S.E.(k) = alpha + beta * Mean(k) \tabularnewline
alpha & -457.94843280254 \tabularnewline
beta & 0.399700250091519 \tabularnewline
S.D. & 0.146299768920177 \tabularnewline
T-STAT & 2.73206344098602 \tabularnewline
p-value & 0.071815901494291 \tabularnewline
\hline
\end{tabular}
%Source: https://freestatistics.org/blog/index.php?pk=29238&T=2

[TABLE]
[ROW][C]Regression: S.E.(k) = alpha + beta * Mean(k)[/C][/ROW]
[ROW][C]alpha[/C][C]-457.94843280254[/C][/ROW]
[ROW][C]beta[/C][C]0.399700250091519[/C][/ROW]
[ROW][C]S.D.[/C][C]0.146299768920177[/C][/ROW]
[ROW][C]T-STAT[/C][C]2.73206344098602[/C][/ROW]
[ROW][C]p-value[/C][C]0.071815901494291[/C][/ROW]
[/TABLE]
Source: https://freestatistics.org/blog/index.php?pk=29238&T=2

Globally Unique Identifier (entire table): ba.freestatistics.org/blog/index.php?pk=29238&T=2

As an alternative you can also use a QR Code:  

The GUIDs for individual cells are displayed in the table below:

Regression: S.E.(k) = alpha + beta * Mean(k)
alpha-457.94843280254
beta0.399700250091519
S.D.0.146299768920177
T-STAT2.73206344098602
p-value0.071815901494291


Regression: ln S.E.(k) = alpha + beta * ln Mean(k)
alpha-20.2318057324376
beta3.44089049161844
S.D.1.75255930415208
T-STAT1.96335181552285
p-value0.144379358966546
Lambda-2.44089049161844

\begin{tabular}{lllllllll}
\hline
Regression: ln S.E.(k) = alpha + beta * ln Mean(k) \tabularnewline
alpha & -20.2318057324376 \tabularnewline
beta & 3.44089049161844 \tabularnewline
S.D. & 1.75255930415208 \tabularnewline
T-STAT & 1.96335181552285 \tabularnewline
p-value & 0.144379358966546 \tabularnewline
Lambda & -2.44089049161844 \tabularnewline
\hline
\end{tabular}
%Source: https://freestatistics.org/blog/index.php?pk=29238&T=3

[TABLE]
[ROW][C]Regression: ln S.E.(k) = alpha + beta * ln Mean(k)[/C][/ROW]
[ROW][C]alpha[/C][C]-20.2318057324376[/C][/ROW]
[ROW][C]beta[/C][C]3.44089049161844[/C][/ROW]
[ROW][C]S.D.[/C][C]1.75255930415208[/C][/ROW]
[ROW][C]T-STAT[/C][C]1.96335181552285[/C][/ROW]
[ROW][C]p-value[/C][C]0.144379358966546[/C][/ROW]
[ROW][C]Lambda[/C][C]-2.44089049161844[/C][/ROW]
[/TABLE]
Source: https://freestatistics.org/blog/index.php?pk=29238&T=3

Globally Unique Identifier (entire table): ba.freestatistics.org/blog/index.php?pk=29238&T=3

As an alternative you can also use a QR Code:  

The GUIDs for individual cells are displayed in the table below:

Regression: ln S.E.(k) = alpha + beta * ln Mean(k)
alpha-20.2318057324376
beta3.44089049161844
S.D.1.75255930415208
T-STAT1.96335181552285
p-value0.144379358966546
Lambda-2.44089049161844


Parameters (Session):
par1 = 12 ;
Parameters (R input):
par1 = 12 ;
R code (references can be found in the software module):
par1 <- as.numeric(par1)
(n <- length(x))
(np <- floor(n / par1))
arr <- array(NA,dim=c(par1,np))
j <- 0
k <- 1
for (i in 1:(np*par1))
{
j = j + 1
arr[j,k] <- x[i]
if (j == par1) {
j = 0
k=k+1
}
}
arr
arr.mean <- array(NA,dim=np)
arr.sd <- array(NA,dim=np)
arr.range <- array(NA,dim=np)
for (j in 1:np)
{
arr.mean[j] <- mean(arr[,j],na.rm=TRUE)
arr.sd[j] <- sd(arr[,j],na.rm=TRUE)
arr.range[j] <- max(arr[,j],na.rm=TRUE) - min(arr[,j],na.rm=TRUE)
}
arr.mean
arr.sd
arr.range
(lm1 <- lm(arr.sd~arr.mean))
(lnlm1 <- lm(log(arr.sd)~log(arr.mean)))
(lm2 <- lm(arr.range~arr.mean))
bitmap(file='test1.png')
plot(arr.mean,arr.sd,main='Standard Deviation-Mean Plot',xlab='mean',ylab='standard deviation')
dev.off()
bitmap(file='test2.png')
plot(arr.mean,arr.range,main='Range-Mean Plot',xlab='mean',ylab='range')
dev.off()
load(file='createtable')
a<-table.start()
a<-table.row.start(a)
a<-table.element(a,'Standard Deviation-Mean Plot',4,TRUE)
a<-table.row.end(a)
a<-table.row.start(a)
a<-table.element(a,'Section',header=TRUE)
a<-table.element(a,'Mean',header=TRUE)
a<-table.element(a,'Standard Deviation',header=TRUE)
a<-table.element(a,'Range',header=TRUE)
a<-table.row.end(a)
for (j in 1:np) {
a<-table.row.start(a)
a<-table.element(a,j,header=TRUE)
a<-table.element(a,arr.mean[j])
a<-table.element(a,arr.sd[j] )
a<-table.element(a,arr.range[j] )
a<-table.row.end(a)
}
a<-table.end(a)
table.save(a,file='mytable.tab')
a<-table.start()
a<-table.row.start(a)
a<-table.element(a,'Regression: S.E.(k) = alpha + beta * Mean(k)',2,TRUE)
a<-table.row.end(a)
a<-table.row.start(a)
a<-table.element(a,'alpha',header=TRUE)
a<-table.element(a,lm1$coefficients[[1]])
a<-table.row.end(a)
a<-table.row.start(a)
a<-table.element(a,'beta',header=TRUE)
a<-table.element(a,lm1$coefficients[[2]])
a<-table.row.end(a)
a<-table.row.start(a)
a<-table.element(a,'S.D.',header=TRUE)
a<-table.element(a,summary(lm1)$coefficients[2,2])
a<-table.row.end(a)
a<-table.row.start(a)
a<-table.element(a,'T-STAT',header=TRUE)
a<-table.element(a,summary(lm1)$coefficients[2,3])
a<-table.row.end(a)
a<-table.row.start(a)
a<-table.element(a,'p-value',header=TRUE)
a<-table.element(a,summary(lm1)$coefficients[2,4])
a<-table.row.end(a)
a<-table.end(a)
table.save(a,file='mytable1.tab')
a<-table.start()
a<-table.row.start(a)
a<-table.element(a,'Regression: ln S.E.(k) = alpha + beta * ln Mean(k)',2,TRUE)
a<-table.row.end(a)
a<-table.row.start(a)
a<-table.element(a,'alpha',header=TRUE)
a<-table.element(a,lnlm1$coefficients[[1]])
a<-table.row.end(a)
a<-table.row.start(a)
a<-table.element(a,'beta',header=TRUE)
a<-table.element(a,lnlm1$coefficients[[2]])
a<-table.row.end(a)
a<-table.row.start(a)
a<-table.element(a,'S.D.',header=TRUE)
a<-table.element(a,summary(lnlm1)$coefficients[2,2])
a<-table.row.end(a)
a<-table.row.start(a)
a<-table.element(a,'T-STAT',header=TRUE)
a<-table.element(a,summary(lnlm1)$coefficients[2,3])
a<-table.row.end(a)
a<-table.row.start(a)
a<-table.element(a,'p-value',header=TRUE)
a<-table.element(a,summary(lnlm1)$coefficients[2,4])
a<-table.row.end(a)
a<-table.row.start(a)
a<-table.element(a,'Lambda',header=TRUE)
a<-table.element(a,1-lnlm1$coefficients[[2]])
a<-table.row.end(a)
a<-table.end(a)
table.save(a,file='mytable2.tab')