Free Statistics

of Irreproducible Research!

Author's title

Author*The author of this computation has been verified*
R Software Modulerwasp_autocorrelation.wasp
Title produced by software(Partial) Autocorrelation Function
Date of computationFri, 05 Dec 2008 06:00:50 -0700
Cite this page as followsStatistical Computations at FreeStatistics.org, Office for Research Development and Education, URL https://freestatistics.org/blog/index.php?v=date/2008/Dec/05/t1228482088pcwxxsw78cbq9cn.htm/, Retrieved Thu, 16 May 2024 18:53:23 +0000
Statistical Computations at FreeStatistics.org, Office for Research Development and Education, URL https://freestatistics.org/blog/index.php?pk=29224, Retrieved Thu, 16 May 2024 18:53:23 +0000
QR Codes:

Original text written by user:
IsPrivate?No (this computation is public)
User-defined keywords
Estimated Impact199
Family? (F = Feedback message, R = changed R code, M = changed R Module, P = changed Parameters, D = changed Data)
-     [Univariate Data Series] [data set] [2008-12-01 19:54:57] [b98453cac15ba1066b407e146608df68]
- RMP   [(Partial) Autocorrelation Function] [ACF] [2008-12-05 06:53:00] [c5a66f1c8528a963efc2b82a8519f117]
-    D      [(Partial) Autocorrelation Function] [ACF bouwvergunnin...] [2008-12-05 13:00:50] [b4fc5040f26b33db57f84cfb8d1d2b82] [Current]
-    D        [(Partial) Autocorrelation Function] [ACF - woninghuur] [2008-12-08 18:21:00] [c5a66f1c8528a963efc2b82a8519f117]
-   PD        [(Partial) Autocorrelation Function] [ACF - woninghuur ...] [2008-12-08 18:23:47] [c5a66f1c8528a963efc2b82a8519f117]
Feedback Forum

Post a new message
Dataseries X:
1515
1510
1225
1577
1417
1224
1693
1633
1639
1914
1586
1552
2081
1500
1437
1470
1849
1387
1592
1589
1798
1935
1887
2027
2080
1556
1682
1785
1869
1781
2082
2570
1862
1936
1504
1765
1607
1577
1493
1615
1700
1335
1523
1623
1540
1637
1524
1419
1821
1593
1357
1263
1750
1405
1393
1639
1679
1551
1744
1429
1784


Summary of computational transaction
Raw Inputview raw input (R code)
Raw Outputview raw output of R engine
Computing time2 seconds
R Server'Gwilym Jenkins' @ 72.249.127.135

\begin{tabular}{lllllllll}
\hline
Summary of computational transaction \tabularnewline
Raw Input & view raw input (R code)  \tabularnewline
Raw Output & view raw output of R engine  \tabularnewline
Computing time & 2 seconds \tabularnewline
R Server & 'Gwilym Jenkins' @ 72.249.127.135 \tabularnewline
\hline
\end{tabular}
%Source: https://freestatistics.org/blog/index.php?pk=29224&T=0

[TABLE]
[ROW][C]Summary of computational transaction[/C][/ROW]
[ROW][C]Raw Input[/C][C]view raw input (R code) [/C][/ROW]
[ROW][C]Raw Output[/C][C]view raw output of R engine [/C][/ROW]
[ROW][C]Computing time[/C][C]2 seconds[/C][/ROW]
[ROW][C]R Server[/C][C]'Gwilym Jenkins' @ 72.249.127.135[/C][/ROW]
[/TABLE]
Source: https://freestatistics.org/blog/index.php?pk=29224&T=0

Globally Unique Identifier (entire table): ba.freestatistics.org/blog/index.php?pk=29224&T=0

As an alternative you can also use a QR Code:  

The GUIDs for individual cells are displayed in the table below:

Summary of computational transaction
Raw Inputview raw input (R code)
Raw Outputview raw output of R engine
Computing time2 seconds
R Server'Gwilym Jenkins' @ 72.249.127.135


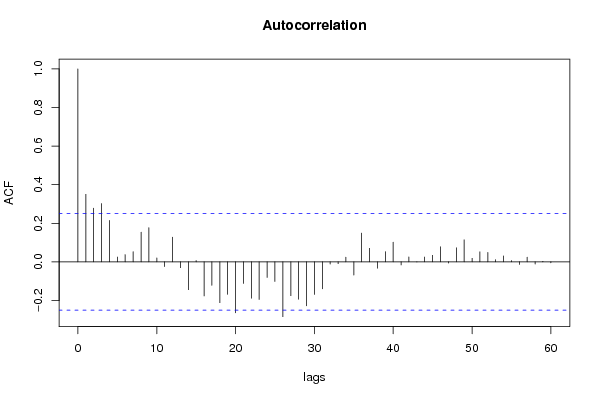
Autocorrelation Function
Time lag kACF(k)T-STATP-value
10.3502162.73530.004075
20.2782152.17290.01684
30.3020552.35910.010768
40.2146821.67670.049357
50.0251050.19610.422601
60.0374050.29210.385586
70.0526130.41090.341287
80.1536611.20010.117364
90.1769251.38180.086032
100.0202430.15810.43745
11-0.024552-0.19180.424285
120.1279190.99910.160851
13-0.030018-0.23440.407712
14-0.144339-1.12730.132011
150.006620.05170.479468
16-0.176718-1.38020.08628
17-0.121842-0.95160.172524
18-0.212021-1.65590.051436
19-0.168466-1.31580.096589
20-0.264137-2.0630.02169
21-0.112161-0.8760.192231
22-0.188751-1.47420.072786
23-0.194944-1.52260.066518
24-0.08106-0.63310.264518
25-0.101566-0.79330.215351
26-0.284167-2.21940.015093
27-0.175697-1.37220.087507
28-0.193491-1.51120.067949
29-0.228276-1.78290.03979
30-0.169288-1.32220.095523
31-0.139546-1.08990.140024
32-0.011543-0.09020.464229
33-0.009371-0.07320.470947
340.0243640.19030.424859
35-0.068276-0.53330.297898
360.1489051.1630.124682
370.0701850.54820.29279
38-0.033128-0.25870.398353
390.0525080.41010.341585
400.1019830.79650.214411
41-0.016242-0.12690.449737
420.025450.19880.421553
43-0.000647-0.00510.497992
440.024620.19230.424078
450.0340580.2660.395568
460.0781950.61070.271826
47-0.006215-0.04850.480721
480.0727190.5680.286077
490.1140050.89040.188373
500.0183710.14350.443192
510.0518880.40530.343354
520.0488550.38160.352053
530.0111340.0870.465495
540.0305520.23860.406099
550.0068580.05360.478728
56-0.013797-0.10780.457271
570.0239190.18680.426214
58-0.011693-0.09130.463766
590.0029770.02330.490762
60-0.005251-0.0410.483709

\begin{tabular}{lllllllll}
\hline
Autocorrelation Function \tabularnewline
Time lag k & ACF(k) & T-STAT & P-value \tabularnewline
1 & 0.350216 & 2.7353 & 0.004075 \tabularnewline
2 & 0.278215 & 2.1729 & 0.01684 \tabularnewline
3 & 0.302055 & 2.3591 & 0.010768 \tabularnewline
4 & 0.214682 & 1.6767 & 0.049357 \tabularnewline
5 & 0.025105 & 0.1961 & 0.422601 \tabularnewline
6 & 0.037405 & 0.2921 & 0.385586 \tabularnewline
7 & 0.052613 & 0.4109 & 0.341287 \tabularnewline
8 & 0.153661 & 1.2001 & 0.117364 \tabularnewline
9 & 0.176925 & 1.3818 & 0.086032 \tabularnewline
10 & 0.020243 & 0.1581 & 0.43745 \tabularnewline
11 & -0.024552 & -0.1918 & 0.424285 \tabularnewline
12 & 0.127919 & 0.9991 & 0.160851 \tabularnewline
13 & -0.030018 & -0.2344 & 0.407712 \tabularnewline
14 & -0.144339 & -1.1273 & 0.132011 \tabularnewline
15 & 0.00662 & 0.0517 & 0.479468 \tabularnewline
16 & -0.176718 & -1.3802 & 0.08628 \tabularnewline
17 & -0.121842 & -0.9516 & 0.172524 \tabularnewline
18 & -0.212021 & -1.6559 & 0.051436 \tabularnewline
19 & -0.168466 & -1.3158 & 0.096589 \tabularnewline
20 & -0.264137 & -2.063 & 0.02169 \tabularnewline
21 & -0.112161 & -0.876 & 0.192231 \tabularnewline
22 & -0.188751 & -1.4742 & 0.072786 \tabularnewline
23 & -0.194944 & -1.5226 & 0.066518 \tabularnewline
24 & -0.08106 & -0.6331 & 0.264518 \tabularnewline
25 & -0.101566 & -0.7933 & 0.215351 \tabularnewline
26 & -0.284167 & -2.2194 & 0.015093 \tabularnewline
27 & -0.175697 & -1.3722 & 0.087507 \tabularnewline
28 & -0.193491 & -1.5112 & 0.067949 \tabularnewline
29 & -0.228276 & -1.7829 & 0.03979 \tabularnewline
30 & -0.169288 & -1.3222 & 0.095523 \tabularnewline
31 & -0.139546 & -1.0899 & 0.140024 \tabularnewline
32 & -0.011543 & -0.0902 & 0.464229 \tabularnewline
33 & -0.009371 & -0.0732 & 0.470947 \tabularnewline
34 & 0.024364 & 0.1903 & 0.424859 \tabularnewline
35 & -0.068276 & -0.5333 & 0.297898 \tabularnewline
36 & 0.148905 & 1.163 & 0.124682 \tabularnewline
37 & 0.070185 & 0.5482 & 0.29279 \tabularnewline
38 & -0.033128 & -0.2587 & 0.398353 \tabularnewline
39 & 0.052508 & 0.4101 & 0.341585 \tabularnewline
40 & 0.101983 & 0.7965 & 0.214411 \tabularnewline
41 & -0.016242 & -0.1269 & 0.449737 \tabularnewline
42 & 0.02545 & 0.1988 & 0.421553 \tabularnewline
43 & -0.000647 & -0.0051 & 0.497992 \tabularnewline
44 & 0.02462 & 0.1923 & 0.424078 \tabularnewline
45 & 0.034058 & 0.266 & 0.395568 \tabularnewline
46 & 0.078195 & 0.6107 & 0.271826 \tabularnewline
47 & -0.006215 & -0.0485 & 0.480721 \tabularnewline
48 & 0.072719 & 0.568 & 0.286077 \tabularnewline
49 & 0.114005 & 0.8904 & 0.188373 \tabularnewline
50 & 0.018371 & 0.1435 & 0.443192 \tabularnewline
51 & 0.051888 & 0.4053 & 0.343354 \tabularnewline
52 & 0.048855 & 0.3816 & 0.352053 \tabularnewline
53 & 0.011134 & 0.087 & 0.465495 \tabularnewline
54 & 0.030552 & 0.2386 & 0.406099 \tabularnewline
55 & 0.006858 & 0.0536 & 0.478728 \tabularnewline
56 & -0.013797 & -0.1078 & 0.457271 \tabularnewline
57 & 0.023919 & 0.1868 & 0.426214 \tabularnewline
58 & -0.011693 & -0.0913 & 0.463766 \tabularnewline
59 & 0.002977 & 0.0233 & 0.490762 \tabularnewline
60 & -0.005251 & -0.041 & 0.483709 \tabularnewline
\hline
\end{tabular}
%Source: https://freestatistics.org/blog/index.php?pk=29224&T=1

[TABLE]
[ROW][C]Autocorrelation Function[/C][/ROW]
[ROW][C]Time lag k[/C][C]ACF(k)[/C][C]T-STAT[/C][C]P-value[/C][/ROW]
[ROW][C]1[/C][C]0.350216[/C][C]2.7353[/C][C]0.004075[/C][/ROW]
[ROW][C]2[/C][C]0.278215[/C][C]2.1729[/C][C]0.01684[/C][/ROW]
[ROW][C]3[/C][C]0.302055[/C][C]2.3591[/C][C]0.010768[/C][/ROW]
[ROW][C]4[/C][C]0.214682[/C][C]1.6767[/C][C]0.049357[/C][/ROW]
[ROW][C]5[/C][C]0.025105[/C][C]0.1961[/C][C]0.422601[/C][/ROW]
[ROW][C]6[/C][C]0.037405[/C][C]0.2921[/C][C]0.385586[/C][/ROW]
[ROW][C]7[/C][C]0.052613[/C][C]0.4109[/C][C]0.341287[/C][/ROW]
[ROW][C]8[/C][C]0.153661[/C][C]1.2001[/C][C]0.117364[/C][/ROW]
[ROW][C]9[/C][C]0.176925[/C][C]1.3818[/C][C]0.086032[/C][/ROW]
[ROW][C]10[/C][C]0.020243[/C][C]0.1581[/C][C]0.43745[/C][/ROW]
[ROW][C]11[/C][C]-0.024552[/C][C]-0.1918[/C][C]0.424285[/C][/ROW]
[ROW][C]12[/C][C]0.127919[/C][C]0.9991[/C][C]0.160851[/C][/ROW]
[ROW][C]13[/C][C]-0.030018[/C][C]-0.2344[/C][C]0.407712[/C][/ROW]
[ROW][C]14[/C][C]-0.144339[/C][C]-1.1273[/C][C]0.132011[/C][/ROW]
[ROW][C]15[/C][C]0.00662[/C][C]0.0517[/C][C]0.479468[/C][/ROW]
[ROW][C]16[/C][C]-0.176718[/C][C]-1.3802[/C][C]0.08628[/C][/ROW]
[ROW][C]17[/C][C]-0.121842[/C][C]-0.9516[/C][C]0.172524[/C][/ROW]
[ROW][C]18[/C][C]-0.212021[/C][C]-1.6559[/C][C]0.051436[/C][/ROW]
[ROW][C]19[/C][C]-0.168466[/C][C]-1.3158[/C][C]0.096589[/C][/ROW]
[ROW][C]20[/C][C]-0.264137[/C][C]-2.063[/C][C]0.02169[/C][/ROW]
[ROW][C]21[/C][C]-0.112161[/C][C]-0.876[/C][C]0.192231[/C][/ROW]
[ROW][C]22[/C][C]-0.188751[/C][C]-1.4742[/C][C]0.072786[/C][/ROW]
[ROW][C]23[/C][C]-0.194944[/C][C]-1.5226[/C][C]0.066518[/C][/ROW]
[ROW][C]24[/C][C]-0.08106[/C][C]-0.6331[/C][C]0.264518[/C][/ROW]
[ROW][C]25[/C][C]-0.101566[/C][C]-0.7933[/C][C]0.215351[/C][/ROW]
[ROW][C]26[/C][C]-0.284167[/C][C]-2.2194[/C][C]0.015093[/C][/ROW]
[ROW][C]27[/C][C]-0.175697[/C][C]-1.3722[/C][C]0.087507[/C][/ROW]
[ROW][C]28[/C][C]-0.193491[/C][C]-1.5112[/C][C]0.067949[/C][/ROW]
[ROW][C]29[/C][C]-0.228276[/C][C]-1.7829[/C][C]0.03979[/C][/ROW]
[ROW][C]30[/C][C]-0.169288[/C][C]-1.3222[/C][C]0.095523[/C][/ROW]
[ROW][C]31[/C][C]-0.139546[/C][C]-1.0899[/C][C]0.140024[/C][/ROW]
[ROW][C]32[/C][C]-0.011543[/C][C]-0.0902[/C][C]0.464229[/C][/ROW]
[ROW][C]33[/C][C]-0.009371[/C][C]-0.0732[/C][C]0.470947[/C][/ROW]
[ROW][C]34[/C][C]0.024364[/C][C]0.1903[/C][C]0.424859[/C][/ROW]
[ROW][C]35[/C][C]-0.068276[/C][C]-0.5333[/C][C]0.297898[/C][/ROW]
[ROW][C]36[/C][C]0.148905[/C][C]1.163[/C][C]0.124682[/C][/ROW]
[ROW][C]37[/C][C]0.070185[/C][C]0.5482[/C][C]0.29279[/C][/ROW]
[ROW][C]38[/C][C]-0.033128[/C][C]-0.2587[/C][C]0.398353[/C][/ROW]
[ROW][C]39[/C][C]0.052508[/C][C]0.4101[/C][C]0.341585[/C][/ROW]
[ROW][C]40[/C][C]0.101983[/C][C]0.7965[/C][C]0.214411[/C][/ROW]
[ROW][C]41[/C][C]-0.016242[/C][C]-0.1269[/C][C]0.449737[/C][/ROW]
[ROW][C]42[/C][C]0.02545[/C][C]0.1988[/C][C]0.421553[/C][/ROW]
[ROW][C]43[/C][C]-0.000647[/C][C]-0.0051[/C][C]0.497992[/C][/ROW]
[ROW][C]44[/C][C]0.02462[/C][C]0.1923[/C][C]0.424078[/C][/ROW]
[ROW][C]45[/C][C]0.034058[/C][C]0.266[/C][C]0.395568[/C][/ROW]
[ROW][C]46[/C][C]0.078195[/C][C]0.6107[/C][C]0.271826[/C][/ROW]
[ROW][C]47[/C][C]-0.006215[/C][C]-0.0485[/C][C]0.480721[/C][/ROW]
[ROW][C]48[/C][C]0.072719[/C][C]0.568[/C][C]0.286077[/C][/ROW]
[ROW][C]49[/C][C]0.114005[/C][C]0.8904[/C][C]0.188373[/C][/ROW]
[ROW][C]50[/C][C]0.018371[/C][C]0.1435[/C][C]0.443192[/C][/ROW]
[ROW][C]51[/C][C]0.051888[/C][C]0.4053[/C][C]0.343354[/C][/ROW]
[ROW][C]52[/C][C]0.048855[/C][C]0.3816[/C][C]0.352053[/C][/ROW]
[ROW][C]53[/C][C]0.011134[/C][C]0.087[/C][C]0.465495[/C][/ROW]
[ROW][C]54[/C][C]0.030552[/C][C]0.2386[/C][C]0.406099[/C][/ROW]
[ROW][C]55[/C][C]0.006858[/C][C]0.0536[/C][C]0.478728[/C][/ROW]
[ROW][C]56[/C][C]-0.013797[/C][C]-0.1078[/C][C]0.457271[/C][/ROW]
[ROW][C]57[/C][C]0.023919[/C][C]0.1868[/C][C]0.426214[/C][/ROW]
[ROW][C]58[/C][C]-0.011693[/C][C]-0.0913[/C][C]0.463766[/C][/ROW]
[ROW][C]59[/C][C]0.002977[/C][C]0.0233[/C][C]0.490762[/C][/ROW]
[ROW][C]60[/C][C]-0.005251[/C][C]-0.041[/C][C]0.483709[/C][/ROW]
[/TABLE]
Source: https://freestatistics.org/blog/index.php?pk=29224&T=1

Globally Unique Identifier (entire table): ba.freestatistics.org/blog/index.php?pk=29224&T=1

As an alternative you can also use a QR Code:  

The GUIDs for individual cells are displayed in the table below:

Autocorrelation Function
Time lag kACF(k)T-STATP-value
10.3502162.73530.004075
20.2782152.17290.01684
30.3020552.35910.010768
40.2146821.67670.049357
50.0251050.19610.422601
60.0374050.29210.385586
70.0526130.41090.341287
80.1536611.20010.117364
90.1769251.38180.086032
100.0202430.15810.43745
11-0.024552-0.19180.424285
120.1279190.99910.160851
13-0.030018-0.23440.407712
14-0.144339-1.12730.132011
150.006620.05170.479468
16-0.176718-1.38020.08628
17-0.121842-0.95160.172524
18-0.212021-1.65590.051436
19-0.168466-1.31580.096589
20-0.264137-2.0630.02169
21-0.112161-0.8760.192231
22-0.188751-1.47420.072786
23-0.194944-1.52260.066518
24-0.08106-0.63310.264518
25-0.101566-0.79330.215351
26-0.284167-2.21940.015093
27-0.175697-1.37220.087507
28-0.193491-1.51120.067949
29-0.228276-1.78290.03979
30-0.169288-1.32220.095523
31-0.139546-1.08990.140024
32-0.011543-0.09020.464229
33-0.009371-0.07320.470947
340.0243640.19030.424859
35-0.068276-0.53330.297898
360.1489051.1630.124682
370.0701850.54820.29279
38-0.033128-0.25870.398353
390.0525080.41010.341585
400.1019830.79650.214411
41-0.016242-0.12690.449737
420.025450.19880.421553
43-0.000647-0.00510.497992
440.024620.19230.424078
450.0340580.2660.395568
460.0781950.61070.271826
47-0.006215-0.04850.480721
480.0727190.5680.286077
490.1140050.89040.188373
500.0183710.14350.443192
510.0518880.40530.343354
520.0488550.38160.352053
530.0111340.0870.465495
540.0305520.23860.406099
550.0068580.05360.478728
56-0.013797-0.10780.457271
570.0239190.18680.426214
58-0.011693-0.09130.463766
590.0029770.02330.490762
60-0.005251-0.0410.483709


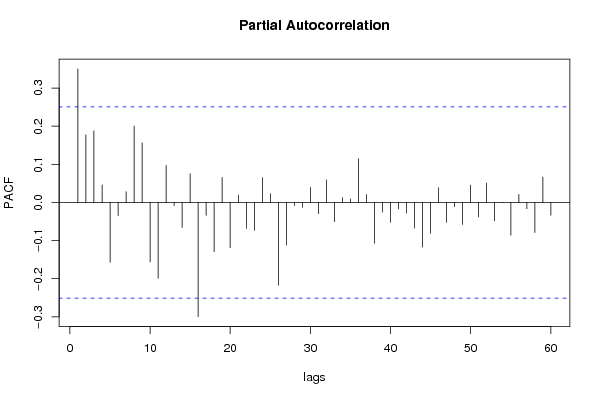
Partial Autocorrelation Function
Time lag kPACF(k)T-STATP-value
10.3502162.73530.004075
20.1773121.38480.085572
30.1880511.46870.073523
40.0458830.35840.360655
5-0.15692-1.22560.112532
6-0.034484-0.26930.394294
70.0283920.22170.412625
80.2003421.56470.061411
90.1565841.2230.113024
10-0.156077-1.2190.113769
11-0.198973-1.5540.062676
120.0970360.75790.225721
13-0.008289-0.06470.474297
14-0.065659-0.51280.304966
150.0750330.5860.280009
16-0.299529-2.33940.011303
17-0.03356-0.26210.39706
18-0.129208-1.00910.158445
190.0654910.51150.305424
20-0.119086-0.93010.177995
210.0190030.14840.44125
22-0.068267-0.53320.297922
23-0.073266-0.57220.284637
240.0652830.50990.305988
250.0227410.17760.429809
26-0.217132-1.69590.047506
27-0.111896-0.87390.19279
28-0.008192-0.0640.474598
29-0.012356-0.09650.461718
300.0395240.30870.379304
31-0.02939-0.22950.409609
320.0590950.46150.323025
33-0.05054-0.39470.347208
340.0127440.09950.46052
350.0091320.07130.471686
360.1149370.89770.186442
370.0211340.16510.43472
38-0.107161-0.8370.202942
39-0.025341-0.19790.421882
40-0.051612-0.40310.34414
41-0.017042-0.13310.447275
42-0.027717-0.21650.41467
43-0.067235-0.52510.300702
44-0.117093-0.91450.182021
45-0.081333-0.63520.263827
460.0387890.3030.381478
47-0.051968-0.40590.343124
48-0.010959-0.08560.466037
49-0.057693-0.45060.326939
500.0453410.35410.362232
51-0.038137-0.29790.383411
520.0508080.39680.346441
53-0.047896-0.37410.354822
54-0.000443-0.00350.498624
55-0.085925-0.67110.252347
560.0210740.16460.434903
57-0.016424-0.12830.449178
58-0.078963-0.61670.269856
590.0665270.51960.302613
60-0.033335-0.26040.397732

\begin{tabular}{lllllllll}
\hline
Partial Autocorrelation Function \tabularnewline
Time lag k & PACF(k) & T-STAT & P-value \tabularnewline
1 & 0.350216 & 2.7353 & 0.004075 \tabularnewline
2 & 0.177312 & 1.3848 & 0.085572 \tabularnewline
3 & 0.188051 & 1.4687 & 0.073523 \tabularnewline
4 & 0.045883 & 0.3584 & 0.360655 \tabularnewline
5 & -0.15692 & -1.2256 & 0.112532 \tabularnewline
6 & -0.034484 & -0.2693 & 0.394294 \tabularnewline
7 & 0.028392 & 0.2217 & 0.412625 \tabularnewline
8 & 0.200342 & 1.5647 & 0.061411 \tabularnewline
9 & 0.156584 & 1.223 & 0.113024 \tabularnewline
10 & -0.156077 & -1.219 & 0.113769 \tabularnewline
11 & -0.198973 & -1.554 & 0.062676 \tabularnewline
12 & 0.097036 & 0.7579 & 0.225721 \tabularnewline
13 & -0.008289 & -0.0647 & 0.474297 \tabularnewline
14 & -0.065659 & -0.5128 & 0.304966 \tabularnewline
15 & 0.075033 & 0.586 & 0.280009 \tabularnewline
16 & -0.299529 & -2.3394 & 0.011303 \tabularnewline
17 & -0.03356 & -0.2621 & 0.39706 \tabularnewline
18 & -0.129208 & -1.0091 & 0.158445 \tabularnewline
19 & 0.065491 & 0.5115 & 0.305424 \tabularnewline
20 & -0.119086 & -0.9301 & 0.177995 \tabularnewline
21 & 0.019003 & 0.1484 & 0.44125 \tabularnewline
22 & -0.068267 & -0.5332 & 0.297922 \tabularnewline
23 & -0.073266 & -0.5722 & 0.284637 \tabularnewline
24 & 0.065283 & 0.5099 & 0.305988 \tabularnewline
25 & 0.022741 & 0.1776 & 0.429809 \tabularnewline
26 & -0.217132 & -1.6959 & 0.047506 \tabularnewline
27 & -0.111896 & -0.8739 & 0.19279 \tabularnewline
28 & -0.008192 & -0.064 & 0.474598 \tabularnewline
29 & -0.012356 & -0.0965 & 0.461718 \tabularnewline
30 & 0.039524 & 0.3087 & 0.379304 \tabularnewline
31 & -0.02939 & -0.2295 & 0.409609 \tabularnewline
32 & 0.059095 & 0.4615 & 0.323025 \tabularnewline
33 & -0.05054 & -0.3947 & 0.347208 \tabularnewline
34 & 0.012744 & 0.0995 & 0.46052 \tabularnewline
35 & 0.009132 & 0.0713 & 0.471686 \tabularnewline
36 & 0.114937 & 0.8977 & 0.186442 \tabularnewline
37 & 0.021134 & 0.1651 & 0.43472 \tabularnewline
38 & -0.107161 & -0.837 & 0.202942 \tabularnewline
39 & -0.025341 & -0.1979 & 0.421882 \tabularnewline
40 & -0.051612 & -0.4031 & 0.34414 \tabularnewline
41 & -0.017042 & -0.1331 & 0.447275 \tabularnewline
42 & -0.027717 & -0.2165 & 0.41467 \tabularnewline
43 & -0.067235 & -0.5251 & 0.300702 \tabularnewline
44 & -0.117093 & -0.9145 & 0.182021 \tabularnewline
45 & -0.081333 & -0.6352 & 0.263827 \tabularnewline
46 & 0.038789 & 0.303 & 0.381478 \tabularnewline
47 & -0.051968 & -0.4059 & 0.343124 \tabularnewline
48 & -0.010959 & -0.0856 & 0.466037 \tabularnewline
49 & -0.057693 & -0.4506 & 0.326939 \tabularnewline
50 & 0.045341 & 0.3541 & 0.362232 \tabularnewline
51 & -0.038137 & -0.2979 & 0.383411 \tabularnewline
52 & 0.050808 & 0.3968 & 0.346441 \tabularnewline
53 & -0.047896 & -0.3741 & 0.354822 \tabularnewline
54 & -0.000443 & -0.0035 & 0.498624 \tabularnewline
55 & -0.085925 & -0.6711 & 0.252347 \tabularnewline
56 & 0.021074 & 0.1646 & 0.434903 \tabularnewline
57 & -0.016424 & -0.1283 & 0.449178 \tabularnewline
58 & -0.078963 & -0.6167 & 0.269856 \tabularnewline
59 & 0.066527 & 0.5196 & 0.302613 \tabularnewline
60 & -0.033335 & -0.2604 & 0.397732 \tabularnewline
\hline
\end{tabular}
%Source: https://freestatistics.org/blog/index.php?pk=29224&T=2

[TABLE]
[ROW][C]Partial Autocorrelation Function[/C][/ROW]
[ROW][C]Time lag k[/C][C]PACF(k)[/C][C]T-STAT[/C][C]P-value[/C][/ROW]
[ROW][C]1[/C][C]0.350216[/C][C]2.7353[/C][C]0.004075[/C][/ROW]
[ROW][C]2[/C][C]0.177312[/C][C]1.3848[/C][C]0.085572[/C][/ROW]
[ROW][C]3[/C][C]0.188051[/C][C]1.4687[/C][C]0.073523[/C][/ROW]
[ROW][C]4[/C][C]0.045883[/C][C]0.3584[/C][C]0.360655[/C][/ROW]
[ROW][C]5[/C][C]-0.15692[/C][C]-1.2256[/C][C]0.112532[/C][/ROW]
[ROW][C]6[/C][C]-0.034484[/C][C]-0.2693[/C][C]0.394294[/C][/ROW]
[ROW][C]7[/C][C]0.028392[/C][C]0.2217[/C][C]0.412625[/C][/ROW]
[ROW][C]8[/C][C]0.200342[/C][C]1.5647[/C][C]0.061411[/C][/ROW]
[ROW][C]9[/C][C]0.156584[/C][C]1.223[/C][C]0.113024[/C][/ROW]
[ROW][C]10[/C][C]-0.156077[/C][C]-1.219[/C][C]0.113769[/C][/ROW]
[ROW][C]11[/C][C]-0.198973[/C][C]-1.554[/C][C]0.062676[/C][/ROW]
[ROW][C]12[/C][C]0.097036[/C][C]0.7579[/C][C]0.225721[/C][/ROW]
[ROW][C]13[/C][C]-0.008289[/C][C]-0.0647[/C][C]0.474297[/C][/ROW]
[ROW][C]14[/C][C]-0.065659[/C][C]-0.5128[/C][C]0.304966[/C][/ROW]
[ROW][C]15[/C][C]0.075033[/C][C]0.586[/C][C]0.280009[/C][/ROW]
[ROW][C]16[/C][C]-0.299529[/C][C]-2.3394[/C][C]0.011303[/C][/ROW]
[ROW][C]17[/C][C]-0.03356[/C][C]-0.2621[/C][C]0.39706[/C][/ROW]
[ROW][C]18[/C][C]-0.129208[/C][C]-1.0091[/C][C]0.158445[/C][/ROW]
[ROW][C]19[/C][C]0.065491[/C][C]0.5115[/C][C]0.305424[/C][/ROW]
[ROW][C]20[/C][C]-0.119086[/C][C]-0.9301[/C][C]0.177995[/C][/ROW]
[ROW][C]21[/C][C]0.019003[/C][C]0.1484[/C][C]0.44125[/C][/ROW]
[ROW][C]22[/C][C]-0.068267[/C][C]-0.5332[/C][C]0.297922[/C][/ROW]
[ROW][C]23[/C][C]-0.073266[/C][C]-0.5722[/C][C]0.284637[/C][/ROW]
[ROW][C]24[/C][C]0.065283[/C][C]0.5099[/C][C]0.305988[/C][/ROW]
[ROW][C]25[/C][C]0.022741[/C][C]0.1776[/C][C]0.429809[/C][/ROW]
[ROW][C]26[/C][C]-0.217132[/C][C]-1.6959[/C][C]0.047506[/C][/ROW]
[ROW][C]27[/C][C]-0.111896[/C][C]-0.8739[/C][C]0.19279[/C][/ROW]
[ROW][C]28[/C][C]-0.008192[/C][C]-0.064[/C][C]0.474598[/C][/ROW]
[ROW][C]29[/C][C]-0.012356[/C][C]-0.0965[/C][C]0.461718[/C][/ROW]
[ROW][C]30[/C][C]0.039524[/C][C]0.3087[/C][C]0.379304[/C][/ROW]
[ROW][C]31[/C][C]-0.02939[/C][C]-0.2295[/C][C]0.409609[/C][/ROW]
[ROW][C]32[/C][C]0.059095[/C][C]0.4615[/C][C]0.323025[/C][/ROW]
[ROW][C]33[/C][C]-0.05054[/C][C]-0.3947[/C][C]0.347208[/C][/ROW]
[ROW][C]34[/C][C]0.012744[/C][C]0.0995[/C][C]0.46052[/C][/ROW]
[ROW][C]35[/C][C]0.009132[/C][C]0.0713[/C][C]0.471686[/C][/ROW]
[ROW][C]36[/C][C]0.114937[/C][C]0.8977[/C][C]0.186442[/C][/ROW]
[ROW][C]37[/C][C]0.021134[/C][C]0.1651[/C][C]0.43472[/C][/ROW]
[ROW][C]38[/C][C]-0.107161[/C][C]-0.837[/C][C]0.202942[/C][/ROW]
[ROW][C]39[/C][C]-0.025341[/C][C]-0.1979[/C][C]0.421882[/C][/ROW]
[ROW][C]40[/C][C]-0.051612[/C][C]-0.4031[/C][C]0.34414[/C][/ROW]
[ROW][C]41[/C][C]-0.017042[/C][C]-0.1331[/C][C]0.447275[/C][/ROW]
[ROW][C]42[/C][C]-0.027717[/C][C]-0.2165[/C][C]0.41467[/C][/ROW]
[ROW][C]43[/C][C]-0.067235[/C][C]-0.5251[/C][C]0.300702[/C][/ROW]
[ROW][C]44[/C][C]-0.117093[/C][C]-0.9145[/C][C]0.182021[/C][/ROW]
[ROW][C]45[/C][C]-0.081333[/C][C]-0.6352[/C][C]0.263827[/C][/ROW]
[ROW][C]46[/C][C]0.038789[/C][C]0.303[/C][C]0.381478[/C][/ROW]
[ROW][C]47[/C][C]-0.051968[/C][C]-0.4059[/C][C]0.343124[/C][/ROW]
[ROW][C]48[/C][C]-0.010959[/C][C]-0.0856[/C][C]0.466037[/C][/ROW]
[ROW][C]49[/C][C]-0.057693[/C][C]-0.4506[/C][C]0.326939[/C][/ROW]
[ROW][C]50[/C][C]0.045341[/C][C]0.3541[/C][C]0.362232[/C][/ROW]
[ROW][C]51[/C][C]-0.038137[/C][C]-0.2979[/C][C]0.383411[/C][/ROW]
[ROW][C]52[/C][C]0.050808[/C][C]0.3968[/C][C]0.346441[/C][/ROW]
[ROW][C]53[/C][C]-0.047896[/C][C]-0.3741[/C][C]0.354822[/C][/ROW]
[ROW][C]54[/C][C]-0.000443[/C][C]-0.0035[/C][C]0.498624[/C][/ROW]
[ROW][C]55[/C][C]-0.085925[/C][C]-0.6711[/C][C]0.252347[/C][/ROW]
[ROW][C]56[/C][C]0.021074[/C][C]0.1646[/C][C]0.434903[/C][/ROW]
[ROW][C]57[/C][C]-0.016424[/C][C]-0.1283[/C][C]0.449178[/C][/ROW]
[ROW][C]58[/C][C]-0.078963[/C][C]-0.6167[/C][C]0.269856[/C][/ROW]
[ROW][C]59[/C][C]0.066527[/C][C]0.5196[/C][C]0.302613[/C][/ROW]
[ROW][C]60[/C][C]-0.033335[/C][C]-0.2604[/C][C]0.397732[/C][/ROW]
[/TABLE]
Source: https://freestatistics.org/blog/index.php?pk=29224&T=2

Globally Unique Identifier (entire table): ba.freestatistics.org/blog/index.php?pk=29224&T=2

As an alternative you can also use a QR Code:  

The GUIDs for individual cells are displayed in the table below:

Partial Autocorrelation Function
Time lag kPACF(k)T-STATP-value
10.3502162.73530.004075
20.1773121.38480.085572
30.1880511.46870.073523
40.0458830.35840.360655
5-0.15692-1.22560.112532
6-0.034484-0.26930.394294
70.0283920.22170.412625
80.2003421.56470.061411
90.1565841.2230.113024
10-0.156077-1.2190.113769
11-0.198973-1.5540.062676
120.0970360.75790.225721
13-0.008289-0.06470.474297
14-0.065659-0.51280.304966
150.0750330.5860.280009
16-0.299529-2.33940.011303
17-0.03356-0.26210.39706
18-0.129208-1.00910.158445
190.0654910.51150.305424
20-0.119086-0.93010.177995
210.0190030.14840.44125
22-0.068267-0.53320.297922
23-0.073266-0.57220.284637
240.0652830.50990.305988
250.0227410.17760.429809
26-0.217132-1.69590.047506
27-0.111896-0.87390.19279
28-0.008192-0.0640.474598
29-0.012356-0.09650.461718
300.0395240.30870.379304
31-0.02939-0.22950.409609
320.0590950.46150.323025
33-0.05054-0.39470.347208
340.0127440.09950.46052
350.0091320.07130.471686
360.1149370.89770.186442
370.0211340.16510.43472
38-0.107161-0.8370.202942
39-0.025341-0.19790.421882
40-0.051612-0.40310.34414
41-0.017042-0.13310.447275
42-0.027717-0.21650.41467
43-0.067235-0.52510.300702
44-0.117093-0.91450.182021
45-0.081333-0.63520.263827
460.0387890.3030.381478
47-0.051968-0.40590.343124
48-0.010959-0.08560.466037
49-0.057693-0.45060.326939
500.0453410.35410.362232
51-0.038137-0.29790.383411
520.0508080.39680.346441
53-0.047896-0.37410.354822
54-0.000443-0.00350.498624
55-0.085925-0.67110.252347
560.0210740.16460.434903
57-0.016424-0.12830.449178
58-0.078963-0.61670.269856
590.0665270.51960.302613
60-0.033335-0.26040.397732


Parameters (Session):
par1 = 60 ; par2 = 1 ; par3 = 0 ; par4 = 0 ; par5 = 12 ;
Parameters (R input):
par1 = 60 ; par2 = 1 ; par3 = 0 ; par4 = 0 ; par5 = 12 ;
R code (references can be found in the software module):
if (par1 == 'Default') {
par1 = 10*log10(length(x))
} else {
par1 <- as.numeric(par1)
}
par2 <- as.numeric(par2)
par3 <- as.numeric(par3)
par4 <- as.numeric(par4)
par5 <- as.numeric(par5)
if (par2 == 0) {
x <- log(x)
} else {
x <- (x ^ par2 - 1) / par2
}
if (par3 > 0) x <- diff(x,lag=1,difference=par3)
if (par4 > 0) x <- diff(x,lag=par5,difference=par4)
bitmap(file='pic1.png')
racf <- acf(x,par1,main='Autocorrelation',xlab='lags',ylab='ACF')
dev.off()
bitmap(file='pic2.png')
rpacf <- pacf(x,par1,main='Partial Autocorrelation',xlab='lags',ylab='PACF')
dev.off()
(myacf <- c(racf$acf))
(mypacf <- c(rpacf$acf))
lengthx <- length(x)
sqrtn <- sqrt(lengthx)
load(file='createtable')
a<-table.start()
a<-table.row.start(a)
a<-table.element(a,'Autocorrelation Function',4,TRUE)
a<-table.row.end(a)
a<-table.row.start(a)
a<-table.element(a,'Time lag k',header=TRUE)
a<-table.element(a,hyperlink('basics.htm','ACF(k)','click here for more information about the Autocorrelation Function'),header=TRUE)
a<-table.element(a,'T-STAT',header=TRUE)
a<-table.element(a,'P-value',header=TRUE)
a<-table.row.end(a)
for (i in 2:(par1+1)) {
a<-table.row.start(a)
a<-table.element(a,i-1,header=TRUE)
a<-table.element(a,round(myacf[i],6))
mytstat <- myacf[i]*sqrtn
a<-table.element(a,round(mytstat,4))
a<-table.element(a,round(1-pt(abs(mytstat),lengthx),6))
a<-table.row.end(a)
}
a<-table.end(a)
table.save(a,file='mytable.tab')
a<-table.start()
a<-table.row.start(a)
a<-table.element(a,'Partial Autocorrelation Function',4,TRUE)
a<-table.row.end(a)
a<-table.row.start(a)
a<-table.element(a,'Time lag k',header=TRUE)
a<-table.element(a,hyperlink('basics.htm','PACF(k)','click here for more information about the Partial Autocorrelation Function'),header=TRUE)
a<-table.element(a,'T-STAT',header=TRUE)
a<-table.element(a,'P-value',header=TRUE)
a<-table.row.end(a)
for (i in 1:par1) {
a<-table.row.start(a)
a<-table.element(a,i,header=TRUE)
a<-table.element(a,round(mypacf[i],6))
mytstat <- mypacf[i]*sqrtn
a<-table.element(a,round(mytstat,4))
a<-table.element(a,round(1-pt(abs(mytstat),lengthx),6))
a<-table.row.end(a)
}
a<-table.end(a)
table.save(a,file='mytable1.tab')