Free Statistics

of Irreproducible Research!

Author's title

Author*The author of this computation has been verified*
R Software Modulerwasp_autocorrelation.wasp
Title produced by software(Partial) Autocorrelation Function
Date of computationFri, 05 Dec 2008 05:02:38 -0700
Cite this page as followsStatistical Computations at FreeStatistics.org, Office for Research Development and Education, URL https://freestatistics.org/blog/index.php?v=date/2008/Dec/05/t122847884073e2820i6c687e2.htm/, Retrieved Thu, 16 May 2024 22:39:40 +0000
Statistical Computations at FreeStatistics.org, Office for Research Development and Education, URL https://freestatistics.org/blog/index.php?pk=29207, Retrieved Thu, 16 May 2024 22:39:40 +0000
QR Codes:

Original text written by user:
IsPrivate?No (this computation is public)
User-defined keywords
Estimated Impact236
Family? (F = Feedback message, R = changed R code, M = changed R Module, P = changed Parameters, D = changed Data)
-     [Univariate Data Series] [Werkloosheid 50 e...] [2008-11-28 13:15:36] [6743688719638b0cb1c0a6e0bf433315]
-   P   [Univariate Data Series] [Unemployment from...] [2008-12-02 18:04:33] [6743688719638b0cb1c0a6e0bf433315]
- RMP     [Variance Reduction Matrix] [unemployment abov...] [2008-12-03 16:43:35] [6743688719638b0cb1c0a6e0bf433315]
- RMP         [(Partial) Autocorrelation Function] [ACF unemployment ...] [2008-12-05 12:02:38] [9b05d7ef5dbcfba4217d280d9092f628] [Current]
Feedback Forum

Post a new message
Dataseries X:
44028
45564
44277
44976
45406
47379
49200
50221
51573
53091
53337
54978
57885
67099
67169
69796
70600
71982
73957
75273
76322
77078
77954
79238
82179
83834
83744
84861
86478
88290
90287
91230
92380
92506
94172
94728
96581
97344
98346
98214
98366
98768
99832
99976
99961
100164
99964
99304
104008
104644
103950
104263
104241
105141
106018
105866
105944
106379
105082
104915
107026


Summary of computational transaction
Raw Inputview raw input (R code)
Raw Outputview raw output of R engine
Computing time3 seconds
R Server'Herman Ole Andreas Wold' @ 193.190.124.10:1001

\begin{tabular}{lllllllll}
\hline
Summary of computational transaction \tabularnewline
Raw Input & view raw input (R code)  \tabularnewline
Raw Output & view raw output of R engine  \tabularnewline
Computing time & 3 seconds \tabularnewline
R Server & 'Herman Ole Andreas Wold' @ 193.190.124.10:1001 \tabularnewline
\hline
\end{tabular}
%Source: https://freestatistics.org/blog/index.php?pk=29207&T=0

[TABLE]
[ROW][C]Summary of computational transaction[/C][/ROW]
[ROW][C]Raw Input[/C][C]view raw input (R code) [/C][/ROW]
[ROW][C]Raw Output[/C][C]view raw output of R engine [/C][/ROW]
[ROW][C]Computing time[/C][C]3 seconds[/C][/ROW]
[ROW][C]R Server[/C][C]'Herman Ole Andreas Wold' @ 193.190.124.10:1001[/C][/ROW]
[/TABLE]
Source: https://freestatistics.org/blog/index.php?pk=29207&T=0

Globally Unique Identifier (entire table): ba.freestatistics.org/blog/index.php?pk=29207&T=0

As an alternative you can also use a QR Code:  

The GUIDs for individual cells are displayed in the table below:

Summary of computational transaction
Raw Inputview raw input (R code)
Raw Outputview raw output of R engine
Computing time3 seconds
R Server'Herman Ole Andreas Wold' @ 193.190.124.10:1001


Autocorrelation Function
Time lag kACF(k)T-STATP-value
10.0622420.43120.334117
20.1374520.95230.172858
3-0.020702-0.14340.443276
40.0237260.16440.435061
50.0126780.08780.465186
60.0318610.22070.413116
7-0.072456-0.5020.308984
80.0024640.01710.493226
9-0.054766-0.37940.353022
10-0.025479-0.17650.430313
11-0.03601-0.24950.402026
12-0.429569-2.97610.002281
13-0.063837-0.44230.330138
140.0493470.34190.366963
150.1017890.70520.242042
160.096350.66750.253814
170.0364620.25260.40082
180.0056150.03890.484565
190.1149290.79630.214902
20-0.006207-0.0430.482939
210.0892660.61850.269601
22-0.025592-0.17730.430007
23-0.143477-0.9940.162595
24-0.044616-0.30910.379289
250.1138630.78890.217036
26-0.116601-0.80780.211585
27-0.085381-0.59150.278469
28-0.128251-0.88860.189338
29-0.032293-0.22370.411958
30-0.037721-0.26130.397474
31-0.088671-0.61430.270949
32-0.04802-0.33270.370408
330.0147160.1020.459608
34-0.054676-0.37880.353252
350.2455221.7010.047704
36-0.012816-0.08880.46481

\begin{tabular}{lllllllll}
\hline
Autocorrelation Function \tabularnewline
Time lag k & ACF(k) & T-STAT & P-value \tabularnewline
1 & 0.062242 & 0.4312 & 0.334117 \tabularnewline
2 & 0.137452 & 0.9523 & 0.172858 \tabularnewline
3 & -0.020702 & -0.1434 & 0.443276 \tabularnewline
4 & 0.023726 & 0.1644 & 0.435061 \tabularnewline
5 & 0.012678 & 0.0878 & 0.465186 \tabularnewline
6 & 0.031861 & 0.2207 & 0.413116 \tabularnewline
7 & -0.072456 & -0.502 & 0.308984 \tabularnewline
8 & 0.002464 & 0.0171 & 0.493226 \tabularnewline
9 & -0.054766 & -0.3794 & 0.353022 \tabularnewline
10 & -0.025479 & -0.1765 & 0.430313 \tabularnewline
11 & -0.03601 & -0.2495 & 0.402026 \tabularnewline
12 & -0.429569 & -2.9761 & 0.002281 \tabularnewline
13 & -0.063837 & -0.4423 & 0.330138 \tabularnewline
14 & 0.049347 & 0.3419 & 0.366963 \tabularnewline
15 & 0.101789 & 0.7052 & 0.242042 \tabularnewline
16 & 0.09635 & 0.6675 & 0.253814 \tabularnewline
17 & 0.036462 & 0.2526 & 0.40082 \tabularnewline
18 & 0.005615 & 0.0389 & 0.484565 \tabularnewline
19 & 0.114929 & 0.7963 & 0.214902 \tabularnewline
20 & -0.006207 & -0.043 & 0.482939 \tabularnewline
21 & 0.089266 & 0.6185 & 0.269601 \tabularnewline
22 & -0.025592 & -0.1773 & 0.430007 \tabularnewline
23 & -0.143477 & -0.994 & 0.162595 \tabularnewline
24 & -0.044616 & -0.3091 & 0.379289 \tabularnewline
25 & 0.113863 & 0.7889 & 0.217036 \tabularnewline
26 & -0.116601 & -0.8078 & 0.211585 \tabularnewline
27 & -0.085381 & -0.5915 & 0.278469 \tabularnewline
28 & -0.128251 & -0.8886 & 0.189338 \tabularnewline
29 & -0.032293 & -0.2237 & 0.411958 \tabularnewline
30 & -0.037721 & -0.2613 & 0.397474 \tabularnewline
31 & -0.088671 & -0.6143 & 0.270949 \tabularnewline
32 & -0.04802 & -0.3327 & 0.370408 \tabularnewline
33 & 0.014716 & 0.102 & 0.459608 \tabularnewline
34 & -0.054676 & -0.3788 & 0.353252 \tabularnewline
35 & 0.245522 & 1.701 & 0.047704 \tabularnewline
36 & -0.012816 & -0.0888 & 0.46481 \tabularnewline
\hline
\end{tabular}
%Source: https://freestatistics.org/blog/index.php?pk=29207&T=1

[TABLE]
[ROW][C]Autocorrelation Function[/C][/ROW]
[ROW][C]Time lag k[/C][C]ACF(k)[/C][C]T-STAT[/C][C]P-value[/C][/ROW]
[ROW][C]1[/C][C]0.062242[/C][C]0.4312[/C][C]0.334117[/C][/ROW]
[ROW][C]2[/C][C]0.137452[/C][C]0.9523[/C][C]0.172858[/C][/ROW]
[ROW][C]3[/C][C]-0.020702[/C][C]-0.1434[/C][C]0.443276[/C][/ROW]
[ROW][C]4[/C][C]0.023726[/C][C]0.1644[/C][C]0.435061[/C][/ROW]
[ROW][C]5[/C][C]0.012678[/C][C]0.0878[/C][C]0.465186[/C][/ROW]
[ROW][C]6[/C][C]0.031861[/C][C]0.2207[/C][C]0.413116[/C][/ROW]
[ROW][C]7[/C][C]-0.072456[/C][C]-0.502[/C][C]0.308984[/C][/ROW]
[ROW][C]8[/C][C]0.002464[/C][C]0.0171[/C][C]0.493226[/C][/ROW]
[ROW][C]9[/C][C]-0.054766[/C][C]-0.3794[/C][C]0.353022[/C][/ROW]
[ROW][C]10[/C][C]-0.025479[/C][C]-0.1765[/C][C]0.430313[/C][/ROW]
[ROW][C]11[/C][C]-0.03601[/C][C]-0.2495[/C][C]0.402026[/C][/ROW]
[ROW][C]12[/C][C]-0.429569[/C][C]-2.9761[/C][C]0.002281[/C][/ROW]
[ROW][C]13[/C][C]-0.063837[/C][C]-0.4423[/C][C]0.330138[/C][/ROW]
[ROW][C]14[/C][C]0.049347[/C][C]0.3419[/C][C]0.366963[/C][/ROW]
[ROW][C]15[/C][C]0.101789[/C][C]0.7052[/C][C]0.242042[/C][/ROW]
[ROW][C]16[/C][C]0.09635[/C][C]0.6675[/C][C]0.253814[/C][/ROW]
[ROW][C]17[/C][C]0.036462[/C][C]0.2526[/C][C]0.40082[/C][/ROW]
[ROW][C]18[/C][C]0.005615[/C][C]0.0389[/C][C]0.484565[/C][/ROW]
[ROW][C]19[/C][C]0.114929[/C][C]0.7963[/C][C]0.214902[/C][/ROW]
[ROW][C]20[/C][C]-0.006207[/C][C]-0.043[/C][C]0.482939[/C][/ROW]
[ROW][C]21[/C][C]0.089266[/C][C]0.6185[/C][C]0.269601[/C][/ROW]
[ROW][C]22[/C][C]-0.025592[/C][C]-0.1773[/C][C]0.430007[/C][/ROW]
[ROW][C]23[/C][C]-0.143477[/C][C]-0.994[/C][C]0.162595[/C][/ROW]
[ROW][C]24[/C][C]-0.044616[/C][C]-0.3091[/C][C]0.379289[/C][/ROW]
[ROW][C]25[/C][C]0.113863[/C][C]0.7889[/C][C]0.217036[/C][/ROW]
[ROW][C]26[/C][C]-0.116601[/C][C]-0.8078[/C][C]0.211585[/C][/ROW]
[ROW][C]27[/C][C]-0.085381[/C][C]-0.5915[/C][C]0.278469[/C][/ROW]
[ROW][C]28[/C][C]-0.128251[/C][C]-0.8886[/C][C]0.189338[/C][/ROW]
[ROW][C]29[/C][C]-0.032293[/C][C]-0.2237[/C][C]0.411958[/C][/ROW]
[ROW][C]30[/C][C]-0.037721[/C][C]-0.2613[/C][C]0.397474[/C][/ROW]
[ROW][C]31[/C][C]-0.088671[/C][C]-0.6143[/C][C]0.270949[/C][/ROW]
[ROW][C]32[/C][C]-0.04802[/C][C]-0.3327[/C][C]0.370408[/C][/ROW]
[ROW][C]33[/C][C]0.014716[/C][C]0.102[/C][C]0.459608[/C][/ROW]
[ROW][C]34[/C][C]-0.054676[/C][C]-0.3788[/C][C]0.353252[/C][/ROW]
[ROW][C]35[/C][C]0.245522[/C][C]1.701[/C][C]0.047704[/C][/ROW]
[ROW][C]36[/C][C]-0.012816[/C][C]-0.0888[/C][C]0.46481[/C][/ROW]
[/TABLE]
Source: https://freestatistics.org/blog/index.php?pk=29207&T=1

Globally Unique Identifier (entire table): ba.freestatistics.org/blog/index.php?pk=29207&T=1

As an alternative you can also use a QR Code:  

The GUIDs for individual cells are displayed in the table below:

Autocorrelation Function
Time lag kACF(k)T-STATP-value
10.0622420.43120.334117
20.1374520.95230.172858
3-0.020702-0.14340.443276
40.0237260.16440.435061
50.0126780.08780.465186
60.0318610.22070.413116
7-0.072456-0.5020.308984
80.0024640.01710.493226
9-0.054766-0.37940.353022
10-0.025479-0.17650.430313
11-0.03601-0.24950.402026
12-0.429569-2.97610.002281
13-0.063837-0.44230.330138
140.0493470.34190.366963
150.1017890.70520.242042
160.096350.66750.253814
170.0364620.25260.40082
180.0056150.03890.484565
190.1149290.79630.214902
20-0.006207-0.0430.482939
210.0892660.61850.269601
22-0.025592-0.17730.430007
23-0.143477-0.9940.162595
24-0.044616-0.30910.379289
250.1138630.78890.217036
26-0.116601-0.80780.211585
27-0.085381-0.59150.278469
28-0.128251-0.88860.189338
29-0.032293-0.22370.411958
30-0.037721-0.26130.397474
31-0.088671-0.61430.270949
32-0.04802-0.33270.370408
330.0147160.1020.459608
34-0.054676-0.37880.353252
350.2455221.7010.047704
36-0.012816-0.08880.46481


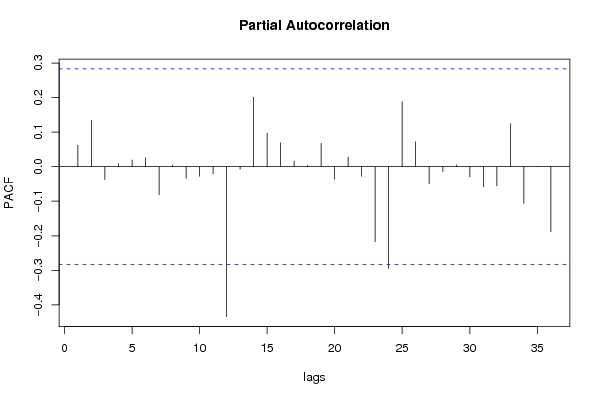
Partial Autocorrelation Function
Time lag kPACF(k)T-STATP-value
10.0622420.43120.334117
20.1340980.92910.178754
3-0.037269-0.25820.398676
40.008760.06070.475929
50.0191590.13270.447478
60.0254170.17610.430481
7-0.080989-0.56110.288666
80.0045950.03180.487368
9-0.034003-0.23560.40738
10-0.027583-0.19110.424628
11-0.020585-0.14260.443594
12-0.434181-3.00810.002089
13-0.007286-0.05050.479974
140.2011681.39370.084909
150.097050.67240.252283
160.0691880.47930.316935
170.0165410.11460.45462
180.0037030.02570.489818
190.0680680.47160.319679
20-0.03628-0.25140.401306
210.0272870.1890.425426
22-0.02797-0.19380.423582
23-0.217325-1.50570.069352
24-0.295106-2.04460.023202
250.1885021.3060.098892
260.0718060.49750.310558
27-0.049799-0.3450.365793
28-0.013838-0.09590.462009
290.0050040.03470.486243
30-0.029848-0.20680.418524
31-0.058363-0.40430.343876
32-0.055481-0.38440.351195
330.1241950.86040.196909
34-0.106079-0.73490.232977
35-0.000289-0.0020.499206
36-0.188665-1.30710.098702

\begin{tabular}{lllllllll}
\hline
Partial Autocorrelation Function \tabularnewline
Time lag k & PACF(k) & T-STAT & P-value \tabularnewline
1 & 0.062242 & 0.4312 & 0.334117 \tabularnewline
2 & 0.134098 & 0.9291 & 0.178754 \tabularnewline
3 & -0.037269 & -0.2582 & 0.398676 \tabularnewline
4 & 0.00876 & 0.0607 & 0.475929 \tabularnewline
5 & 0.019159 & 0.1327 & 0.447478 \tabularnewline
6 & 0.025417 & 0.1761 & 0.430481 \tabularnewline
7 & -0.080989 & -0.5611 & 0.288666 \tabularnewline
8 & 0.004595 & 0.0318 & 0.487368 \tabularnewline
9 & -0.034003 & -0.2356 & 0.40738 \tabularnewline
10 & -0.027583 & -0.1911 & 0.424628 \tabularnewline
11 & -0.020585 & -0.1426 & 0.443594 \tabularnewline
12 & -0.434181 & -3.0081 & 0.002089 \tabularnewline
13 & -0.007286 & -0.0505 & 0.479974 \tabularnewline
14 & 0.201168 & 1.3937 & 0.084909 \tabularnewline
15 & 0.09705 & 0.6724 & 0.252283 \tabularnewline
16 & 0.069188 & 0.4793 & 0.316935 \tabularnewline
17 & 0.016541 & 0.1146 & 0.45462 \tabularnewline
18 & 0.003703 & 0.0257 & 0.489818 \tabularnewline
19 & 0.068068 & 0.4716 & 0.319679 \tabularnewline
20 & -0.03628 & -0.2514 & 0.401306 \tabularnewline
21 & 0.027287 & 0.189 & 0.425426 \tabularnewline
22 & -0.02797 & -0.1938 & 0.423582 \tabularnewline
23 & -0.217325 & -1.5057 & 0.069352 \tabularnewline
24 & -0.295106 & -2.0446 & 0.023202 \tabularnewline
25 & 0.188502 & 1.306 & 0.098892 \tabularnewline
26 & 0.071806 & 0.4975 & 0.310558 \tabularnewline
27 & -0.049799 & -0.345 & 0.365793 \tabularnewline
28 & -0.013838 & -0.0959 & 0.462009 \tabularnewline
29 & 0.005004 & 0.0347 & 0.486243 \tabularnewline
30 & -0.029848 & -0.2068 & 0.418524 \tabularnewline
31 & -0.058363 & -0.4043 & 0.343876 \tabularnewline
32 & -0.055481 & -0.3844 & 0.351195 \tabularnewline
33 & 0.124195 & 0.8604 & 0.196909 \tabularnewline
34 & -0.106079 & -0.7349 & 0.232977 \tabularnewline
35 & -0.000289 & -0.002 & 0.499206 \tabularnewline
36 & -0.188665 & -1.3071 & 0.098702 \tabularnewline
\hline
\end{tabular}
%Source: https://freestatistics.org/blog/index.php?pk=29207&T=2

[TABLE]
[ROW][C]Partial Autocorrelation Function[/C][/ROW]
[ROW][C]Time lag k[/C][C]PACF(k)[/C][C]T-STAT[/C][C]P-value[/C][/ROW]
[ROW][C]1[/C][C]0.062242[/C][C]0.4312[/C][C]0.334117[/C][/ROW]
[ROW][C]2[/C][C]0.134098[/C][C]0.9291[/C][C]0.178754[/C][/ROW]
[ROW][C]3[/C][C]-0.037269[/C][C]-0.2582[/C][C]0.398676[/C][/ROW]
[ROW][C]4[/C][C]0.00876[/C][C]0.0607[/C][C]0.475929[/C][/ROW]
[ROW][C]5[/C][C]0.019159[/C][C]0.1327[/C][C]0.447478[/C][/ROW]
[ROW][C]6[/C][C]0.025417[/C][C]0.1761[/C][C]0.430481[/C][/ROW]
[ROW][C]7[/C][C]-0.080989[/C][C]-0.5611[/C][C]0.288666[/C][/ROW]
[ROW][C]8[/C][C]0.004595[/C][C]0.0318[/C][C]0.487368[/C][/ROW]
[ROW][C]9[/C][C]-0.034003[/C][C]-0.2356[/C][C]0.40738[/C][/ROW]
[ROW][C]10[/C][C]-0.027583[/C][C]-0.1911[/C][C]0.424628[/C][/ROW]
[ROW][C]11[/C][C]-0.020585[/C][C]-0.1426[/C][C]0.443594[/C][/ROW]
[ROW][C]12[/C][C]-0.434181[/C][C]-3.0081[/C][C]0.002089[/C][/ROW]
[ROW][C]13[/C][C]-0.007286[/C][C]-0.0505[/C][C]0.479974[/C][/ROW]
[ROW][C]14[/C][C]0.201168[/C][C]1.3937[/C][C]0.084909[/C][/ROW]
[ROW][C]15[/C][C]0.09705[/C][C]0.6724[/C][C]0.252283[/C][/ROW]
[ROW][C]16[/C][C]0.069188[/C][C]0.4793[/C][C]0.316935[/C][/ROW]
[ROW][C]17[/C][C]0.016541[/C][C]0.1146[/C][C]0.45462[/C][/ROW]
[ROW][C]18[/C][C]0.003703[/C][C]0.0257[/C][C]0.489818[/C][/ROW]
[ROW][C]19[/C][C]0.068068[/C][C]0.4716[/C][C]0.319679[/C][/ROW]
[ROW][C]20[/C][C]-0.03628[/C][C]-0.2514[/C][C]0.401306[/C][/ROW]
[ROW][C]21[/C][C]0.027287[/C][C]0.189[/C][C]0.425426[/C][/ROW]
[ROW][C]22[/C][C]-0.02797[/C][C]-0.1938[/C][C]0.423582[/C][/ROW]
[ROW][C]23[/C][C]-0.217325[/C][C]-1.5057[/C][C]0.069352[/C][/ROW]
[ROW][C]24[/C][C]-0.295106[/C][C]-2.0446[/C][C]0.023202[/C][/ROW]
[ROW][C]25[/C][C]0.188502[/C][C]1.306[/C][C]0.098892[/C][/ROW]
[ROW][C]26[/C][C]0.071806[/C][C]0.4975[/C][C]0.310558[/C][/ROW]
[ROW][C]27[/C][C]-0.049799[/C][C]-0.345[/C][C]0.365793[/C][/ROW]
[ROW][C]28[/C][C]-0.013838[/C][C]-0.0959[/C][C]0.462009[/C][/ROW]
[ROW][C]29[/C][C]0.005004[/C][C]0.0347[/C][C]0.486243[/C][/ROW]
[ROW][C]30[/C][C]-0.029848[/C][C]-0.2068[/C][C]0.418524[/C][/ROW]
[ROW][C]31[/C][C]-0.058363[/C][C]-0.4043[/C][C]0.343876[/C][/ROW]
[ROW][C]32[/C][C]-0.055481[/C][C]-0.3844[/C][C]0.351195[/C][/ROW]
[ROW][C]33[/C][C]0.124195[/C][C]0.8604[/C][C]0.196909[/C][/ROW]
[ROW][C]34[/C][C]-0.106079[/C][C]-0.7349[/C][C]0.232977[/C][/ROW]
[ROW][C]35[/C][C]-0.000289[/C][C]-0.002[/C][C]0.499206[/C][/ROW]
[ROW][C]36[/C][C]-0.188665[/C][C]-1.3071[/C][C]0.098702[/C][/ROW]
[/TABLE]
Source: https://freestatistics.org/blog/index.php?pk=29207&T=2

Globally Unique Identifier (entire table): ba.freestatistics.org/blog/index.php?pk=29207&T=2

As an alternative you can also use a QR Code:  

The GUIDs for individual cells are displayed in the table below:

Partial Autocorrelation Function
Time lag kPACF(k)T-STATP-value
10.0622420.43120.334117
20.1340980.92910.178754
3-0.037269-0.25820.398676
40.008760.06070.475929
50.0191590.13270.447478
60.0254170.17610.430481
7-0.080989-0.56110.288666
80.0045950.03180.487368
9-0.034003-0.23560.40738
10-0.027583-0.19110.424628
11-0.020585-0.14260.443594
12-0.434181-3.00810.002089
13-0.007286-0.05050.479974
140.2011681.39370.084909
150.097050.67240.252283
160.0691880.47930.316935
170.0165410.11460.45462
180.0037030.02570.489818
190.0680680.47160.319679
20-0.03628-0.25140.401306
210.0272870.1890.425426
22-0.02797-0.19380.423582
23-0.217325-1.50570.069352
24-0.295106-2.04460.023202
250.1885021.3060.098892
260.0718060.49750.310558
27-0.049799-0.3450.365793
28-0.013838-0.09590.462009
290.0050040.03470.486243
30-0.029848-0.20680.418524
31-0.058363-0.40430.343876
32-0.055481-0.38440.351195
330.1241950.86040.196909
34-0.106079-0.73490.232977
35-0.000289-0.0020.499206
36-0.188665-1.30710.098702


Parameters (Session):
par1 = 36 ; par2 = 1 ; par3 = 1 ; par4 = 1 ; par5 = 12 ;
Parameters (R input):
par1 = 36 ; par2 = 1 ; par3 = 1 ; par4 = 1 ; par5 = 12 ;
R code (references can be found in the software module):
if (par1 == 'Default') {
par1 = 10*log10(length(x))
} else {
par1 <- as.numeric(par1)
}
par2 <- as.numeric(par2)
par3 <- as.numeric(par3)
par4 <- as.numeric(par4)
par5 <- as.numeric(par5)
if (par2 == 0) {
x <- log(x)
} else {
x <- (x ^ par2 - 1) / par2
}
if (par3 > 0) x <- diff(x,lag=1,difference=par3)
if (par4 > 0) x <- diff(x,lag=par5,difference=par4)
bitmap(file='pic1.png')
racf <- acf(x,par1,main='Autocorrelation',xlab='lags',ylab='ACF')
dev.off()
bitmap(file='pic2.png')
rpacf <- pacf(x,par1,main='Partial Autocorrelation',xlab='lags',ylab='PACF')
dev.off()
(myacf <- c(racf$acf))
(mypacf <- c(rpacf$acf))
lengthx <- length(x)
sqrtn <- sqrt(lengthx)
load(file='createtable')
a<-table.start()
a<-table.row.start(a)
a<-table.element(a,'Autocorrelation Function',4,TRUE)
a<-table.row.end(a)
a<-table.row.start(a)
a<-table.element(a,'Time lag k',header=TRUE)
a<-table.element(a,hyperlink('basics.htm','ACF(k)','click here for more information about the Autocorrelation Function'),header=TRUE)
a<-table.element(a,'T-STAT',header=TRUE)
a<-table.element(a,'P-value',header=TRUE)
a<-table.row.end(a)
for (i in 2:(par1+1)) {
a<-table.row.start(a)
a<-table.element(a,i-1,header=TRUE)
a<-table.element(a,round(myacf[i],6))
mytstat <- myacf[i]*sqrtn
a<-table.element(a,round(mytstat,4))
a<-table.element(a,round(1-pt(abs(mytstat),lengthx),6))
a<-table.row.end(a)
}
a<-table.end(a)
table.save(a,file='mytable.tab')
a<-table.start()
a<-table.row.start(a)
a<-table.element(a,'Partial Autocorrelation Function',4,TRUE)
a<-table.row.end(a)
a<-table.row.start(a)
a<-table.element(a,'Time lag k',header=TRUE)
a<-table.element(a,hyperlink('basics.htm','PACF(k)','click here for more information about the Partial Autocorrelation Function'),header=TRUE)
a<-table.element(a,'T-STAT',header=TRUE)
a<-table.element(a,'P-value',header=TRUE)
a<-table.row.end(a)
for (i in 1:par1) {
a<-table.row.start(a)
a<-table.element(a,i,header=TRUE)
a<-table.element(a,round(mypacf[i],6))
mytstat <- mypacf[i]*sqrtn
a<-table.element(a,round(mytstat,4))
a<-table.element(a,round(1-pt(abs(mytstat),lengthx),6))
a<-table.row.end(a)
}
a<-table.end(a)
table.save(a,file='mytable1.tab')