Free Statistics

of Irreproducible Research!

Author's title

Author*The author of this computation has been verified*
R Software Modulerwasp_autocorrelation.wasp
Title produced by software(Partial) Autocorrelation Function
Date of computationFri, 05 Dec 2008 04:12:26 -0700
Cite this page as followsStatistical Computations at FreeStatistics.org, Office for Research Development and Education, URL https://freestatistics.org/blog/index.php?v=date/2008/Dec/05/t12284756647ujtorizbyvzhnm.htm/, Retrieved Thu, 16 May 2024 21:28:43 +0000
Statistical Computations at FreeStatistics.org, Office for Research Development and Education, URL https://freestatistics.org/blog/index.php?pk=29170, Retrieved Thu, 16 May 2024 21:28:43 +0000
QR Codes:

Original text written by user:
IsPrivate?No (this computation is public)
User-defined keywords
Estimated Impact217
Family? (F = Feedback message, R = changed R code, M = changed R Module, P = changed Parameters, D = changed Data)
-     [Standard Deviation-Mean Plot] [Paper Hoofdstuk 4...] [2008-12-05 10:14:55] [6fea0e9a9b3b29a63badf2c274e82506]
- RMP     [(Partial) Autocorrelation Function] [Paper Hoofdstuk 4...] [2008-12-05 11:12:26] [286e96bd53289970f8e5f25a93fb50b3] [Current]
Feedback Forum

Post a new message
Dataseries X:
493.000
481.000
462.000
457.000
442.000
439.000
488.000
521.000
501.000
485.000
464.000
460.000
467.000
460.000
448.000
443.000
436.000
431.000
484.000
510.000
513.000
503.000
471.000
471.000
476.000
475.000
470.000
461.000
455.000
456.000
517.000
525.000
523.000
519.000
509.000
512.000
519.000
517.000
510.000
509.000
501.000
507.000
569.000
580.000
578.000
565.000
547.000
555.000
562.000
561.000
555.000
544.000
537.000
543.000
594.000
611.000
613.000
611.000
594.000
595.000


Summary of computational transaction
Raw Inputview raw input (R code)
Raw Outputview raw output of R engine
Computing time1 seconds
R Server'Gwilym Jenkins' @ 72.249.127.135

\begin{tabular}{lllllllll}
\hline
Summary of computational transaction \tabularnewline
Raw Input & view raw input (R code)  \tabularnewline
Raw Output & view raw output of R engine  \tabularnewline
Computing time & 1 seconds \tabularnewline
R Server & 'Gwilym Jenkins' @ 72.249.127.135 \tabularnewline
\hline
\end{tabular}
%Source: https://freestatistics.org/blog/index.php?pk=29170&T=0

[TABLE]
[ROW][C]Summary of computational transaction[/C][/ROW]
[ROW][C]Raw Input[/C][C]view raw input (R code) [/C][/ROW]
[ROW][C]Raw Output[/C][C]view raw output of R engine [/C][/ROW]
[ROW][C]Computing time[/C][C]1 seconds[/C][/ROW]
[ROW][C]R Server[/C][C]'Gwilym Jenkins' @ 72.249.127.135[/C][/ROW]
[/TABLE]
Source: https://freestatistics.org/blog/index.php?pk=29170&T=0

Globally Unique Identifier (entire table): ba.freestatistics.org/blog/index.php?pk=29170&T=0

As an alternative you can also use a QR Code:  

The GUIDs for individual cells are displayed in the table below:

Summary of computational transaction
Raw Inputview raw input (R code)
Raw Outputview raw output of R engine
Computing time1 seconds
R Server'Gwilym Jenkins' @ 72.249.127.135


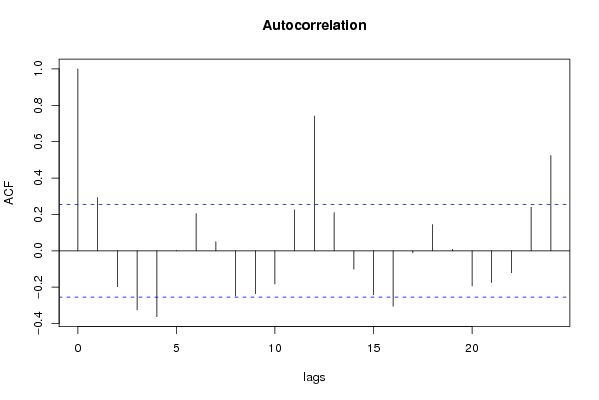
Autocorrelation Function
Time lag kACF(k)T-STATP-value
10.2926992.24830.014155
2-0.197292-1.51540.067501
3-0.325496-2.50020.007606
4-0.362189-2.7820.003621
50.0010730.00820.496725
60.205021.57480.060327
70.0501040.38490.350864
8-0.248478-1.90860.030592
9-0.235629-1.80990.037702
10-0.183167-1.40690.082346
110.2254641.73180.044266
120.7406315.68890
130.2097771.61130.056223
14-0.10129-0.7780.219832
15-0.242238-1.86070.033889
16-0.305359-2.34550.011191
17-0.011425-0.08780.465185
180.144261.10810.136161
190.0079660.06120.475708
20-0.193473-1.48610.071289
21-0.174669-1.34170.092424
22-0.121126-0.93040.17798
230.23971.84120.035313
240.5234484.02078.4e-05

\begin{tabular}{lllllllll}
\hline
Autocorrelation Function \tabularnewline
Time lag k & ACF(k) & T-STAT & P-value \tabularnewline
1 & 0.292699 & 2.2483 & 0.014155 \tabularnewline
2 & -0.197292 & -1.5154 & 0.067501 \tabularnewline
3 & -0.325496 & -2.5002 & 0.007606 \tabularnewline
4 & -0.362189 & -2.782 & 0.003621 \tabularnewline
5 & 0.001073 & 0.0082 & 0.496725 \tabularnewline
6 & 0.20502 & 1.5748 & 0.060327 \tabularnewline
7 & 0.050104 & 0.3849 & 0.350864 \tabularnewline
8 & -0.248478 & -1.9086 & 0.030592 \tabularnewline
9 & -0.235629 & -1.8099 & 0.037702 \tabularnewline
10 & -0.183167 & -1.4069 & 0.082346 \tabularnewline
11 & 0.225464 & 1.7318 & 0.044266 \tabularnewline
12 & 0.740631 & 5.6889 & 0 \tabularnewline
13 & 0.209777 & 1.6113 & 0.056223 \tabularnewline
14 & -0.10129 & -0.778 & 0.219832 \tabularnewline
15 & -0.242238 & -1.8607 & 0.033889 \tabularnewline
16 & -0.305359 & -2.3455 & 0.011191 \tabularnewline
17 & -0.011425 & -0.0878 & 0.465185 \tabularnewline
18 & 0.14426 & 1.1081 & 0.136161 \tabularnewline
19 & 0.007966 & 0.0612 & 0.475708 \tabularnewline
20 & -0.193473 & -1.4861 & 0.071289 \tabularnewline
21 & -0.174669 & -1.3417 & 0.092424 \tabularnewline
22 & -0.121126 & -0.9304 & 0.17798 \tabularnewline
23 & 0.2397 & 1.8412 & 0.035313 \tabularnewline
24 & 0.523448 & 4.0207 & 8.4e-05 \tabularnewline
\hline
\end{tabular}
%Source: https://freestatistics.org/blog/index.php?pk=29170&T=1

[TABLE]
[ROW][C]Autocorrelation Function[/C][/ROW]
[ROW][C]Time lag k[/C][C]ACF(k)[/C][C]T-STAT[/C][C]P-value[/C][/ROW]
[ROW][C]1[/C][C]0.292699[/C][C]2.2483[/C][C]0.014155[/C][/ROW]
[ROW][C]2[/C][C]-0.197292[/C][C]-1.5154[/C][C]0.067501[/C][/ROW]
[ROW][C]3[/C][C]-0.325496[/C][C]-2.5002[/C][C]0.007606[/C][/ROW]
[ROW][C]4[/C][C]-0.362189[/C][C]-2.782[/C][C]0.003621[/C][/ROW]
[ROW][C]5[/C][C]0.001073[/C][C]0.0082[/C][C]0.496725[/C][/ROW]
[ROW][C]6[/C][C]0.20502[/C][C]1.5748[/C][C]0.060327[/C][/ROW]
[ROW][C]7[/C][C]0.050104[/C][C]0.3849[/C][C]0.350864[/C][/ROW]
[ROW][C]8[/C][C]-0.248478[/C][C]-1.9086[/C][C]0.030592[/C][/ROW]
[ROW][C]9[/C][C]-0.235629[/C][C]-1.8099[/C][C]0.037702[/C][/ROW]
[ROW][C]10[/C][C]-0.183167[/C][C]-1.4069[/C][C]0.082346[/C][/ROW]
[ROW][C]11[/C][C]0.225464[/C][C]1.7318[/C][C]0.044266[/C][/ROW]
[ROW][C]12[/C][C]0.740631[/C][C]5.6889[/C][C]0[/C][/ROW]
[ROW][C]13[/C][C]0.209777[/C][C]1.6113[/C][C]0.056223[/C][/ROW]
[ROW][C]14[/C][C]-0.10129[/C][C]-0.778[/C][C]0.219832[/C][/ROW]
[ROW][C]15[/C][C]-0.242238[/C][C]-1.8607[/C][C]0.033889[/C][/ROW]
[ROW][C]16[/C][C]-0.305359[/C][C]-2.3455[/C][C]0.011191[/C][/ROW]
[ROW][C]17[/C][C]-0.011425[/C][C]-0.0878[/C][C]0.465185[/C][/ROW]
[ROW][C]18[/C][C]0.14426[/C][C]1.1081[/C][C]0.136161[/C][/ROW]
[ROW][C]19[/C][C]0.007966[/C][C]0.0612[/C][C]0.475708[/C][/ROW]
[ROW][C]20[/C][C]-0.193473[/C][C]-1.4861[/C][C]0.071289[/C][/ROW]
[ROW][C]21[/C][C]-0.174669[/C][C]-1.3417[/C][C]0.092424[/C][/ROW]
[ROW][C]22[/C][C]-0.121126[/C][C]-0.9304[/C][C]0.17798[/C][/ROW]
[ROW][C]23[/C][C]0.2397[/C][C]1.8412[/C][C]0.035313[/C][/ROW]
[ROW][C]24[/C][C]0.523448[/C][C]4.0207[/C][C]8.4e-05[/C][/ROW]
[/TABLE]
Source: https://freestatistics.org/blog/index.php?pk=29170&T=1

Globally Unique Identifier (entire table): ba.freestatistics.org/blog/index.php?pk=29170&T=1

As an alternative you can also use a QR Code:  

The GUIDs for individual cells are displayed in the table below:

Autocorrelation Function
Time lag kACF(k)T-STATP-value
10.2926992.24830.014155
2-0.197292-1.51540.067501
3-0.325496-2.50020.007606
4-0.362189-2.7820.003621
50.0010730.00820.496725
60.205021.57480.060327
70.0501040.38490.350864
8-0.248478-1.90860.030592
9-0.235629-1.80990.037702
10-0.183167-1.40690.082346
110.2254641.73180.044266
120.7406315.68890
130.2097771.61130.056223
14-0.10129-0.7780.219832
15-0.242238-1.86070.033889
16-0.305359-2.34550.011191
17-0.011425-0.08780.465185
180.144261.10810.136161
190.0079660.06120.475708
20-0.193473-1.48610.071289
21-0.174669-1.34170.092424
22-0.121126-0.93040.17798
230.23971.84120.035313
240.5234484.02078.4e-05


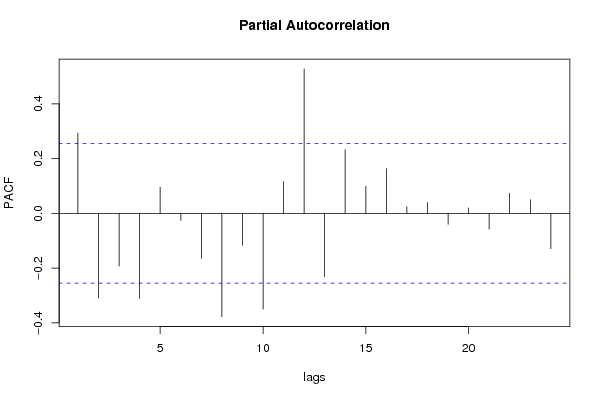
Partial Autocorrelation Function
Time lag kPACF(k)T-STATP-value
10.2926992.24830.014155
2-0.309479-2.37720.010354
3-0.192672-1.47990.072105
4-0.310194-2.38260.010215
50.0955590.7340.232926
6-0.025943-0.19930.421368
7-0.164703-1.26510.105404
8-0.377401-2.89890.002626
9-0.116786-0.89710.186669
10-0.350305-2.69070.00463
110.1150140.88340.190292
120.5275014.05187.5e-05
13-0.231847-1.78090.040042
140.2319321.78150.039989
150.0989920.76040.225029
160.1635811.25650.106945
170.0241370.18540.426776
180.0396350.30440.380931
19-0.040005-0.30730.379854
200.0199680.15340.439311
21-0.057951-0.44510.328927
220.0734670.56430.287341
230.0500210.38420.3511
24-0.129041-0.99120.162823

\begin{tabular}{lllllllll}
\hline
Partial Autocorrelation Function \tabularnewline
Time lag k & PACF(k) & T-STAT & P-value \tabularnewline
1 & 0.292699 & 2.2483 & 0.014155 \tabularnewline
2 & -0.309479 & -2.3772 & 0.010354 \tabularnewline
3 & -0.192672 & -1.4799 & 0.072105 \tabularnewline
4 & -0.310194 & -2.3826 & 0.010215 \tabularnewline
5 & 0.095559 & 0.734 & 0.232926 \tabularnewline
6 & -0.025943 & -0.1993 & 0.421368 \tabularnewline
7 & -0.164703 & -1.2651 & 0.105404 \tabularnewline
8 & -0.377401 & -2.8989 & 0.002626 \tabularnewline
9 & -0.116786 & -0.8971 & 0.186669 \tabularnewline
10 & -0.350305 & -2.6907 & 0.00463 \tabularnewline
11 & 0.115014 & 0.8834 & 0.190292 \tabularnewline
12 & 0.527501 & 4.0518 & 7.5e-05 \tabularnewline
13 & -0.231847 & -1.7809 & 0.040042 \tabularnewline
14 & 0.231932 & 1.7815 & 0.039989 \tabularnewline
15 & 0.098992 & 0.7604 & 0.225029 \tabularnewline
16 & 0.163581 & 1.2565 & 0.106945 \tabularnewline
17 & 0.024137 & 0.1854 & 0.426776 \tabularnewline
18 & 0.039635 & 0.3044 & 0.380931 \tabularnewline
19 & -0.040005 & -0.3073 & 0.379854 \tabularnewline
20 & 0.019968 & 0.1534 & 0.439311 \tabularnewline
21 & -0.057951 & -0.4451 & 0.328927 \tabularnewline
22 & 0.073467 & 0.5643 & 0.287341 \tabularnewline
23 & 0.050021 & 0.3842 & 0.3511 \tabularnewline
24 & -0.129041 & -0.9912 & 0.162823 \tabularnewline
\hline
\end{tabular}
%Source: https://freestatistics.org/blog/index.php?pk=29170&T=2

[TABLE]
[ROW][C]Partial Autocorrelation Function[/C][/ROW]
[ROW][C]Time lag k[/C][C]PACF(k)[/C][C]T-STAT[/C][C]P-value[/C][/ROW]
[ROW][C]1[/C][C]0.292699[/C][C]2.2483[/C][C]0.014155[/C][/ROW]
[ROW][C]2[/C][C]-0.309479[/C][C]-2.3772[/C][C]0.010354[/C][/ROW]
[ROW][C]3[/C][C]-0.192672[/C][C]-1.4799[/C][C]0.072105[/C][/ROW]
[ROW][C]4[/C][C]-0.310194[/C][C]-2.3826[/C][C]0.010215[/C][/ROW]
[ROW][C]5[/C][C]0.095559[/C][C]0.734[/C][C]0.232926[/C][/ROW]
[ROW][C]6[/C][C]-0.025943[/C][C]-0.1993[/C][C]0.421368[/C][/ROW]
[ROW][C]7[/C][C]-0.164703[/C][C]-1.2651[/C][C]0.105404[/C][/ROW]
[ROW][C]8[/C][C]-0.377401[/C][C]-2.8989[/C][C]0.002626[/C][/ROW]
[ROW][C]9[/C][C]-0.116786[/C][C]-0.8971[/C][C]0.186669[/C][/ROW]
[ROW][C]10[/C][C]-0.350305[/C][C]-2.6907[/C][C]0.00463[/C][/ROW]
[ROW][C]11[/C][C]0.115014[/C][C]0.8834[/C][C]0.190292[/C][/ROW]
[ROW][C]12[/C][C]0.527501[/C][C]4.0518[/C][C]7.5e-05[/C][/ROW]
[ROW][C]13[/C][C]-0.231847[/C][C]-1.7809[/C][C]0.040042[/C][/ROW]
[ROW][C]14[/C][C]0.231932[/C][C]1.7815[/C][C]0.039989[/C][/ROW]
[ROW][C]15[/C][C]0.098992[/C][C]0.7604[/C][C]0.225029[/C][/ROW]
[ROW][C]16[/C][C]0.163581[/C][C]1.2565[/C][C]0.106945[/C][/ROW]
[ROW][C]17[/C][C]0.024137[/C][C]0.1854[/C][C]0.426776[/C][/ROW]
[ROW][C]18[/C][C]0.039635[/C][C]0.3044[/C][C]0.380931[/C][/ROW]
[ROW][C]19[/C][C]-0.040005[/C][C]-0.3073[/C][C]0.379854[/C][/ROW]
[ROW][C]20[/C][C]0.019968[/C][C]0.1534[/C][C]0.439311[/C][/ROW]
[ROW][C]21[/C][C]-0.057951[/C][C]-0.4451[/C][C]0.328927[/C][/ROW]
[ROW][C]22[/C][C]0.073467[/C][C]0.5643[/C][C]0.287341[/C][/ROW]
[ROW][C]23[/C][C]0.050021[/C][C]0.3842[/C][C]0.3511[/C][/ROW]
[ROW][C]24[/C][C]-0.129041[/C][C]-0.9912[/C][C]0.162823[/C][/ROW]
[/TABLE]
Source: https://freestatistics.org/blog/index.php?pk=29170&T=2

Globally Unique Identifier (entire table): ba.freestatistics.org/blog/index.php?pk=29170&T=2

As an alternative you can also use a QR Code:  

The GUIDs for individual cells are displayed in the table below:

Partial Autocorrelation Function
Time lag kPACF(k)T-STATP-value
10.2926992.24830.014155
2-0.309479-2.37720.010354
3-0.192672-1.47990.072105
4-0.310194-2.38260.010215
50.0955590.7340.232926
6-0.025943-0.19930.421368
7-0.164703-1.26510.105404
8-0.377401-2.89890.002626
9-0.116786-0.89710.186669
10-0.350305-2.69070.00463
110.1150140.88340.190292
120.5275014.05187.5e-05
13-0.231847-1.78090.040042
140.2319321.78150.039989
150.0989920.76040.225029
160.1635811.25650.106945
170.0241370.18540.426776
180.0396350.30440.380931
19-0.040005-0.30730.379854
200.0199680.15340.439311
21-0.057951-0.44510.328927
220.0734670.56430.287341
230.0500210.38420.3511
24-0.129041-0.99120.162823


Parameters (Session):
par1 = 24 ; par2 = 1 ; par3 = 1 ; par4 = 0 ; par5 = 12 ;
Parameters (R input):
par1 = 24 ; par2 = 1 ; par3 = 1 ; par4 = 0 ; par5 = 12 ;
R code (references can be found in the software module):
if (par1 == 'Default') {
par1 = 10*log10(length(x))
} else {
par1 <- as.numeric(par1)
}
par2 <- as.numeric(par2)
par3 <- as.numeric(par3)
par4 <- as.numeric(par4)
par5 <- as.numeric(par5)
if (par2 == 0) {
x <- log(x)
} else {
x <- (x ^ par2 - 1) / par2
}
if (par3 > 0) x <- diff(x,lag=1,difference=par3)
if (par4 > 0) x <- diff(x,lag=par5,difference=par4)
bitmap(file='pic1.png')
racf <- acf(x,par1,main='Autocorrelation',xlab='lags',ylab='ACF')
dev.off()
bitmap(file='pic2.png')
rpacf <- pacf(x,par1,main='Partial Autocorrelation',xlab='lags',ylab='PACF')
dev.off()
(myacf <- c(racf$acf))
(mypacf <- c(rpacf$acf))
lengthx <- length(x)
sqrtn <- sqrt(lengthx)
load(file='createtable')
a<-table.start()
a<-table.row.start(a)
a<-table.element(a,'Autocorrelation Function',4,TRUE)
a<-table.row.end(a)
a<-table.row.start(a)
a<-table.element(a,'Time lag k',header=TRUE)
a<-table.element(a,hyperlink('basics.htm','ACF(k)','click here for more information about the Autocorrelation Function'),header=TRUE)
a<-table.element(a,'T-STAT',header=TRUE)
a<-table.element(a,'P-value',header=TRUE)
a<-table.row.end(a)
for (i in 2:(par1+1)) {
a<-table.row.start(a)
a<-table.element(a,i-1,header=TRUE)
a<-table.element(a,round(myacf[i],6))
mytstat <- myacf[i]*sqrtn
a<-table.element(a,round(mytstat,4))
a<-table.element(a,round(1-pt(abs(mytstat),lengthx),6))
a<-table.row.end(a)
}
a<-table.end(a)
table.save(a,file='mytable.tab')
a<-table.start()
a<-table.row.start(a)
a<-table.element(a,'Partial Autocorrelation Function',4,TRUE)
a<-table.row.end(a)
a<-table.row.start(a)
a<-table.element(a,'Time lag k',header=TRUE)
a<-table.element(a,hyperlink('basics.htm','PACF(k)','click here for more information about the Partial Autocorrelation Function'),header=TRUE)
a<-table.element(a,'T-STAT',header=TRUE)
a<-table.element(a,'P-value',header=TRUE)
a<-table.row.end(a)
for (i in 1:par1) {
a<-table.row.start(a)
a<-table.element(a,i,header=TRUE)
a<-table.element(a,round(mypacf[i],6))
mytstat <- mypacf[i]*sqrtn
a<-table.element(a,round(mytstat,4))
a<-table.element(a,round(1-pt(abs(mytstat),lengthx),6))
a<-table.row.end(a)
}
a<-table.end(a)
table.save(a,file='mytable1.tab')