Free Statistics

of Irreproducible Research!

Author's title

Author*The author of this computation has been verified*
R Software Modulerwasp_autocorrelation.wasp
Title produced by software(Partial) Autocorrelation Function
Date of computationFri, 05 Dec 2008 03:10:06 -0700
Cite this page as followsStatistical Computations at FreeStatistics.org, Office for Research Development and Education, URL https://freestatistics.org/blog/index.php?v=date/2008/Dec/05/t1228471861xsf3wulfnvv8frd.htm/, Retrieved Thu, 16 May 2024 15:39:15 +0000
Statistical Computations at FreeStatistics.org, Office for Research Development and Education, URL https://freestatistics.org/blog/index.php?pk=29126, Retrieved Thu, 16 May 2024 15:39:15 +0000
QR Codes:

Original text written by user:
IsPrivate?No (this computation is public)
User-defined keywords
Estimated Impact190
Family? (F = Feedback message, R = changed R code, M = changed R Module, P = changed Parameters, D = changed Data)
-     [Univariate Data Series] [Werkloosheid VLAA...] [2008-10-19 10:39:43] [46c5a5fbda57fdfa1d4ef48658f82a0c]
- RMP     [(Partial) Autocorrelation Function] [Taak 8 - Step 3 A...] [2008-12-05 10:10:06] [b23db733701c4d62df5e228d507c1c6a] [Current]
Feedback Forum

Post a new message
Dataseries X:
217859
208679
213188
216234
213587
209465
204045
200237
203666
241476
260307
243324
244460
233575
237217
235243
230354
227184
221678
217142
219452
256446
265845
248624
241114
229245
231805
219277
219313
212610
214771
211142
211457
240048
240636
230580
208795
197922
194596
194581
185686
178106
172608
167302
168053
202300
202388
182516
173476
166444
171297
169701
164182
161914
159612
151001
158114
186530
187069
174330


Summary of computational transaction
Raw Inputview raw input (R code)
Raw Outputview raw output of R engine
Computing time1 seconds
R Server'George Udny Yule' @ 72.249.76.132

\begin{tabular}{lllllllll}
\hline
Summary of computational transaction \tabularnewline
Raw Input & view raw input (R code)  \tabularnewline
Raw Output & view raw output of R engine  \tabularnewline
Computing time & 1 seconds \tabularnewline
R Server & 'George Udny Yule' @ 72.249.76.132 \tabularnewline
\hline
\end{tabular}
%Source: https://freestatistics.org/blog/index.php?pk=29126&T=0

[TABLE]
[ROW][C]Summary of computational transaction[/C][/ROW]
[ROW][C]Raw Input[/C][C]view raw input (R code) [/C][/ROW]
[ROW][C]Raw Output[/C][C]view raw output of R engine [/C][/ROW]
[ROW][C]Computing time[/C][C]1 seconds[/C][/ROW]
[ROW][C]R Server[/C][C]'George Udny Yule' @ 72.249.76.132[/C][/ROW]
[/TABLE]
Source: https://freestatistics.org/blog/index.php?pk=29126&T=0

Globally Unique Identifier (entire table): ba.freestatistics.org/blog/index.php?pk=29126&T=0

As an alternative you can also use a QR Code:  

The GUIDs for individual cells are displayed in the table below:

Summary of computational transaction
Raw Inputview raw input (R code)
Raw Outputview raw output of R engine
Computing time1 seconds
R Server'George Udny Yule' @ 72.249.76.132


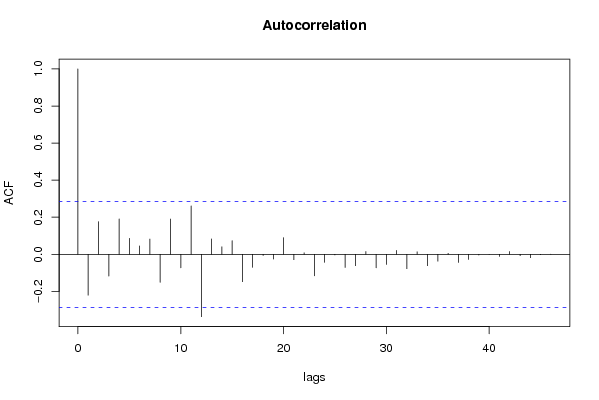
Autocorrelation Function
Time lag kACF(k)T-STATP-value
1-0.22085-1.51410.068352
20.1759681.20640.116856
3-0.11746-0.80530.21236
40.1904181.30540.099049
50.0858780.58880.279423
60.0449170.30790.379745
70.0820950.56280.288117
8-0.151498-1.03860.152148
90.190081.30310.099441
10-0.073269-0.50230.308899
110.2606931.78720.040176
12-0.336505-2.3070.012755
130.0827560.56730.28659
140.0404140.27710.391472
150.073490.50380.30837
16-0.147858-1.01370.157967
17-0.070196-0.48120.316289
18-0.005895-0.04040.483968
19-0.025799-0.17690.430184
200.0896720.61480.27084
21-0.029479-0.20210.420357
220.0082590.05660.477543
23-0.116381-0.79790.21448
24-0.043162-0.29590.384304
25-0.003548-0.02430.490348
26-0.070755-0.48510.314939
27-0.061422-0.42110.337806
280.0146050.10010.460335
29-0.072991-0.50040.309564
30-0.054839-0.3760.354319
310.0210450.14430.44295
32-0.077885-0.5340.297945
330.013620.09340.463
34-0.061358-0.42060.337964
35-0.037123-0.25450.40011
360.0055770.03820.484832
37-0.043989-0.30160.382154
38-0.027839-0.19090.42473
39-0.003971-0.02720.489198
40-0.000255-0.00170.499307
41-0.011724-0.08040.46814
420.014430.09890.460808
43-0.007297-0.050.480158
44-0.018448-0.12650.44995
45-0.002012-0.01380.494527
46-0.000109-7e-040.499705
47NANANA
48NANANA
49NANANA
50NANANA
51NANANA
52NANANA
53NANANA
54NANANA
55NANANA
56NANANA
57NANANA
58NANANA
59NANANA
60NANANA

\begin{tabular}{lllllllll}
\hline
Autocorrelation Function \tabularnewline
Time lag k & ACF(k) & T-STAT & P-value \tabularnewline
1 & -0.22085 & -1.5141 & 0.068352 \tabularnewline
2 & 0.175968 & 1.2064 & 0.116856 \tabularnewline
3 & -0.11746 & -0.8053 & 0.21236 \tabularnewline
4 & 0.190418 & 1.3054 & 0.099049 \tabularnewline
5 & 0.085878 & 0.5888 & 0.279423 \tabularnewline
6 & 0.044917 & 0.3079 & 0.379745 \tabularnewline
7 & 0.082095 & 0.5628 & 0.288117 \tabularnewline
8 & -0.151498 & -1.0386 & 0.152148 \tabularnewline
9 & 0.19008 & 1.3031 & 0.099441 \tabularnewline
10 & -0.073269 & -0.5023 & 0.308899 \tabularnewline
11 & 0.260693 & 1.7872 & 0.040176 \tabularnewline
12 & -0.336505 & -2.307 & 0.012755 \tabularnewline
13 & 0.082756 & 0.5673 & 0.28659 \tabularnewline
14 & 0.040414 & 0.2771 & 0.391472 \tabularnewline
15 & 0.07349 & 0.5038 & 0.30837 \tabularnewline
16 & -0.147858 & -1.0137 & 0.157967 \tabularnewline
17 & -0.070196 & -0.4812 & 0.316289 \tabularnewline
18 & -0.005895 & -0.0404 & 0.483968 \tabularnewline
19 & -0.025799 & -0.1769 & 0.430184 \tabularnewline
20 & 0.089672 & 0.6148 & 0.27084 \tabularnewline
21 & -0.029479 & -0.2021 & 0.420357 \tabularnewline
22 & 0.008259 & 0.0566 & 0.477543 \tabularnewline
23 & -0.116381 & -0.7979 & 0.21448 \tabularnewline
24 & -0.043162 & -0.2959 & 0.384304 \tabularnewline
25 & -0.003548 & -0.0243 & 0.490348 \tabularnewline
26 & -0.070755 & -0.4851 & 0.314939 \tabularnewline
27 & -0.061422 & -0.4211 & 0.337806 \tabularnewline
28 & 0.014605 & 0.1001 & 0.460335 \tabularnewline
29 & -0.072991 & -0.5004 & 0.309564 \tabularnewline
30 & -0.054839 & -0.376 & 0.354319 \tabularnewline
31 & 0.021045 & 0.1443 & 0.44295 \tabularnewline
32 & -0.077885 & -0.534 & 0.297945 \tabularnewline
33 & 0.01362 & 0.0934 & 0.463 \tabularnewline
34 & -0.061358 & -0.4206 & 0.337964 \tabularnewline
35 & -0.037123 & -0.2545 & 0.40011 \tabularnewline
36 & 0.005577 & 0.0382 & 0.484832 \tabularnewline
37 & -0.043989 & -0.3016 & 0.382154 \tabularnewline
38 & -0.027839 & -0.1909 & 0.42473 \tabularnewline
39 & -0.003971 & -0.0272 & 0.489198 \tabularnewline
40 & -0.000255 & -0.0017 & 0.499307 \tabularnewline
41 & -0.011724 & -0.0804 & 0.46814 \tabularnewline
42 & 0.01443 & 0.0989 & 0.460808 \tabularnewline
43 & -0.007297 & -0.05 & 0.480158 \tabularnewline
44 & -0.018448 & -0.1265 & 0.44995 \tabularnewline
45 & -0.002012 & -0.0138 & 0.494527 \tabularnewline
46 & -0.000109 & -7e-04 & 0.499705 \tabularnewline
47 & NA & NA & NA \tabularnewline
48 & NA & NA & NA \tabularnewline
49 & NA & NA & NA \tabularnewline
50 & NA & NA & NA \tabularnewline
51 & NA & NA & NA \tabularnewline
52 & NA & NA & NA \tabularnewline
53 & NA & NA & NA \tabularnewline
54 & NA & NA & NA \tabularnewline
55 & NA & NA & NA \tabularnewline
56 & NA & NA & NA \tabularnewline
57 & NA & NA & NA \tabularnewline
58 & NA & NA & NA \tabularnewline
59 & NA & NA & NA \tabularnewline
60 & NA & NA & NA \tabularnewline
\hline
\end{tabular}
%Source: https://freestatistics.org/blog/index.php?pk=29126&T=1

[TABLE]
[ROW][C]Autocorrelation Function[/C][/ROW]
[ROW][C]Time lag k[/C][C]ACF(k)[/C][C]T-STAT[/C][C]P-value[/C][/ROW]
[ROW][C]1[/C][C]-0.22085[/C][C]-1.5141[/C][C]0.068352[/C][/ROW]
[ROW][C]2[/C][C]0.175968[/C][C]1.2064[/C][C]0.116856[/C][/ROW]
[ROW][C]3[/C][C]-0.11746[/C][C]-0.8053[/C][C]0.21236[/C][/ROW]
[ROW][C]4[/C][C]0.190418[/C][C]1.3054[/C][C]0.099049[/C][/ROW]
[ROW][C]5[/C][C]0.085878[/C][C]0.5888[/C][C]0.279423[/C][/ROW]
[ROW][C]6[/C][C]0.044917[/C][C]0.3079[/C][C]0.379745[/C][/ROW]
[ROW][C]7[/C][C]0.082095[/C][C]0.5628[/C][C]0.288117[/C][/ROW]
[ROW][C]8[/C][C]-0.151498[/C][C]-1.0386[/C][C]0.152148[/C][/ROW]
[ROW][C]9[/C][C]0.19008[/C][C]1.3031[/C][C]0.099441[/C][/ROW]
[ROW][C]10[/C][C]-0.073269[/C][C]-0.5023[/C][C]0.308899[/C][/ROW]
[ROW][C]11[/C][C]0.260693[/C][C]1.7872[/C][C]0.040176[/C][/ROW]
[ROW][C]12[/C][C]-0.336505[/C][C]-2.307[/C][C]0.012755[/C][/ROW]
[ROW][C]13[/C][C]0.082756[/C][C]0.5673[/C][C]0.28659[/C][/ROW]
[ROW][C]14[/C][C]0.040414[/C][C]0.2771[/C][C]0.391472[/C][/ROW]
[ROW][C]15[/C][C]0.07349[/C][C]0.5038[/C][C]0.30837[/C][/ROW]
[ROW][C]16[/C][C]-0.147858[/C][C]-1.0137[/C][C]0.157967[/C][/ROW]
[ROW][C]17[/C][C]-0.070196[/C][C]-0.4812[/C][C]0.316289[/C][/ROW]
[ROW][C]18[/C][C]-0.005895[/C][C]-0.0404[/C][C]0.483968[/C][/ROW]
[ROW][C]19[/C][C]-0.025799[/C][C]-0.1769[/C][C]0.430184[/C][/ROW]
[ROW][C]20[/C][C]0.089672[/C][C]0.6148[/C][C]0.27084[/C][/ROW]
[ROW][C]21[/C][C]-0.029479[/C][C]-0.2021[/C][C]0.420357[/C][/ROW]
[ROW][C]22[/C][C]0.008259[/C][C]0.0566[/C][C]0.477543[/C][/ROW]
[ROW][C]23[/C][C]-0.116381[/C][C]-0.7979[/C][C]0.21448[/C][/ROW]
[ROW][C]24[/C][C]-0.043162[/C][C]-0.2959[/C][C]0.384304[/C][/ROW]
[ROW][C]25[/C][C]-0.003548[/C][C]-0.0243[/C][C]0.490348[/C][/ROW]
[ROW][C]26[/C][C]-0.070755[/C][C]-0.4851[/C][C]0.314939[/C][/ROW]
[ROW][C]27[/C][C]-0.061422[/C][C]-0.4211[/C][C]0.337806[/C][/ROW]
[ROW][C]28[/C][C]0.014605[/C][C]0.1001[/C][C]0.460335[/C][/ROW]
[ROW][C]29[/C][C]-0.072991[/C][C]-0.5004[/C][C]0.309564[/C][/ROW]
[ROW][C]30[/C][C]-0.054839[/C][C]-0.376[/C][C]0.354319[/C][/ROW]
[ROW][C]31[/C][C]0.021045[/C][C]0.1443[/C][C]0.44295[/C][/ROW]
[ROW][C]32[/C][C]-0.077885[/C][C]-0.534[/C][C]0.297945[/C][/ROW]
[ROW][C]33[/C][C]0.01362[/C][C]0.0934[/C][C]0.463[/C][/ROW]
[ROW][C]34[/C][C]-0.061358[/C][C]-0.4206[/C][C]0.337964[/C][/ROW]
[ROW][C]35[/C][C]-0.037123[/C][C]-0.2545[/C][C]0.40011[/C][/ROW]
[ROW][C]36[/C][C]0.005577[/C][C]0.0382[/C][C]0.484832[/C][/ROW]
[ROW][C]37[/C][C]-0.043989[/C][C]-0.3016[/C][C]0.382154[/C][/ROW]
[ROW][C]38[/C][C]-0.027839[/C][C]-0.1909[/C][C]0.42473[/C][/ROW]
[ROW][C]39[/C][C]-0.003971[/C][C]-0.0272[/C][C]0.489198[/C][/ROW]
[ROW][C]40[/C][C]-0.000255[/C][C]-0.0017[/C][C]0.499307[/C][/ROW]
[ROW][C]41[/C][C]-0.011724[/C][C]-0.0804[/C][C]0.46814[/C][/ROW]
[ROW][C]42[/C][C]0.01443[/C][C]0.0989[/C][C]0.460808[/C][/ROW]
[ROW][C]43[/C][C]-0.007297[/C][C]-0.05[/C][C]0.480158[/C][/ROW]
[ROW][C]44[/C][C]-0.018448[/C][C]-0.1265[/C][C]0.44995[/C][/ROW]
[ROW][C]45[/C][C]-0.002012[/C][C]-0.0138[/C][C]0.494527[/C][/ROW]
[ROW][C]46[/C][C]-0.000109[/C][C]-7e-04[/C][C]0.499705[/C][/ROW]
[ROW][C]47[/C][C]NA[/C][C]NA[/C][C]NA[/C][/ROW]
[ROW][C]48[/C][C]NA[/C][C]NA[/C][C]NA[/C][/ROW]
[ROW][C]49[/C][C]NA[/C][C]NA[/C][C]NA[/C][/ROW]
[ROW][C]50[/C][C]NA[/C][C]NA[/C][C]NA[/C][/ROW]
[ROW][C]51[/C][C]NA[/C][C]NA[/C][C]NA[/C][/ROW]
[ROW][C]52[/C][C]NA[/C][C]NA[/C][C]NA[/C][/ROW]
[ROW][C]53[/C][C]NA[/C][C]NA[/C][C]NA[/C][/ROW]
[ROW][C]54[/C][C]NA[/C][C]NA[/C][C]NA[/C][/ROW]
[ROW][C]55[/C][C]NA[/C][C]NA[/C][C]NA[/C][/ROW]
[ROW][C]56[/C][C]NA[/C][C]NA[/C][C]NA[/C][/ROW]
[ROW][C]57[/C][C]NA[/C][C]NA[/C][C]NA[/C][/ROW]
[ROW][C]58[/C][C]NA[/C][C]NA[/C][C]NA[/C][/ROW]
[ROW][C]59[/C][C]NA[/C][C]NA[/C][C]NA[/C][/ROW]
[ROW][C]60[/C][C]NA[/C][C]NA[/C][C]NA[/C][/ROW]
[/TABLE]
Source: https://freestatistics.org/blog/index.php?pk=29126&T=1

Globally Unique Identifier (entire table): ba.freestatistics.org/blog/index.php?pk=29126&T=1

As an alternative you can also use a QR Code:  

The GUIDs for individual cells are displayed in the table below:

Autocorrelation Function
Time lag kACF(k)T-STATP-value
1-0.22085-1.51410.068352
20.1759681.20640.116856
3-0.11746-0.80530.21236
40.1904181.30540.099049
50.0858780.58880.279423
60.0449170.30790.379745
70.0820950.56280.288117
8-0.151498-1.03860.152148
90.190081.30310.099441
10-0.073269-0.50230.308899
110.2606931.78720.040176
12-0.336505-2.3070.012755
130.0827560.56730.28659
140.0404140.27710.391472
150.073490.50380.30837
16-0.147858-1.01370.157967
17-0.070196-0.48120.316289
18-0.005895-0.04040.483968
19-0.025799-0.17690.430184
200.0896720.61480.27084
21-0.029479-0.20210.420357
220.0082590.05660.477543
23-0.116381-0.79790.21448
24-0.043162-0.29590.384304
25-0.003548-0.02430.490348
26-0.070755-0.48510.314939
27-0.061422-0.42110.337806
280.0146050.10010.460335
29-0.072991-0.50040.309564
30-0.054839-0.3760.354319
310.0210450.14430.44295
32-0.077885-0.5340.297945
330.013620.09340.463
34-0.061358-0.42060.337964
35-0.037123-0.25450.40011
360.0055770.03820.484832
37-0.043989-0.30160.382154
38-0.027839-0.19090.42473
39-0.003971-0.02720.489198
40-0.000255-0.00170.499307
41-0.011724-0.08040.46814
420.014430.09890.460808
43-0.007297-0.050.480158
44-0.018448-0.12650.44995
45-0.002012-0.01380.494527
46-0.000109-7e-040.499705
47NANANA
48NANANA
49NANANA
50NANANA
51NANANA
52NANANA
53NANANA
54NANANA
55NANANA
56NANANA
57NANANA
58NANANA
59NANANA
60NANANA


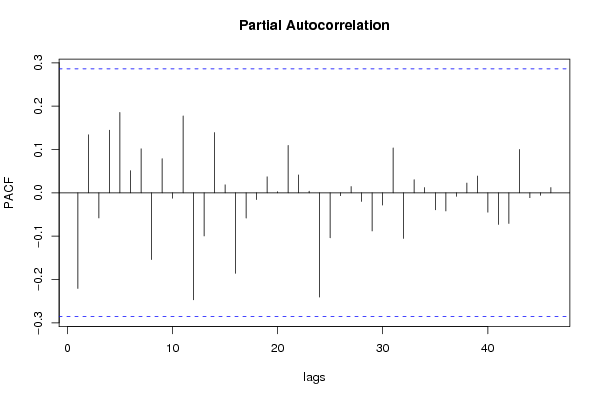
Partial Autocorrelation Function
Time lag kPACF(k)T-STATP-value
1-0.22085-1.51410.068352
20.1337150.91670.181989
3-0.058084-0.39820.346141
40.1444110.990.163615
50.1853831.27090.105006
60.051110.35040.363805
70.1014080.69520.245172
8-0.154062-1.05620.148139
90.0787920.54020.295816
10-0.012561-0.08610.46587
110.1774861.21680.114881
12-0.246889-1.69260.048577
13-0.09954-0.68240.249164
140.1391340.95390.172518
150.0183340.12570.450256
16-0.185732-1.27330.104584
17-0.058372-0.40020.345419
18-0.015623-0.10710.45758
190.0368880.25290.400729
200.0025780.01770.492986
210.1092790.74920.228741
220.0411880.28240.389449
230.0036250.02480.49014
24-0.240731-1.65040.052768
25-0.103933-0.71250.239829
26-0.006637-0.04550.48195
270.0142560.09770.461281
28-0.019889-0.13640.446061
29-0.088031-0.60350.274536
30-0.028411-0.19480.423203
310.1036980.71090.240324
32-0.105257-0.72160.237056
330.0301510.20670.418566
340.0121180.08310.467072
35-0.039141-0.26830.394806
36-0.041929-0.28740.387516
37-0.008024-0.0550.478183
380.0225950.15490.438781
390.0386210.26480.396172
40-0.044815-0.30720.38001
41-0.072914-0.49990.309747
42-0.070849-0.48570.314714
430.1000840.68610.247998
44-0.011317-0.07760.469242
45-0.005767-0.03950.484315
460.012160.08340.466957
47NANANA
48NANANA
49NANANA
50NANANA
51NANANA
52NANANA
53NANANA
54NANANA
55NANANA
56NANANA
57NANANA
58NANANA
59NANANA
60NANANA

\begin{tabular}{lllllllll}
\hline
Partial Autocorrelation Function \tabularnewline
Time lag k & PACF(k) & T-STAT & P-value \tabularnewline
1 & -0.22085 & -1.5141 & 0.068352 \tabularnewline
2 & 0.133715 & 0.9167 & 0.181989 \tabularnewline
3 & -0.058084 & -0.3982 & 0.346141 \tabularnewline
4 & 0.144411 & 0.99 & 0.163615 \tabularnewline
5 & 0.185383 & 1.2709 & 0.105006 \tabularnewline
6 & 0.05111 & 0.3504 & 0.363805 \tabularnewline
7 & 0.101408 & 0.6952 & 0.245172 \tabularnewline
8 & -0.154062 & -1.0562 & 0.148139 \tabularnewline
9 & 0.078792 & 0.5402 & 0.295816 \tabularnewline
10 & -0.012561 & -0.0861 & 0.46587 \tabularnewline
11 & 0.177486 & 1.2168 & 0.114881 \tabularnewline
12 & -0.246889 & -1.6926 & 0.048577 \tabularnewline
13 & -0.09954 & -0.6824 & 0.249164 \tabularnewline
14 & 0.139134 & 0.9539 & 0.172518 \tabularnewline
15 & 0.018334 & 0.1257 & 0.450256 \tabularnewline
16 & -0.185732 & -1.2733 & 0.104584 \tabularnewline
17 & -0.058372 & -0.4002 & 0.345419 \tabularnewline
18 & -0.015623 & -0.1071 & 0.45758 \tabularnewline
19 & 0.036888 & 0.2529 & 0.400729 \tabularnewline
20 & 0.002578 & 0.0177 & 0.492986 \tabularnewline
21 & 0.109279 & 0.7492 & 0.228741 \tabularnewline
22 & 0.041188 & 0.2824 & 0.389449 \tabularnewline
23 & 0.003625 & 0.0248 & 0.49014 \tabularnewline
24 & -0.240731 & -1.6504 & 0.052768 \tabularnewline
25 & -0.103933 & -0.7125 & 0.239829 \tabularnewline
26 & -0.006637 & -0.0455 & 0.48195 \tabularnewline
27 & 0.014256 & 0.0977 & 0.461281 \tabularnewline
28 & -0.019889 & -0.1364 & 0.446061 \tabularnewline
29 & -0.088031 & -0.6035 & 0.274536 \tabularnewline
30 & -0.028411 & -0.1948 & 0.423203 \tabularnewline
31 & 0.103698 & 0.7109 & 0.240324 \tabularnewline
32 & -0.105257 & -0.7216 & 0.237056 \tabularnewline
33 & 0.030151 & 0.2067 & 0.418566 \tabularnewline
34 & 0.012118 & 0.0831 & 0.467072 \tabularnewline
35 & -0.039141 & -0.2683 & 0.394806 \tabularnewline
36 & -0.041929 & -0.2874 & 0.387516 \tabularnewline
37 & -0.008024 & -0.055 & 0.478183 \tabularnewline
38 & 0.022595 & 0.1549 & 0.438781 \tabularnewline
39 & 0.038621 & 0.2648 & 0.396172 \tabularnewline
40 & -0.044815 & -0.3072 & 0.38001 \tabularnewline
41 & -0.072914 & -0.4999 & 0.309747 \tabularnewline
42 & -0.070849 & -0.4857 & 0.314714 \tabularnewline
43 & 0.100084 & 0.6861 & 0.247998 \tabularnewline
44 & -0.011317 & -0.0776 & 0.469242 \tabularnewline
45 & -0.005767 & -0.0395 & 0.484315 \tabularnewline
46 & 0.01216 & 0.0834 & 0.466957 \tabularnewline
47 & NA & NA & NA \tabularnewline
48 & NA & NA & NA \tabularnewline
49 & NA & NA & NA \tabularnewline
50 & NA & NA & NA \tabularnewline
51 & NA & NA & NA \tabularnewline
52 & NA & NA & NA \tabularnewline
53 & NA & NA & NA \tabularnewline
54 & NA & NA & NA \tabularnewline
55 & NA & NA & NA \tabularnewline
56 & NA & NA & NA \tabularnewline
57 & NA & NA & NA \tabularnewline
58 & NA & NA & NA \tabularnewline
59 & NA & NA & NA \tabularnewline
60 & NA & NA & NA \tabularnewline
\hline
\end{tabular}
%Source: https://freestatistics.org/blog/index.php?pk=29126&T=2

[TABLE]
[ROW][C]Partial Autocorrelation Function[/C][/ROW]
[ROW][C]Time lag k[/C][C]PACF(k)[/C][C]T-STAT[/C][C]P-value[/C][/ROW]
[ROW][C]1[/C][C]-0.22085[/C][C]-1.5141[/C][C]0.068352[/C][/ROW]
[ROW][C]2[/C][C]0.133715[/C][C]0.9167[/C][C]0.181989[/C][/ROW]
[ROW][C]3[/C][C]-0.058084[/C][C]-0.3982[/C][C]0.346141[/C][/ROW]
[ROW][C]4[/C][C]0.144411[/C][C]0.99[/C][C]0.163615[/C][/ROW]
[ROW][C]5[/C][C]0.185383[/C][C]1.2709[/C][C]0.105006[/C][/ROW]
[ROW][C]6[/C][C]0.05111[/C][C]0.3504[/C][C]0.363805[/C][/ROW]
[ROW][C]7[/C][C]0.101408[/C][C]0.6952[/C][C]0.245172[/C][/ROW]
[ROW][C]8[/C][C]-0.154062[/C][C]-1.0562[/C][C]0.148139[/C][/ROW]
[ROW][C]9[/C][C]0.078792[/C][C]0.5402[/C][C]0.295816[/C][/ROW]
[ROW][C]10[/C][C]-0.012561[/C][C]-0.0861[/C][C]0.46587[/C][/ROW]
[ROW][C]11[/C][C]0.177486[/C][C]1.2168[/C][C]0.114881[/C][/ROW]
[ROW][C]12[/C][C]-0.246889[/C][C]-1.6926[/C][C]0.048577[/C][/ROW]
[ROW][C]13[/C][C]-0.09954[/C][C]-0.6824[/C][C]0.249164[/C][/ROW]
[ROW][C]14[/C][C]0.139134[/C][C]0.9539[/C][C]0.172518[/C][/ROW]
[ROW][C]15[/C][C]0.018334[/C][C]0.1257[/C][C]0.450256[/C][/ROW]
[ROW][C]16[/C][C]-0.185732[/C][C]-1.2733[/C][C]0.104584[/C][/ROW]
[ROW][C]17[/C][C]-0.058372[/C][C]-0.4002[/C][C]0.345419[/C][/ROW]
[ROW][C]18[/C][C]-0.015623[/C][C]-0.1071[/C][C]0.45758[/C][/ROW]
[ROW][C]19[/C][C]0.036888[/C][C]0.2529[/C][C]0.400729[/C][/ROW]
[ROW][C]20[/C][C]0.002578[/C][C]0.0177[/C][C]0.492986[/C][/ROW]
[ROW][C]21[/C][C]0.109279[/C][C]0.7492[/C][C]0.228741[/C][/ROW]
[ROW][C]22[/C][C]0.041188[/C][C]0.2824[/C][C]0.389449[/C][/ROW]
[ROW][C]23[/C][C]0.003625[/C][C]0.0248[/C][C]0.49014[/C][/ROW]
[ROW][C]24[/C][C]-0.240731[/C][C]-1.6504[/C][C]0.052768[/C][/ROW]
[ROW][C]25[/C][C]-0.103933[/C][C]-0.7125[/C][C]0.239829[/C][/ROW]
[ROW][C]26[/C][C]-0.006637[/C][C]-0.0455[/C][C]0.48195[/C][/ROW]
[ROW][C]27[/C][C]0.014256[/C][C]0.0977[/C][C]0.461281[/C][/ROW]
[ROW][C]28[/C][C]-0.019889[/C][C]-0.1364[/C][C]0.446061[/C][/ROW]
[ROW][C]29[/C][C]-0.088031[/C][C]-0.6035[/C][C]0.274536[/C][/ROW]
[ROW][C]30[/C][C]-0.028411[/C][C]-0.1948[/C][C]0.423203[/C][/ROW]
[ROW][C]31[/C][C]0.103698[/C][C]0.7109[/C][C]0.240324[/C][/ROW]
[ROW][C]32[/C][C]-0.105257[/C][C]-0.7216[/C][C]0.237056[/C][/ROW]
[ROW][C]33[/C][C]0.030151[/C][C]0.2067[/C][C]0.418566[/C][/ROW]
[ROW][C]34[/C][C]0.012118[/C][C]0.0831[/C][C]0.467072[/C][/ROW]
[ROW][C]35[/C][C]-0.039141[/C][C]-0.2683[/C][C]0.394806[/C][/ROW]
[ROW][C]36[/C][C]-0.041929[/C][C]-0.2874[/C][C]0.387516[/C][/ROW]
[ROW][C]37[/C][C]-0.008024[/C][C]-0.055[/C][C]0.478183[/C][/ROW]
[ROW][C]38[/C][C]0.022595[/C][C]0.1549[/C][C]0.438781[/C][/ROW]
[ROW][C]39[/C][C]0.038621[/C][C]0.2648[/C][C]0.396172[/C][/ROW]
[ROW][C]40[/C][C]-0.044815[/C][C]-0.3072[/C][C]0.38001[/C][/ROW]
[ROW][C]41[/C][C]-0.072914[/C][C]-0.4999[/C][C]0.309747[/C][/ROW]
[ROW][C]42[/C][C]-0.070849[/C][C]-0.4857[/C][C]0.314714[/C][/ROW]
[ROW][C]43[/C][C]0.100084[/C][C]0.6861[/C][C]0.247998[/C][/ROW]
[ROW][C]44[/C][C]-0.011317[/C][C]-0.0776[/C][C]0.469242[/C][/ROW]
[ROW][C]45[/C][C]-0.005767[/C][C]-0.0395[/C][C]0.484315[/C][/ROW]
[ROW][C]46[/C][C]0.01216[/C][C]0.0834[/C][C]0.466957[/C][/ROW]
[ROW][C]47[/C][C]NA[/C][C]NA[/C][C]NA[/C][/ROW]
[ROW][C]48[/C][C]NA[/C][C]NA[/C][C]NA[/C][/ROW]
[ROW][C]49[/C][C]NA[/C][C]NA[/C][C]NA[/C][/ROW]
[ROW][C]50[/C][C]NA[/C][C]NA[/C][C]NA[/C][/ROW]
[ROW][C]51[/C][C]NA[/C][C]NA[/C][C]NA[/C][/ROW]
[ROW][C]52[/C][C]NA[/C][C]NA[/C][C]NA[/C][/ROW]
[ROW][C]53[/C][C]NA[/C][C]NA[/C][C]NA[/C][/ROW]
[ROW][C]54[/C][C]NA[/C][C]NA[/C][C]NA[/C][/ROW]
[ROW][C]55[/C][C]NA[/C][C]NA[/C][C]NA[/C][/ROW]
[ROW][C]56[/C][C]NA[/C][C]NA[/C][C]NA[/C][/ROW]
[ROW][C]57[/C][C]NA[/C][C]NA[/C][C]NA[/C][/ROW]
[ROW][C]58[/C][C]NA[/C][C]NA[/C][C]NA[/C][/ROW]
[ROW][C]59[/C][C]NA[/C][C]NA[/C][C]NA[/C][/ROW]
[ROW][C]60[/C][C]NA[/C][C]NA[/C][C]NA[/C][/ROW]
[/TABLE]
Source: https://freestatistics.org/blog/index.php?pk=29126&T=2

Globally Unique Identifier (entire table): ba.freestatistics.org/blog/index.php?pk=29126&T=2

As an alternative you can also use a QR Code:  

The GUIDs for individual cells are displayed in the table below:

Partial Autocorrelation Function
Time lag kPACF(k)T-STATP-value
1-0.22085-1.51410.068352
20.1337150.91670.181989
3-0.058084-0.39820.346141
40.1444110.990.163615
50.1853831.27090.105006
60.051110.35040.363805
70.1014080.69520.245172
8-0.154062-1.05620.148139
90.0787920.54020.295816
10-0.012561-0.08610.46587
110.1774861.21680.114881
12-0.246889-1.69260.048577
13-0.09954-0.68240.249164
140.1391340.95390.172518
150.0183340.12570.450256
16-0.185732-1.27330.104584
17-0.058372-0.40020.345419
18-0.015623-0.10710.45758
190.0368880.25290.400729
200.0025780.01770.492986
210.1092790.74920.228741
220.0411880.28240.389449
230.0036250.02480.49014
24-0.240731-1.65040.052768
25-0.103933-0.71250.239829
26-0.006637-0.04550.48195
270.0142560.09770.461281
28-0.019889-0.13640.446061
29-0.088031-0.60350.274536
30-0.028411-0.19480.423203
310.1036980.71090.240324
32-0.105257-0.72160.237056
330.0301510.20670.418566
340.0121180.08310.467072
35-0.039141-0.26830.394806
36-0.041929-0.28740.387516
37-0.008024-0.0550.478183
380.0225950.15490.438781
390.0386210.26480.396172
40-0.044815-0.30720.38001
41-0.072914-0.49990.309747
42-0.070849-0.48570.314714
430.1000840.68610.247998
44-0.011317-0.07760.469242
45-0.005767-0.03950.484315
460.012160.08340.466957
47NANANA
48NANANA
49NANANA
50NANANA
51NANANA
52NANANA
53NANANA
54NANANA
55NANANA
56NANANA
57NANANA
58NANANA
59NANANA
60NANANA


Parameters (Session):
par1 = 36 ; par2 = 1.2 ; par3 = 1 ; par4 = 1 ; par5 = 12 ;
Parameters (R input):
par1 = 60 ; par2 = 0.2 ; par3 = 1 ; par4 = 1 ; par5 = 12 ;
R code (references can be found in the software module):
if (par1 == 'Default') {
par1 = 10*log10(length(x))
} else {
par1 <- as.numeric(par1)
}
par2 <- as.numeric(par2)
par3 <- as.numeric(par3)
par4 <- as.numeric(par4)
par5 <- as.numeric(par5)
if (par2 == 0) {
x <- log(x)
} else {
x <- (x ^ par2 - 1) / par2
}
if (par3 > 0) x <- diff(x,lag=1,difference=par3)
if (par4 > 0) x <- diff(x,lag=par5,difference=par4)
bitmap(file='pic1.png')
racf <- acf(x,par1,main='Autocorrelation',xlab='lags',ylab='ACF')
dev.off()
bitmap(file='pic2.png')
rpacf <- pacf(x,par1,main='Partial Autocorrelation',xlab='lags',ylab='PACF')
dev.off()
(myacf <- c(racf$acf))
(mypacf <- c(rpacf$acf))
lengthx <- length(x)
sqrtn <- sqrt(lengthx)
load(file='createtable')
a<-table.start()
a<-table.row.start(a)
a<-table.element(a,'Autocorrelation Function',4,TRUE)
a<-table.row.end(a)
a<-table.row.start(a)
a<-table.element(a,'Time lag k',header=TRUE)
a<-table.element(a,hyperlink('basics.htm','ACF(k)','click here for more information about the Autocorrelation Function'),header=TRUE)
a<-table.element(a,'T-STAT',header=TRUE)
a<-table.element(a,'P-value',header=TRUE)
a<-table.row.end(a)
for (i in 2:(par1+1)) {
a<-table.row.start(a)
a<-table.element(a,i-1,header=TRUE)
a<-table.element(a,round(myacf[i],6))
mytstat <- myacf[i]*sqrtn
a<-table.element(a,round(mytstat,4))
a<-table.element(a,round(1-pt(abs(mytstat),lengthx),6))
a<-table.row.end(a)
}
a<-table.end(a)
table.save(a,file='mytable.tab')
a<-table.start()
a<-table.row.start(a)
a<-table.element(a,'Partial Autocorrelation Function',4,TRUE)
a<-table.row.end(a)
a<-table.row.start(a)
a<-table.element(a,'Time lag k',header=TRUE)
a<-table.element(a,hyperlink('basics.htm','PACF(k)','click here for more information about the Partial Autocorrelation Function'),header=TRUE)
a<-table.element(a,'T-STAT',header=TRUE)
a<-table.element(a,'P-value',header=TRUE)
a<-table.row.end(a)
for (i in 1:par1) {
a<-table.row.start(a)
a<-table.element(a,i,header=TRUE)
a<-table.element(a,round(mypacf[i],6))
mytstat <- mypacf[i]*sqrtn
a<-table.element(a,round(mytstat,4))
a<-table.element(a,round(1-pt(abs(mytstat),lengthx),6))
a<-table.row.end(a)
}
a<-table.end(a)
table.save(a,file='mytable1.tab')