Free Statistics

of Irreproducible Research!

Author's title

Author*The author of this computation has been verified*
R Software Modulerwasp_autocorrelation.wasp
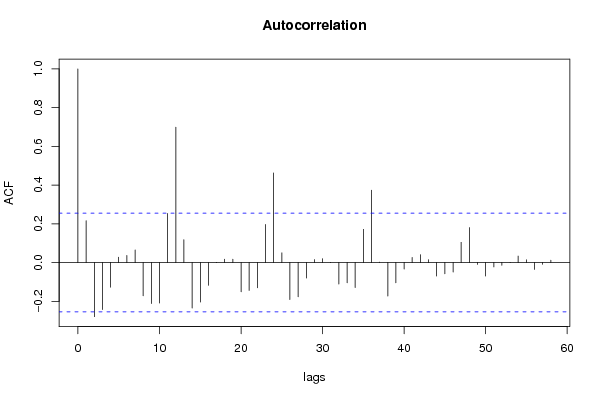
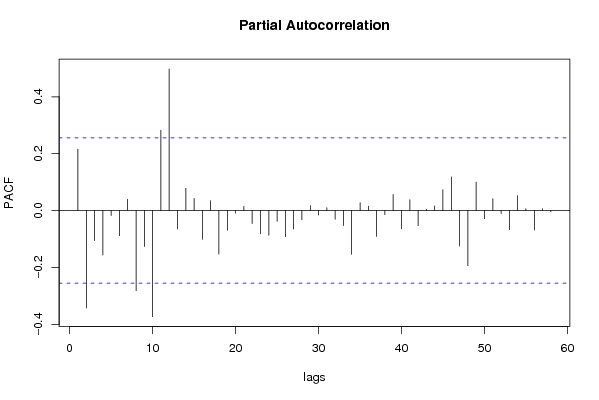
Title produced by software(Partial) Autocorrelation Function
Date of computationFri, 05 Dec 2008 03:05:41 -0700
Cite this page as followsStatistical Computations at FreeStatistics.org, Office for Research Development and Education, URL https://freestatistics.org/blog/index.php?v=date/2008/Dec/05/t1228471588xwd7stmkwe6l7hy.htm/, Retrieved Thu, 16 May 2024 06:51:41 +0000
Statistical Computations at FreeStatistics.org, Office for Research Development and Education, URL https://freestatistics.org/blog/index.php?pk=29117, Retrieved Thu, 16 May 2024 06:51:41 +0000
QR Codes:

Original text written by user:
IsPrivate?No (this computation is public)
User-defined keywords
Estimated Impact190
Family? (F = Feedback message, R = changed R code, M = changed R Module, P = changed Parameters, D = changed Data)
-     [Univariate Data Series] [Werkloosheid VLAA...] [2008-10-19 10:39:43] [46c5a5fbda57fdfa1d4ef48658f82a0c]
- RMP     [(Partial) Autocorrelation Function] [Taak 8 - Step 3 A...] [2008-12-05 10:05:41] [b23db733701c4d62df5e228d507c1c6a] [Current]
Feedback Forum

Post a new message
Dataseries X:
217859
208679
213188
216234
213587
209465
204045
200237
203666
241476
260307
243324
244460
233575
237217
235243
230354
227184
221678
217142
219452
256446
265845
248624
241114
229245
231805
219277
219313
212610
214771
211142
211457
240048
240636
230580
208795
197922
194596
194581
185686
178106
172608
167302
168053
202300
202388
182516
173476
166444
171297
169701
164182
161914
159612
151001
158114
186530
187069
174330


Summary of computational transaction
Raw Inputview raw input (R code)
Raw Outputview raw output of R engine
Computing time2 seconds
R Server'Sir Ronald Aylmer Fisher' @ 193.190.124.24

\begin{tabular}{lllllllll}
\hline
Summary of computational transaction \tabularnewline
Raw Input & view raw input (R code)  \tabularnewline
Raw Output & view raw output of R engine  \tabularnewline
Computing time & 2 seconds \tabularnewline
R Server & 'Sir Ronald Aylmer Fisher' @ 193.190.124.24 \tabularnewline
\hline
\end{tabular}
%Source: https://freestatistics.org/blog/index.php?pk=29117&T=0

[TABLE]
[ROW][C]Summary of computational transaction[/C][/ROW]
[ROW][C]Raw Input[/C][C]view raw input (R code) [/C][/ROW]
[ROW][C]Raw Output[/C][C]view raw output of R engine [/C][/ROW]
[ROW][C]Computing time[/C][C]2 seconds[/C][/ROW]
[ROW][C]R Server[/C][C]'Sir Ronald Aylmer Fisher' @ 193.190.124.24[/C][/ROW]
[/TABLE]
Source: https://freestatistics.org/blog/index.php?pk=29117&T=0

Globally Unique Identifier (entire table): ba.freestatistics.org/blog/index.php?pk=29117&T=0

As an alternative you can also use a QR Code:  

The GUIDs for individual cells are displayed in the table below:

Summary of computational transaction
Raw Inputview raw input (R code)
Raw Outputview raw output of R engine
Computing time2 seconds
R Server'Sir Ronald Aylmer Fisher' @ 193.190.124.24


Autocorrelation Function
Time lag kACF(k)T-STATP-value
10.2156011.65610.05151
2-0.279489-2.14680.017966
3-0.243122-1.86750.033404
4-0.126998-0.97550.16665
50.0278330.21380.415723
60.0363730.27940.390462
70.0649750.49910.309787
8-0.171899-1.32040.095904
9-0.211541-1.62490.05476
10-0.208935-1.60490.056932
110.2531451.94440.028307
120.6991235.37011e-06
130.1174440.90210.185334
14-0.235385-1.8080.03785
15-0.20382-1.56560.061399
16-0.117619-0.90350.18498
17-0.000638-0.00490.498053
180.0176580.13560.446287
190.0173760.13350.447138
20-0.151415-1.1630.124748
21-0.143888-1.10520.136775
22-0.130464-1.00210.160191
230.1967371.51120.068042
240.4630663.55690.000374
250.0502490.3860.350454
26-0.191158-1.46830.073665
27-0.177023-1.35970.089543
28-0.079624-0.61160.271574
290.0152790.11740.453487
300.0200340.15390.439113
31-0.000725-0.00560.497789
32-0.110551-0.84920.199613
33-0.104869-0.80550.211879
34-0.129165-0.99210.162592
350.1714511.31690.096476
360.3735852.86960.002848
370.0010250.00790.496873
38-0.172798-1.32730.094764
39-0.104695-0.80420.212262
40-0.033395-0.25650.399223
410.026280.20190.420361
420.0400280.30750.379786
430.0144190.11080.456093
44-0.06961-0.53470.297438
45-0.058456-0.4490.327534
46-0.048558-0.3730.35525
470.1042470.80070.213249
480.1805641.38690.085339
49-0.009681-0.07440.470488
50-0.06946-0.53350.297835
51-0.022493-0.17280.431712
52-0.013823-0.10620.457902
53-0.000206-0.00160.499373
540.0333310.2560.399414
550.0138660.10650.457771
56-0.035387-0.27180.393357
57-0.008994-0.06910.472577
580.0121930.09370.462848
59NANANA
60NANANA

\begin{tabular}{lllllllll}
\hline
Autocorrelation Function \tabularnewline
Time lag k & ACF(k) & T-STAT & P-value \tabularnewline
1 & 0.215601 & 1.6561 & 0.05151 \tabularnewline
2 & -0.279489 & -2.1468 & 0.017966 \tabularnewline
3 & -0.243122 & -1.8675 & 0.033404 \tabularnewline
4 & -0.126998 & -0.9755 & 0.16665 \tabularnewline
5 & 0.027833 & 0.2138 & 0.415723 \tabularnewline
6 & 0.036373 & 0.2794 & 0.390462 \tabularnewline
7 & 0.064975 & 0.4991 & 0.309787 \tabularnewline
8 & -0.171899 & -1.3204 & 0.095904 \tabularnewline
9 & -0.211541 & -1.6249 & 0.05476 \tabularnewline
10 & -0.208935 & -1.6049 & 0.056932 \tabularnewline
11 & 0.253145 & 1.9444 & 0.028307 \tabularnewline
12 & 0.699123 & 5.3701 & 1e-06 \tabularnewline
13 & 0.117444 & 0.9021 & 0.185334 \tabularnewline
14 & -0.235385 & -1.808 & 0.03785 \tabularnewline
15 & -0.20382 & -1.5656 & 0.061399 \tabularnewline
16 & -0.117619 & -0.9035 & 0.18498 \tabularnewline
17 & -0.000638 & -0.0049 & 0.498053 \tabularnewline
18 & 0.017658 & 0.1356 & 0.446287 \tabularnewline
19 & 0.017376 & 0.1335 & 0.447138 \tabularnewline
20 & -0.151415 & -1.163 & 0.124748 \tabularnewline
21 & -0.143888 & -1.1052 & 0.136775 \tabularnewline
22 & -0.130464 & -1.0021 & 0.160191 \tabularnewline
23 & 0.196737 & 1.5112 & 0.068042 \tabularnewline
24 & 0.463066 & 3.5569 & 0.000374 \tabularnewline
25 & 0.050249 & 0.386 & 0.350454 \tabularnewline
26 & -0.191158 & -1.4683 & 0.073665 \tabularnewline
27 & -0.177023 & -1.3597 & 0.089543 \tabularnewline
28 & -0.079624 & -0.6116 & 0.271574 \tabularnewline
29 & 0.015279 & 0.1174 & 0.453487 \tabularnewline
30 & 0.020034 & 0.1539 & 0.439113 \tabularnewline
31 & -0.000725 & -0.0056 & 0.497789 \tabularnewline
32 & -0.110551 & -0.8492 & 0.199613 \tabularnewline
33 & -0.104869 & -0.8055 & 0.211879 \tabularnewline
34 & -0.129165 & -0.9921 & 0.162592 \tabularnewline
35 & 0.171451 & 1.3169 & 0.096476 \tabularnewline
36 & 0.373585 & 2.8696 & 0.002848 \tabularnewline
37 & 0.001025 & 0.0079 & 0.496873 \tabularnewline
38 & -0.172798 & -1.3273 & 0.094764 \tabularnewline
39 & -0.104695 & -0.8042 & 0.212262 \tabularnewline
40 & -0.033395 & -0.2565 & 0.399223 \tabularnewline
41 & 0.02628 & 0.2019 & 0.420361 \tabularnewline
42 & 0.040028 & 0.3075 & 0.379786 \tabularnewline
43 & 0.014419 & 0.1108 & 0.456093 \tabularnewline
44 & -0.06961 & -0.5347 & 0.297438 \tabularnewline
45 & -0.058456 & -0.449 & 0.327534 \tabularnewline
46 & -0.048558 & -0.373 & 0.35525 \tabularnewline
47 & 0.104247 & 0.8007 & 0.213249 \tabularnewline
48 & 0.180564 & 1.3869 & 0.085339 \tabularnewline
49 & -0.009681 & -0.0744 & 0.470488 \tabularnewline
50 & -0.06946 & -0.5335 & 0.297835 \tabularnewline
51 & -0.022493 & -0.1728 & 0.431712 \tabularnewline
52 & -0.013823 & -0.1062 & 0.457902 \tabularnewline
53 & -0.000206 & -0.0016 & 0.499373 \tabularnewline
54 & 0.033331 & 0.256 & 0.399414 \tabularnewline
55 & 0.013866 & 0.1065 & 0.457771 \tabularnewline
56 & -0.035387 & -0.2718 & 0.393357 \tabularnewline
57 & -0.008994 & -0.0691 & 0.472577 \tabularnewline
58 & 0.012193 & 0.0937 & 0.462848 \tabularnewline
59 & NA & NA & NA \tabularnewline
60 & NA & NA & NA \tabularnewline
\hline
\end{tabular}
%Source: https://freestatistics.org/blog/index.php?pk=29117&T=1

[TABLE]
[ROW][C]Autocorrelation Function[/C][/ROW]
[ROW][C]Time lag k[/C][C]ACF(k)[/C][C]T-STAT[/C][C]P-value[/C][/ROW]
[ROW][C]1[/C][C]0.215601[/C][C]1.6561[/C][C]0.05151[/C][/ROW]
[ROW][C]2[/C][C]-0.279489[/C][C]-2.1468[/C][C]0.017966[/C][/ROW]
[ROW][C]3[/C][C]-0.243122[/C][C]-1.8675[/C][C]0.033404[/C][/ROW]
[ROW][C]4[/C][C]-0.126998[/C][C]-0.9755[/C][C]0.16665[/C][/ROW]
[ROW][C]5[/C][C]0.027833[/C][C]0.2138[/C][C]0.415723[/C][/ROW]
[ROW][C]6[/C][C]0.036373[/C][C]0.2794[/C][C]0.390462[/C][/ROW]
[ROW][C]7[/C][C]0.064975[/C][C]0.4991[/C][C]0.309787[/C][/ROW]
[ROW][C]8[/C][C]-0.171899[/C][C]-1.3204[/C][C]0.095904[/C][/ROW]
[ROW][C]9[/C][C]-0.211541[/C][C]-1.6249[/C][C]0.05476[/C][/ROW]
[ROW][C]10[/C][C]-0.208935[/C][C]-1.6049[/C][C]0.056932[/C][/ROW]
[ROW][C]11[/C][C]0.253145[/C][C]1.9444[/C][C]0.028307[/C][/ROW]
[ROW][C]12[/C][C]0.699123[/C][C]5.3701[/C][C]1e-06[/C][/ROW]
[ROW][C]13[/C][C]0.117444[/C][C]0.9021[/C][C]0.185334[/C][/ROW]
[ROW][C]14[/C][C]-0.235385[/C][C]-1.808[/C][C]0.03785[/C][/ROW]
[ROW][C]15[/C][C]-0.20382[/C][C]-1.5656[/C][C]0.061399[/C][/ROW]
[ROW][C]16[/C][C]-0.117619[/C][C]-0.9035[/C][C]0.18498[/C][/ROW]
[ROW][C]17[/C][C]-0.000638[/C][C]-0.0049[/C][C]0.498053[/C][/ROW]
[ROW][C]18[/C][C]0.017658[/C][C]0.1356[/C][C]0.446287[/C][/ROW]
[ROW][C]19[/C][C]0.017376[/C][C]0.1335[/C][C]0.447138[/C][/ROW]
[ROW][C]20[/C][C]-0.151415[/C][C]-1.163[/C][C]0.124748[/C][/ROW]
[ROW][C]21[/C][C]-0.143888[/C][C]-1.1052[/C][C]0.136775[/C][/ROW]
[ROW][C]22[/C][C]-0.130464[/C][C]-1.0021[/C][C]0.160191[/C][/ROW]
[ROW][C]23[/C][C]0.196737[/C][C]1.5112[/C][C]0.068042[/C][/ROW]
[ROW][C]24[/C][C]0.463066[/C][C]3.5569[/C][C]0.000374[/C][/ROW]
[ROW][C]25[/C][C]0.050249[/C][C]0.386[/C][C]0.350454[/C][/ROW]
[ROW][C]26[/C][C]-0.191158[/C][C]-1.4683[/C][C]0.073665[/C][/ROW]
[ROW][C]27[/C][C]-0.177023[/C][C]-1.3597[/C][C]0.089543[/C][/ROW]
[ROW][C]28[/C][C]-0.079624[/C][C]-0.6116[/C][C]0.271574[/C][/ROW]
[ROW][C]29[/C][C]0.015279[/C][C]0.1174[/C][C]0.453487[/C][/ROW]
[ROW][C]30[/C][C]0.020034[/C][C]0.1539[/C][C]0.439113[/C][/ROW]
[ROW][C]31[/C][C]-0.000725[/C][C]-0.0056[/C][C]0.497789[/C][/ROW]
[ROW][C]32[/C][C]-0.110551[/C][C]-0.8492[/C][C]0.199613[/C][/ROW]
[ROW][C]33[/C][C]-0.104869[/C][C]-0.8055[/C][C]0.211879[/C][/ROW]
[ROW][C]34[/C][C]-0.129165[/C][C]-0.9921[/C][C]0.162592[/C][/ROW]
[ROW][C]35[/C][C]0.171451[/C][C]1.3169[/C][C]0.096476[/C][/ROW]
[ROW][C]36[/C][C]0.373585[/C][C]2.8696[/C][C]0.002848[/C][/ROW]
[ROW][C]37[/C][C]0.001025[/C][C]0.0079[/C][C]0.496873[/C][/ROW]
[ROW][C]38[/C][C]-0.172798[/C][C]-1.3273[/C][C]0.094764[/C][/ROW]
[ROW][C]39[/C][C]-0.104695[/C][C]-0.8042[/C][C]0.212262[/C][/ROW]
[ROW][C]40[/C][C]-0.033395[/C][C]-0.2565[/C][C]0.399223[/C][/ROW]
[ROW][C]41[/C][C]0.02628[/C][C]0.2019[/C][C]0.420361[/C][/ROW]
[ROW][C]42[/C][C]0.040028[/C][C]0.3075[/C][C]0.379786[/C][/ROW]
[ROW][C]43[/C][C]0.014419[/C][C]0.1108[/C][C]0.456093[/C][/ROW]
[ROW][C]44[/C][C]-0.06961[/C][C]-0.5347[/C][C]0.297438[/C][/ROW]
[ROW][C]45[/C][C]-0.058456[/C][C]-0.449[/C][C]0.327534[/C][/ROW]
[ROW][C]46[/C][C]-0.048558[/C][C]-0.373[/C][C]0.35525[/C][/ROW]
[ROW][C]47[/C][C]0.104247[/C][C]0.8007[/C][C]0.213249[/C][/ROW]
[ROW][C]48[/C][C]0.180564[/C][C]1.3869[/C][C]0.085339[/C][/ROW]
[ROW][C]49[/C][C]-0.009681[/C][C]-0.0744[/C][C]0.470488[/C][/ROW]
[ROW][C]50[/C][C]-0.06946[/C][C]-0.5335[/C][C]0.297835[/C][/ROW]
[ROW][C]51[/C][C]-0.022493[/C][C]-0.1728[/C][C]0.431712[/C][/ROW]
[ROW][C]52[/C][C]-0.013823[/C][C]-0.1062[/C][C]0.457902[/C][/ROW]
[ROW][C]53[/C][C]-0.000206[/C][C]-0.0016[/C][C]0.499373[/C][/ROW]
[ROW][C]54[/C][C]0.033331[/C][C]0.256[/C][C]0.399414[/C][/ROW]
[ROW][C]55[/C][C]0.013866[/C][C]0.1065[/C][C]0.457771[/C][/ROW]
[ROW][C]56[/C][C]-0.035387[/C][C]-0.2718[/C][C]0.393357[/C][/ROW]
[ROW][C]57[/C][C]-0.008994[/C][C]-0.0691[/C][C]0.472577[/C][/ROW]
[ROW][C]58[/C][C]0.012193[/C][C]0.0937[/C][C]0.462848[/C][/ROW]
[ROW][C]59[/C][C]NA[/C][C]NA[/C][C]NA[/C][/ROW]
[ROW][C]60[/C][C]NA[/C][C]NA[/C][C]NA[/C][/ROW]
[/TABLE]
Source: https://freestatistics.org/blog/index.php?pk=29117&T=1

Globally Unique Identifier (entire table): ba.freestatistics.org/blog/index.php?pk=29117&T=1

As an alternative you can also use a QR Code:  

The GUIDs for individual cells are displayed in the table below:

Autocorrelation Function
Time lag kACF(k)T-STATP-value
10.2156011.65610.05151
2-0.279489-2.14680.017966
3-0.243122-1.86750.033404
4-0.126998-0.97550.16665
50.0278330.21380.415723
60.0363730.27940.390462
70.0649750.49910.309787
8-0.171899-1.32040.095904
9-0.211541-1.62490.05476
10-0.208935-1.60490.056932
110.2531451.94440.028307
120.6991235.37011e-06
130.1174440.90210.185334
14-0.235385-1.8080.03785
15-0.20382-1.56560.061399
16-0.117619-0.90350.18498
17-0.000638-0.00490.498053
180.0176580.13560.446287
190.0173760.13350.447138
20-0.151415-1.1630.124748
21-0.143888-1.10520.136775
22-0.130464-1.00210.160191
230.1967371.51120.068042
240.4630663.55690.000374
250.0502490.3860.350454
26-0.191158-1.46830.073665
27-0.177023-1.35970.089543
28-0.079624-0.61160.271574
290.0152790.11740.453487
300.0200340.15390.439113
31-0.000725-0.00560.497789
32-0.110551-0.84920.199613
33-0.104869-0.80550.211879
34-0.129165-0.99210.162592
350.1714511.31690.096476
360.3735852.86960.002848
370.0010250.00790.496873
38-0.172798-1.32730.094764
39-0.104695-0.80420.212262
40-0.033395-0.25650.399223
410.026280.20190.420361
420.0400280.30750.379786
430.0144190.11080.456093
44-0.06961-0.53470.297438
45-0.058456-0.4490.327534
46-0.048558-0.3730.35525
470.1042470.80070.213249
480.1805641.38690.085339
49-0.009681-0.07440.470488
50-0.06946-0.53350.297835
51-0.022493-0.17280.431712
52-0.013823-0.10620.457902
53-0.000206-0.00160.499373
540.0333310.2560.399414
550.0138660.10650.457771
56-0.035387-0.27180.393357
57-0.008994-0.06910.472577
580.0121930.09370.462848
59NANANA
60NANANA


Partial Autocorrelation Function
Time lag kPACF(k)T-STATP-value
10.2156011.65610.05151
2-0.341863-2.62590.005495
3-0.105166-0.80780.211226
4-0.155832-1.1970.118053
5-0.017661-0.13570.446279
6-0.088761-0.68180.249021
70.0401140.30810.379537
8-0.28116-2.15960.017438
9-0.125947-0.96740.168642
10-0.3726-2.8620.002909
110.2826452.1710.016982
120.4976623.82260.00016
13-0.0647-0.4970.310529
140.0780970.59990.275444
150.0428820.32940.371516
16-0.100618-0.77290.221345
170.0347690.26710.395174
18-0.152814-1.17380.122598
19-0.069274-0.53210.298325
20-0.008878-0.06820.472931
210.0144430.11090.456021
22-0.045285-0.34780.364599
23-0.081192-0.62360.267631
24-0.08646-0.66410.254603
25-0.037623-0.2890.386803
26-0.091602-0.70360.242223
27-0.064727-0.49720.310456
28-0.032438-0.24920.40205
290.017050.1310.448125
30-0.015867-0.12190.451705
310.0101030.07760.469202
32-0.030374-0.23330.408166
33-0.052481-0.40310.344162
34-0.153428-1.17850.121663
350.0273990.21050.417019
360.0152860.11740.453465
37-0.090714-0.69680.244336
38-0.014346-0.11020.456315
390.0567530.43590.33224
40-0.063921-0.4910.312628
410.037930.29130.385906
42-0.052888-0.40620.343019
430.0039350.03020.487994
440.015980.12270.451365
450.0736390.56560.286895
460.118060.90680.184091
47-0.124715-0.9580.170997
48-0.193453-1.48590.071309
490.100240.770.222199
50-0.028368-0.21790.414129
510.0417410.32060.374816
52-0.010465-0.08040.468101
53-0.066964-0.51440.304462
540.0521960.40090.344961
550.0066320.05090.479772
56-0.068294-0.52460.300921
570.0071360.05480.478237
58-0.00377-0.0290.488498
59NANANA
60NANANA

\begin{tabular}{lllllllll}
\hline
Partial Autocorrelation Function \tabularnewline
Time lag k & PACF(k) & T-STAT & P-value \tabularnewline
1 & 0.215601 & 1.6561 & 0.05151 \tabularnewline
2 & -0.341863 & -2.6259 & 0.005495 \tabularnewline
3 & -0.105166 & -0.8078 & 0.211226 \tabularnewline
4 & -0.155832 & -1.197 & 0.118053 \tabularnewline
5 & -0.017661 & -0.1357 & 0.446279 \tabularnewline
6 & -0.088761 & -0.6818 & 0.249021 \tabularnewline
7 & 0.040114 & 0.3081 & 0.379537 \tabularnewline
8 & -0.28116 & -2.1596 & 0.017438 \tabularnewline
9 & -0.125947 & -0.9674 & 0.168642 \tabularnewline
10 & -0.3726 & -2.862 & 0.002909 \tabularnewline
11 & 0.282645 & 2.171 & 0.016982 \tabularnewline
12 & 0.497662 & 3.8226 & 0.00016 \tabularnewline
13 & -0.0647 & -0.497 & 0.310529 \tabularnewline
14 & 0.078097 & 0.5999 & 0.275444 \tabularnewline
15 & 0.042882 & 0.3294 & 0.371516 \tabularnewline
16 & -0.100618 & -0.7729 & 0.221345 \tabularnewline
17 & 0.034769 & 0.2671 & 0.395174 \tabularnewline
18 & -0.152814 & -1.1738 & 0.122598 \tabularnewline
19 & -0.069274 & -0.5321 & 0.298325 \tabularnewline
20 & -0.008878 & -0.0682 & 0.472931 \tabularnewline
21 & 0.014443 & 0.1109 & 0.456021 \tabularnewline
22 & -0.045285 & -0.3478 & 0.364599 \tabularnewline
23 & -0.081192 & -0.6236 & 0.267631 \tabularnewline
24 & -0.08646 & -0.6641 & 0.254603 \tabularnewline
25 & -0.037623 & -0.289 & 0.386803 \tabularnewline
26 & -0.091602 & -0.7036 & 0.242223 \tabularnewline
27 & -0.064727 & -0.4972 & 0.310456 \tabularnewline
28 & -0.032438 & -0.2492 & 0.40205 \tabularnewline
29 & 0.01705 & 0.131 & 0.448125 \tabularnewline
30 & -0.015867 & -0.1219 & 0.451705 \tabularnewline
31 & 0.010103 & 0.0776 & 0.469202 \tabularnewline
32 & -0.030374 & -0.2333 & 0.408166 \tabularnewline
33 & -0.052481 & -0.4031 & 0.344162 \tabularnewline
34 & -0.153428 & -1.1785 & 0.121663 \tabularnewline
35 & 0.027399 & 0.2105 & 0.417019 \tabularnewline
36 & 0.015286 & 0.1174 & 0.453465 \tabularnewline
37 & -0.090714 & -0.6968 & 0.244336 \tabularnewline
38 & -0.014346 & -0.1102 & 0.456315 \tabularnewline
39 & 0.056753 & 0.4359 & 0.33224 \tabularnewline
40 & -0.063921 & -0.491 & 0.312628 \tabularnewline
41 & 0.03793 & 0.2913 & 0.385906 \tabularnewline
42 & -0.052888 & -0.4062 & 0.343019 \tabularnewline
43 & 0.003935 & 0.0302 & 0.487994 \tabularnewline
44 & 0.01598 & 0.1227 & 0.451365 \tabularnewline
45 & 0.073639 & 0.5656 & 0.286895 \tabularnewline
46 & 0.11806 & 0.9068 & 0.184091 \tabularnewline
47 & -0.124715 & -0.958 & 0.170997 \tabularnewline
48 & -0.193453 & -1.4859 & 0.071309 \tabularnewline
49 & 0.10024 & 0.77 & 0.222199 \tabularnewline
50 & -0.028368 & -0.2179 & 0.414129 \tabularnewline
51 & 0.041741 & 0.3206 & 0.374816 \tabularnewline
52 & -0.010465 & -0.0804 & 0.468101 \tabularnewline
53 & -0.066964 & -0.5144 & 0.304462 \tabularnewline
54 & 0.052196 & 0.4009 & 0.344961 \tabularnewline
55 & 0.006632 & 0.0509 & 0.479772 \tabularnewline
56 & -0.068294 & -0.5246 & 0.300921 \tabularnewline
57 & 0.007136 & 0.0548 & 0.478237 \tabularnewline
58 & -0.00377 & -0.029 & 0.488498 \tabularnewline
59 & NA & NA & NA \tabularnewline
60 & NA & NA & NA \tabularnewline
\hline
\end{tabular}
%Source: https://freestatistics.org/blog/index.php?pk=29117&T=2

[TABLE]
[ROW][C]Partial Autocorrelation Function[/C][/ROW]
[ROW][C]Time lag k[/C][C]PACF(k)[/C][C]T-STAT[/C][C]P-value[/C][/ROW]
[ROW][C]1[/C][C]0.215601[/C][C]1.6561[/C][C]0.05151[/C][/ROW]
[ROW][C]2[/C][C]-0.341863[/C][C]-2.6259[/C][C]0.005495[/C][/ROW]
[ROW][C]3[/C][C]-0.105166[/C][C]-0.8078[/C][C]0.211226[/C][/ROW]
[ROW][C]4[/C][C]-0.155832[/C][C]-1.197[/C][C]0.118053[/C][/ROW]
[ROW][C]5[/C][C]-0.017661[/C][C]-0.1357[/C][C]0.446279[/C][/ROW]
[ROW][C]6[/C][C]-0.088761[/C][C]-0.6818[/C][C]0.249021[/C][/ROW]
[ROW][C]7[/C][C]0.040114[/C][C]0.3081[/C][C]0.379537[/C][/ROW]
[ROW][C]8[/C][C]-0.28116[/C][C]-2.1596[/C][C]0.017438[/C][/ROW]
[ROW][C]9[/C][C]-0.125947[/C][C]-0.9674[/C][C]0.168642[/C][/ROW]
[ROW][C]10[/C][C]-0.3726[/C][C]-2.862[/C][C]0.002909[/C][/ROW]
[ROW][C]11[/C][C]0.282645[/C][C]2.171[/C][C]0.016982[/C][/ROW]
[ROW][C]12[/C][C]0.497662[/C][C]3.8226[/C][C]0.00016[/C][/ROW]
[ROW][C]13[/C][C]-0.0647[/C][C]-0.497[/C][C]0.310529[/C][/ROW]
[ROW][C]14[/C][C]0.078097[/C][C]0.5999[/C][C]0.275444[/C][/ROW]
[ROW][C]15[/C][C]0.042882[/C][C]0.3294[/C][C]0.371516[/C][/ROW]
[ROW][C]16[/C][C]-0.100618[/C][C]-0.7729[/C][C]0.221345[/C][/ROW]
[ROW][C]17[/C][C]0.034769[/C][C]0.2671[/C][C]0.395174[/C][/ROW]
[ROW][C]18[/C][C]-0.152814[/C][C]-1.1738[/C][C]0.122598[/C][/ROW]
[ROW][C]19[/C][C]-0.069274[/C][C]-0.5321[/C][C]0.298325[/C][/ROW]
[ROW][C]20[/C][C]-0.008878[/C][C]-0.0682[/C][C]0.472931[/C][/ROW]
[ROW][C]21[/C][C]0.014443[/C][C]0.1109[/C][C]0.456021[/C][/ROW]
[ROW][C]22[/C][C]-0.045285[/C][C]-0.3478[/C][C]0.364599[/C][/ROW]
[ROW][C]23[/C][C]-0.081192[/C][C]-0.6236[/C][C]0.267631[/C][/ROW]
[ROW][C]24[/C][C]-0.08646[/C][C]-0.6641[/C][C]0.254603[/C][/ROW]
[ROW][C]25[/C][C]-0.037623[/C][C]-0.289[/C][C]0.386803[/C][/ROW]
[ROW][C]26[/C][C]-0.091602[/C][C]-0.7036[/C][C]0.242223[/C][/ROW]
[ROW][C]27[/C][C]-0.064727[/C][C]-0.4972[/C][C]0.310456[/C][/ROW]
[ROW][C]28[/C][C]-0.032438[/C][C]-0.2492[/C][C]0.40205[/C][/ROW]
[ROW][C]29[/C][C]0.01705[/C][C]0.131[/C][C]0.448125[/C][/ROW]
[ROW][C]30[/C][C]-0.015867[/C][C]-0.1219[/C][C]0.451705[/C][/ROW]
[ROW][C]31[/C][C]0.010103[/C][C]0.0776[/C][C]0.469202[/C][/ROW]
[ROW][C]32[/C][C]-0.030374[/C][C]-0.2333[/C][C]0.408166[/C][/ROW]
[ROW][C]33[/C][C]-0.052481[/C][C]-0.4031[/C][C]0.344162[/C][/ROW]
[ROW][C]34[/C][C]-0.153428[/C][C]-1.1785[/C][C]0.121663[/C][/ROW]
[ROW][C]35[/C][C]0.027399[/C][C]0.2105[/C][C]0.417019[/C][/ROW]
[ROW][C]36[/C][C]0.015286[/C][C]0.1174[/C][C]0.453465[/C][/ROW]
[ROW][C]37[/C][C]-0.090714[/C][C]-0.6968[/C][C]0.244336[/C][/ROW]
[ROW][C]38[/C][C]-0.014346[/C][C]-0.1102[/C][C]0.456315[/C][/ROW]
[ROW][C]39[/C][C]0.056753[/C][C]0.4359[/C][C]0.33224[/C][/ROW]
[ROW][C]40[/C][C]-0.063921[/C][C]-0.491[/C][C]0.312628[/C][/ROW]
[ROW][C]41[/C][C]0.03793[/C][C]0.2913[/C][C]0.385906[/C][/ROW]
[ROW][C]42[/C][C]-0.052888[/C][C]-0.4062[/C][C]0.343019[/C][/ROW]
[ROW][C]43[/C][C]0.003935[/C][C]0.0302[/C][C]0.487994[/C][/ROW]
[ROW][C]44[/C][C]0.01598[/C][C]0.1227[/C][C]0.451365[/C][/ROW]
[ROW][C]45[/C][C]0.073639[/C][C]0.5656[/C][C]0.286895[/C][/ROW]
[ROW][C]46[/C][C]0.11806[/C][C]0.9068[/C][C]0.184091[/C][/ROW]
[ROW][C]47[/C][C]-0.124715[/C][C]-0.958[/C][C]0.170997[/C][/ROW]
[ROW][C]48[/C][C]-0.193453[/C][C]-1.4859[/C][C]0.071309[/C][/ROW]
[ROW][C]49[/C][C]0.10024[/C][C]0.77[/C][C]0.222199[/C][/ROW]
[ROW][C]50[/C][C]-0.028368[/C][C]-0.2179[/C][C]0.414129[/C][/ROW]
[ROW][C]51[/C][C]0.041741[/C][C]0.3206[/C][C]0.374816[/C][/ROW]
[ROW][C]52[/C][C]-0.010465[/C][C]-0.0804[/C][C]0.468101[/C][/ROW]
[ROW][C]53[/C][C]-0.066964[/C][C]-0.5144[/C][C]0.304462[/C][/ROW]
[ROW][C]54[/C][C]0.052196[/C][C]0.4009[/C][C]0.344961[/C][/ROW]
[ROW][C]55[/C][C]0.006632[/C][C]0.0509[/C][C]0.479772[/C][/ROW]
[ROW][C]56[/C][C]-0.068294[/C][C]-0.5246[/C][C]0.300921[/C][/ROW]
[ROW][C]57[/C][C]0.007136[/C][C]0.0548[/C][C]0.478237[/C][/ROW]
[ROW][C]58[/C][C]-0.00377[/C][C]-0.029[/C][C]0.488498[/C][/ROW]
[ROW][C]59[/C][C]NA[/C][C]NA[/C][C]NA[/C][/ROW]
[ROW][C]60[/C][C]NA[/C][C]NA[/C][C]NA[/C][/ROW]
[/TABLE]
Source: https://freestatistics.org/blog/index.php?pk=29117&T=2

Globally Unique Identifier (entire table): ba.freestatistics.org/blog/index.php?pk=29117&T=2

As an alternative you can also use a QR Code:  

The GUIDs for individual cells are displayed in the table below:

Partial Autocorrelation Function
Time lag kPACF(k)T-STATP-value
10.2156011.65610.05151
2-0.341863-2.62590.005495
3-0.105166-0.80780.211226
4-0.155832-1.1970.118053
5-0.017661-0.13570.446279
6-0.088761-0.68180.249021
70.0401140.30810.379537
8-0.28116-2.15960.017438
9-0.125947-0.96740.168642
10-0.3726-2.8620.002909
110.2826452.1710.016982
120.4976623.82260.00016
13-0.0647-0.4970.310529
140.0780970.59990.275444
150.0428820.32940.371516
16-0.100618-0.77290.221345
170.0347690.26710.395174
18-0.152814-1.17380.122598
19-0.069274-0.53210.298325
20-0.008878-0.06820.472931
210.0144430.11090.456021
22-0.045285-0.34780.364599
23-0.081192-0.62360.267631
24-0.08646-0.66410.254603
25-0.037623-0.2890.386803
26-0.091602-0.70360.242223
27-0.064727-0.49720.310456
28-0.032438-0.24920.40205
290.017050.1310.448125
30-0.015867-0.12190.451705
310.0101030.07760.469202
32-0.030374-0.23330.408166
33-0.052481-0.40310.344162
34-0.153428-1.17850.121663
350.0273990.21050.417019
360.0152860.11740.453465
37-0.090714-0.69680.244336
38-0.014346-0.11020.456315
390.0567530.43590.33224
40-0.063921-0.4910.312628
410.037930.29130.385906
42-0.052888-0.40620.343019
430.0039350.03020.487994
440.015980.12270.451365
450.0736390.56560.286895
460.118060.90680.184091
47-0.124715-0.9580.170997
48-0.193453-1.48590.071309
490.100240.770.222199
50-0.028368-0.21790.414129
510.0417410.32060.374816
52-0.010465-0.08040.468101
53-0.066964-0.51440.304462
540.0521960.40090.344961
550.0066320.05090.479772
56-0.068294-0.52460.300921
570.0071360.05480.478237
58-0.00377-0.0290.488498
59NANANA
60NANANA


Parameters (Session):
par1 = 36 ; par2 = 1.2 ; par3 = 1 ; par4 = 1 ; par5 = 12 ;
Parameters (R input):
par1 = 60 ; par2 = 0.2 ; par3 = 1 ; par4 = 0 ; par5 = 12 ;
R code (references can be found in the software module):
if (par1 == 'Default') {
par1 = 10*log10(length(x))
} else {
par1 <- as.numeric(par1)
}
par2 <- as.numeric(par2)
par3 <- as.numeric(par3)
par4 <- as.numeric(par4)
par5 <- as.numeric(par5)
if (par2 == 0) {
x <- log(x)
} else {
x <- (x ^ par2 - 1) / par2
}
if (par3 > 0) x <- diff(x,lag=1,difference=par3)
if (par4 > 0) x <- diff(x,lag=par5,difference=par4)
bitmap(file='pic1.png')
racf <- acf(x,par1,main='Autocorrelation',xlab='lags',ylab='ACF')
dev.off()
bitmap(file='pic2.png')
rpacf <- pacf(x,par1,main='Partial Autocorrelation',xlab='lags',ylab='PACF')
dev.off()
(myacf <- c(racf$acf))
(mypacf <- c(rpacf$acf))
lengthx <- length(x)
sqrtn <- sqrt(lengthx)
load(file='createtable')
a<-table.start()
a<-table.row.start(a)
a<-table.element(a,'Autocorrelation Function',4,TRUE)
a<-table.row.end(a)
a<-table.row.start(a)
a<-table.element(a,'Time lag k',header=TRUE)
a<-table.element(a,hyperlink('basics.htm','ACF(k)','click here for more information about the Autocorrelation Function'),header=TRUE)
a<-table.element(a,'T-STAT',header=TRUE)
a<-table.element(a,'P-value',header=TRUE)
a<-table.row.end(a)
for (i in 2:(par1+1)) {
a<-table.row.start(a)
a<-table.element(a,i-1,header=TRUE)
a<-table.element(a,round(myacf[i],6))
mytstat <- myacf[i]*sqrtn
a<-table.element(a,round(mytstat,4))
a<-table.element(a,round(1-pt(abs(mytstat),lengthx),6))
a<-table.row.end(a)
}
a<-table.end(a)
table.save(a,file='mytable.tab')
a<-table.start()
a<-table.row.start(a)
a<-table.element(a,'Partial Autocorrelation Function',4,TRUE)
a<-table.row.end(a)
a<-table.row.start(a)
a<-table.element(a,'Time lag k',header=TRUE)
a<-table.element(a,hyperlink('basics.htm','PACF(k)','click here for more information about the Partial Autocorrelation Function'),header=TRUE)
a<-table.element(a,'T-STAT',header=TRUE)
a<-table.element(a,'P-value',header=TRUE)
a<-table.row.end(a)
for (i in 1:par1) {
a<-table.row.start(a)
a<-table.element(a,i,header=TRUE)
a<-table.element(a,round(mypacf[i],6))
mytstat <- mypacf[i]*sqrtn
a<-table.element(a,round(mytstat,4))
a<-table.element(a,round(1-pt(abs(mytstat),lengthx),6))
a<-table.row.end(a)
}
a<-table.end(a)
table.save(a,file='mytable1.tab')