Free Statistics

of Irreproducible Research!

Author's title

Koers euro-dollar - autocorrelatie non-seasonal differencing=1 - Spillemaec...

Author*Unverified author*
R Software Modulerwasp_autocorrelation.wasp
Title produced by software(Partial) Autocorrelation Function
Date of computationFri, 05 Dec 2008 03:00:53 -0700
Cite this page as followsStatistical Computations at FreeStatistics.org, Office for Research Development and Education, URL https://freestatistics.org/blog/index.php?v=date/2008/Dec/05/t1228471423u7e87uw4pe40plz.htm/, Retrieved Thu, 16 May 2024 23:48:50 +0000
Statistical Computations at FreeStatistics.org, Office for Research Development and Education, URL https://freestatistics.org/blog/index.php?pk=29113, Retrieved Thu, 16 May 2024 23:48:50 +0000
QR Codes:

Original text written by user:
IsPrivate?No (this computation is public)
User-defined keywords
Estimated Impact185
Family? (F = Feedback message, R = changed R code, M = changed R Module, P = changed Parameters, D = changed Data)
-       [(Partial) Autocorrelation Function] [Koers euro-dollar...] [2008-12-05 10:00:53] [d41d8cd98f00b204e9800998ecf8427e] [Current]
Feedback Forum

Post a new message
Dataseries X:
0.9808
0.9811
1.0014
1.0183
1.0622
1.0773
1.0807
1.0848
1.1582
1.1663
1.1372
1.1139
1.1222
1.1692
1.1702
1.2286
1.2613
1.2646
1.2262
1.1985
1.2007
1.2138
1.2266
1.2176
1.2218
1.249
1.2991
1.3408
1.3119
1.3014
1.3201
1.2938
1.2694
1.2165
1.2037
1.2292
1.2256
1.2015
1.1786
1.1856
1.2103
1.1938
1.202
1.2271
1.277
1.265
1.2684
1.2811
1.2727
1.2611
1.2881
1.3213
1.2999
1.3074
1.3242
1.3516
1.3511
1.3419
1.3716
1.3622
1.3896
1.4227
1.4684
1.457
1.4718
1.4748
1.5527
1.575
1.5557
1.5553
1.577
1.4975


Summary of computational transaction
Raw Inputview raw input (R code)
Raw Outputview raw output of R engine
Computing time1 seconds
R Server'Gwilym Jenkins' @ 72.249.127.135

\begin{tabular}{lllllllll}
\hline
Summary of computational transaction \tabularnewline
Raw Input & view raw input (R code)  \tabularnewline
Raw Output & view raw output of R engine  \tabularnewline
Computing time & 1 seconds \tabularnewline
R Server & 'Gwilym Jenkins' @ 72.249.127.135 \tabularnewline
\hline
\end{tabular}
%Source: https://freestatistics.org/blog/index.php?pk=29113&T=0

[TABLE]
[ROW][C]Summary of computational transaction[/C][/ROW]
[ROW][C]Raw Input[/C][C]view raw input (R code) [/C][/ROW]
[ROW][C]Raw Output[/C][C]view raw output of R engine [/C][/ROW]
[ROW][C]Computing time[/C][C]1 seconds[/C][/ROW]
[ROW][C]R Server[/C][C]'Gwilym Jenkins' @ 72.249.127.135[/C][/ROW]
[/TABLE]
Source: https://freestatistics.org/blog/index.php?pk=29113&T=0

Globally Unique Identifier (entire table): ba.freestatistics.org/blog/index.php?pk=29113&T=0

As an alternative you can also use a QR Code:  

The GUIDs for individual cells are displayed in the table below:

Summary of computational transaction
Raw Inputview raw input (R code)
Raw Outputview raw output of R engine
Computing time1 seconds
R Server'Gwilym Jenkins' @ 72.249.127.135


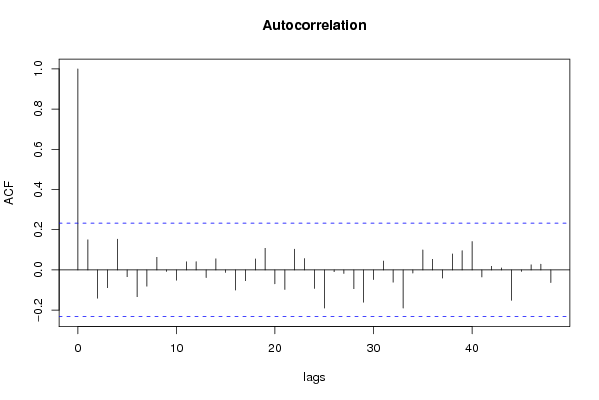
Autocorrelation Function
Time lag kACF(k)T-STATP-value
10.1496651.26110.105701
2-0.140445-1.18340.120297
3-0.088394-0.74480.229418
40.1528191.28770.101021
5-0.033765-0.28450.388425
6-0.133402-1.12410.132386
7-0.080813-0.68090.24906
80.0629570.53050.298716
9-0.007442-0.06270.475089
10-0.051147-0.4310.333898
110.0403350.33990.367479
120.0407730.34360.366096
13-0.037905-0.31940.375183
140.0549970.46340.322243
15-0.01266-0.10670.457674
16-0.100549-0.84720.199855
17-0.053882-0.4540.3256
180.0547330.46120.323038
190.1074610.90550.184136
20-0.069041-0.58170.28129
21-0.097168-0.81880.207833
220.1029150.86720.194383
230.0563830.47510.31809
24-0.091963-0.77490.220486
25-0.18959-1.59750.057297
26-0.008864-0.07470.470337
27-0.017687-0.1490.440975
28-0.093653-0.78910.216331
29-0.160379-1.35140.090432
30-0.048039-0.40480.343427
310.0443140.37340.354982
32-0.061362-0.5170.303367
33-0.189815-1.59940.057085
34-0.015996-0.13480.446581
350.09940.83760.202545
360.0527730.44470.328955
37-0.040369-0.34020.367373
380.0795710.67050.252364
390.095670.80610.211429
400.1412881.19050.118905
41-0.035023-0.29510.384387
420.0176150.14840.441212
430.0095360.08030.468093
44-0.151593-1.27730.102821
45-0.007789-0.06560.473927
460.0253610.21370.415699
470.0282580.23810.406242
48-0.063038-0.53120.298481

\begin{tabular}{lllllllll}
\hline
Autocorrelation Function \tabularnewline
Time lag k & ACF(k) & T-STAT & P-value \tabularnewline
1 & 0.149665 & 1.2611 & 0.105701 \tabularnewline
2 & -0.140445 & -1.1834 & 0.120297 \tabularnewline
3 & -0.088394 & -0.7448 & 0.229418 \tabularnewline
4 & 0.152819 & 1.2877 & 0.101021 \tabularnewline
5 & -0.033765 & -0.2845 & 0.388425 \tabularnewline
6 & -0.133402 & -1.1241 & 0.132386 \tabularnewline
7 & -0.080813 & -0.6809 & 0.24906 \tabularnewline
8 & 0.062957 & 0.5305 & 0.298716 \tabularnewline
9 & -0.007442 & -0.0627 & 0.475089 \tabularnewline
10 & -0.051147 & -0.431 & 0.333898 \tabularnewline
11 & 0.040335 & 0.3399 & 0.367479 \tabularnewline
12 & 0.040773 & 0.3436 & 0.366096 \tabularnewline
13 & -0.037905 & -0.3194 & 0.375183 \tabularnewline
14 & 0.054997 & 0.4634 & 0.322243 \tabularnewline
15 & -0.01266 & -0.1067 & 0.457674 \tabularnewline
16 & -0.100549 & -0.8472 & 0.199855 \tabularnewline
17 & -0.053882 & -0.454 & 0.3256 \tabularnewline
18 & 0.054733 & 0.4612 & 0.323038 \tabularnewline
19 & 0.107461 & 0.9055 & 0.184136 \tabularnewline
20 & -0.069041 & -0.5817 & 0.28129 \tabularnewline
21 & -0.097168 & -0.8188 & 0.207833 \tabularnewline
22 & 0.102915 & 0.8672 & 0.194383 \tabularnewline
23 & 0.056383 & 0.4751 & 0.31809 \tabularnewline
24 & -0.091963 & -0.7749 & 0.220486 \tabularnewline
25 & -0.18959 & -1.5975 & 0.057297 \tabularnewline
26 & -0.008864 & -0.0747 & 0.470337 \tabularnewline
27 & -0.017687 & -0.149 & 0.440975 \tabularnewline
28 & -0.093653 & -0.7891 & 0.216331 \tabularnewline
29 & -0.160379 & -1.3514 & 0.090432 \tabularnewline
30 & -0.048039 & -0.4048 & 0.343427 \tabularnewline
31 & 0.044314 & 0.3734 & 0.354982 \tabularnewline
32 & -0.061362 & -0.517 & 0.303367 \tabularnewline
33 & -0.189815 & -1.5994 & 0.057085 \tabularnewline
34 & -0.015996 & -0.1348 & 0.446581 \tabularnewline
35 & 0.0994 & 0.8376 & 0.202545 \tabularnewline
36 & 0.052773 & 0.4447 & 0.328955 \tabularnewline
37 & -0.040369 & -0.3402 & 0.367373 \tabularnewline
38 & 0.079571 & 0.6705 & 0.252364 \tabularnewline
39 & 0.09567 & 0.8061 & 0.211429 \tabularnewline
40 & 0.141288 & 1.1905 & 0.118905 \tabularnewline
41 & -0.035023 & -0.2951 & 0.384387 \tabularnewline
42 & 0.017615 & 0.1484 & 0.441212 \tabularnewline
43 & 0.009536 & 0.0803 & 0.468093 \tabularnewline
44 & -0.151593 & -1.2773 & 0.102821 \tabularnewline
45 & -0.007789 & -0.0656 & 0.473927 \tabularnewline
46 & 0.025361 & 0.2137 & 0.415699 \tabularnewline
47 & 0.028258 & 0.2381 & 0.406242 \tabularnewline
48 & -0.063038 & -0.5312 & 0.298481 \tabularnewline
\hline
\end{tabular}
%Source: https://freestatistics.org/blog/index.php?pk=29113&T=1

[TABLE]
[ROW][C]Autocorrelation Function[/C][/ROW]
[ROW][C]Time lag k[/C][C]ACF(k)[/C][C]T-STAT[/C][C]P-value[/C][/ROW]
[ROW][C]1[/C][C]0.149665[/C][C]1.2611[/C][C]0.105701[/C][/ROW]
[ROW][C]2[/C][C]-0.140445[/C][C]-1.1834[/C][C]0.120297[/C][/ROW]
[ROW][C]3[/C][C]-0.088394[/C][C]-0.7448[/C][C]0.229418[/C][/ROW]
[ROW][C]4[/C][C]0.152819[/C][C]1.2877[/C][C]0.101021[/C][/ROW]
[ROW][C]5[/C][C]-0.033765[/C][C]-0.2845[/C][C]0.388425[/C][/ROW]
[ROW][C]6[/C][C]-0.133402[/C][C]-1.1241[/C][C]0.132386[/C][/ROW]
[ROW][C]7[/C][C]-0.080813[/C][C]-0.6809[/C][C]0.24906[/C][/ROW]
[ROW][C]8[/C][C]0.062957[/C][C]0.5305[/C][C]0.298716[/C][/ROW]
[ROW][C]9[/C][C]-0.007442[/C][C]-0.0627[/C][C]0.475089[/C][/ROW]
[ROW][C]10[/C][C]-0.051147[/C][C]-0.431[/C][C]0.333898[/C][/ROW]
[ROW][C]11[/C][C]0.040335[/C][C]0.3399[/C][C]0.367479[/C][/ROW]
[ROW][C]12[/C][C]0.040773[/C][C]0.3436[/C][C]0.366096[/C][/ROW]
[ROW][C]13[/C][C]-0.037905[/C][C]-0.3194[/C][C]0.375183[/C][/ROW]
[ROW][C]14[/C][C]0.054997[/C][C]0.4634[/C][C]0.322243[/C][/ROW]
[ROW][C]15[/C][C]-0.01266[/C][C]-0.1067[/C][C]0.457674[/C][/ROW]
[ROW][C]16[/C][C]-0.100549[/C][C]-0.8472[/C][C]0.199855[/C][/ROW]
[ROW][C]17[/C][C]-0.053882[/C][C]-0.454[/C][C]0.3256[/C][/ROW]
[ROW][C]18[/C][C]0.054733[/C][C]0.4612[/C][C]0.323038[/C][/ROW]
[ROW][C]19[/C][C]0.107461[/C][C]0.9055[/C][C]0.184136[/C][/ROW]
[ROW][C]20[/C][C]-0.069041[/C][C]-0.5817[/C][C]0.28129[/C][/ROW]
[ROW][C]21[/C][C]-0.097168[/C][C]-0.8188[/C][C]0.207833[/C][/ROW]
[ROW][C]22[/C][C]0.102915[/C][C]0.8672[/C][C]0.194383[/C][/ROW]
[ROW][C]23[/C][C]0.056383[/C][C]0.4751[/C][C]0.31809[/C][/ROW]
[ROW][C]24[/C][C]-0.091963[/C][C]-0.7749[/C][C]0.220486[/C][/ROW]
[ROW][C]25[/C][C]-0.18959[/C][C]-1.5975[/C][C]0.057297[/C][/ROW]
[ROW][C]26[/C][C]-0.008864[/C][C]-0.0747[/C][C]0.470337[/C][/ROW]
[ROW][C]27[/C][C]-0.017687[/C][C]-0.149[/C][C]0.440975[/C][/ROW]
[ROW][C]28[/C][C]-0.093653[/C][C]-0.7891[/C][C]0.216331[/C][/ROW]
[ROW][C]29[/C][C]-0.160379[/C][C]-1.3514[/C][C]0.090432[/C][/ROW]
[ROW][C]30[/C][C]-0.048039[/C][C]-0.4048[/C][C]0.343427[/C][/ROW]
[ROW][C]31[/C][C]0.044314[/C][C]0.3734[/C][C]0.354982[/C][/ROW]
[ROW][C]32[/C][C]-0.061362[/C][C]-0.517[/C][C]0.303367[/C][/ROW]
[ROW][C]33[/C][C]-0.189815[/C][C]-1.5994[/C][C]0.057085[/C][/ROW]
[ROW][C]34[/C][C]-0.015996[/C][C]-0.1348[/C][C]0.446581[/C][/ROW]
[ROW][C]35[/C][C]0.0994[/C][C]0.8376[/C][C]0.202545[/C][/ROW]
[ROW][C]36[/C][C]0.052773[/C][C]0.4447[/C][C]0.328955[/C][/ROW]
[ROW][C]37[/C][C]-0.040369[/C][C]-0.3402[/C][C]0.367373[/C][/ROW]
[ROW][C]38[/C][C]0.079571[/C][C]0.6705[/C][C]0.252364[/C][/ROW]
[ROW][C]39[/C][C]0.09567[/C][C]0.8061[/C][C]0.211429[/C][/ROW]
[ROW][C]40[/C][C]0.141288[/C][C]1.1905[/C][C]0.118905[/C][/ROW]
[ROW][C]41[/C][C]-0.035023[/C][C]-0.2951[/C][C]0.384387[/C][/ROW]
[ROW][C]42[/C][C]0.017615[/C][C]0.1484[/C][C]0.441212[/C][/ROW]
[ROW][C]43[/C][C]0.009536[/C][C]0.0803[/C][C]0.468093[/C][/ROW]
[ROW][C]44[/C][C]-0.151593[/C][C]-1.2773[/C][C]0.102821[/C][/ROW]
[ROW][C]45[/C][C]-0.007789[/C][C]-0.0656[/C][C]0.473927[/C][/ROW]
[ROW][C]46[/C][C]0.025361[/C][C]0.2137[/C][C]0.415699[/C][/ROW]
[ROW][C]47[/C][C]0.028258[/C][C]0.2381[/C][C]0.406242[/C][/ROW]
[ROW][C]48[/C][C]-0.063038[/C][C]-0.5312[/C][C]0.298481[/C][/ROW]
[/TABLE]
Source: https://freestatistics.org/blog/index.php?pk=29113&T=1

Globally Unique Identifier (entire table): ba.freestatistics.org/blog/index.php?pk=29113&T=1

As an alternative you can also use a QR Code:  

The GUIDs for individual cells are displayed in the table below:

Autocorrelation Function
Time lag kACF(k)T-STATP-value
10.1496651.26110.105701
2-0.140445-1.18340.120297
3-0.088394-0.74480.229418
40.1528191.28770.101021
5-0.033765-0.28450.388425
6-0.133402-1.12410.132386
7-0.080813-0.68090.24906
80.0629570.53050.298716
9-0.007442-0.06270.475089
10-0.051147-0.4310.333898
110.0403350.33990.367479
120.0407730.34360.366096
13-0.037905-0.31940.375183
140.0549970.46340.322243
15-0.01266-0.10670.457674
16-0.100549-0.84720.199855
17-0.053882-0.4540.3256
180.0547330.46120.323038
190.1074610.90550.184136
20-0.069041-0.58170.28129
21-0.097168-0.81880.207833
220.1029150.86720.194383
230.0563830.47510.31809
24-0.091963-0.77490.220486
25-0.18959-1.59750.057297
26-0.008864-0.07470.470337
27-0.017687-0.1490.440975
28-0.093653-0.78910.216331
29-0.160379-1.35140.090432
30-0.048039-0.40480.343427
310.0443140.37340.354982
32-0.061362-0.5170.303367
33-0.189815-1.59940.057085
34-0.015996-0.13480.446581
350.09940.83760.202545
360.0527730.44470.328955
37-0.040369-0.34020.367373
380.0795710.67050.252364
390.095670.80610.211429
400.1412881.19050.118905
41-0.035023-0.29510.384387
420.0176150.14840.441212
430.0095360.08030.468093
44-0.151593-1.27730.102821
45-0.007789-0.06560.473927
460.0253610.21370.415699
470.0282580.23810.406242
48-0.063038-0.53120.298481


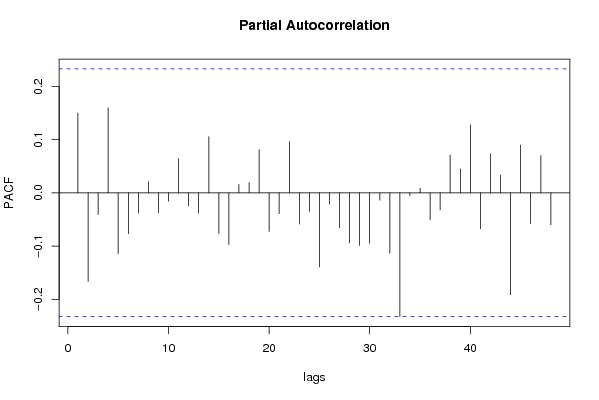
Partial Autocorrelation Function
Time lag kPACF(k)T-STATP-value
10.1496651.26110.105701
2-0.166576-1.40360.082399
3-0.040972-0.34520.365469
40.1595471.34440.091555
5-0.114237-0.96260.169512
6-0.077008-0.64890.259254
7-0.038017-0.32030.374826
80.020530.1730.431575
9-0.037479-0.31580.37654
10-0.015864-0.13370.447019
110.0645180.54360.294196
12-0.024628-0.20750.418099
13-0.038266-0.32240.374036
140.1053950.88810.18875
15-0.076339-0.64320.261069
16-0.097169-0.81880.207832
170.0156540.13190.447717
180.0192680.16240.435745
190.0810770.68320.248362
20-0.072768-0.61320.270866
21-0.039245-0.33070.370929
220.0959240.80830.210819
23-0.05878-0.49530.310963
24-0.035062-0.29540.38426
25-0.13921-1.1730.122357
26-0.021307-0.17950.429013
27-0.065639-0.55310.290973
28-0.093948-0.79160.21561
29-0.098924-0.83350.203666
30-0.094929-0.79990.213222
31-0.013786-0.11620.453925
32-0.113649-0.95760.170751
33-0.232109-1.95580.027213
34-0.005435-0.04580.481801
350.0085290.07190.471457
36-0.050824-0.42830.334882
37-0.032234-0.27160.393354
380.0707590.59620.276459
390.0447330.37690.353675
400.1275981.07520.142971
41-0.06733-0.56730.28614
420.0734140.61860.269082
430.0333570.28110.389736
44-0.191259-1.61160.055746
450.0896990.75580.226129
46-0.057785-0.48690.313912
470.0699120.58910.278834
48-0.059925-0.50490.307582

\begin{tabular}{lllllllll}
\hline
Partial Autocorrelation Function \tabularnewline
Time lag k & PACF(k) & T-STAT & P-value \tabularnewline
1 & 0.149665 & 1.2611 & 0.105701 \tabularnewline
2 & -0.166576 & -1.4036 & 0.082399 \tabularnewline
3 & -0.040972 & -0.3452 & 0.365469 \tabularnewline
4 & 0.159547 & 1.3444 & 0.091555 \tabularnewline
5 & -0.114237 & -0.9626 & 0.169512 \tabularnewline
6 & -0.077008 & -0.6489 & 0.259254 \tabularnewline
7 & -0.038017 & -0.3203 & 0.374826 \tabularnewline
8 & 0.02053 & 0.173 & 0.431575 \tabularnewline
9 & -0.037479 & -0.3158 & 0.37654 \tabularnewline
10 & -0.015864 & -0.1337 & 0.447019 \tabularnewline
11 & 0.064518 & 0.5436 & 0.294196 \tabularnewline
12 & -0.024628 & -0.2075 & 0.418099 \tabularnewline
13 & -0.038266 & -0.3224 & 0.374036 \tabularnewline
14 & 0.105395 & 0.8881 & 0.18875 \tabularnewline
15 & -0.076339 & -0.6432 & 0.261069 \tabularnewline
16 & -0.097169 & -0.8188 & 0.207832 \tabularnewline
17 & 0.015654 & 0.1319 & 0.447717 \tabularnewline
18 & 0.019268 & 0.1624 & 0.435745 \tabularnewline
19 & 0.081077 & 0.6832 & 0.248362 \tabularnewline
20 & -0.072768 & -0.6132 & 0.270866 \tabularnewline
21 & -0.039245 & -0.3307 & 0.370929 \tabularnewline
22 & 0.095924 & 0.8083 & 0.210819 \tabularnewline
23 & -0.05878 & -0.4953 & 0.310963 \tabularnewline
24 & -0.035062 & -0.2954 & 0.38426 \tabularnewline
25 & -0.13921 & -1.173 & 0.122357 \tabularnewline
26 & -0.021307 & -0.1795 & 0.429013 \tabularnewline
27 & -0.065639 & -0.5531 & 0.290973 \tabularnewline
28 & -0.093948 & -0.7916 & 0.21561 \tabularnewline
29 & -0.098924 & -0.8335 & 0.203666 \tabularnewline
30 & -0.094929 & -0.7999 & 0.213222 \tabularnewline
31 & -0.013786 & -0.1162 & 0.453925 \tabularnewline
32 & -0.113649 & -0.9576 & 0.170751 \tabularnewline
33 & -0.232109 & -1.9558 & 0.027213 \tabularnewline
34 & -0.005435 & -0.0458 & 0.481801 \tabularnewline
35 & 0.008529 & 0.0719 & 0.471457 \tabularnewline
36 & -0.050824 & -0.4283 & 0.334882 \tabularnewline
37 & -0.032234 & -0.2716 & 0.393354 \tabularnewline
38 & 0.070759 & 0.5962 & 0.276459 \tabularnewline
39 & 0.044733 & 0.3769 & 0.353675 \tabularnewline
40 & 0.127598 & 1.0752 & 0.142971 \tabularnewline
41 & -0.06733 & -0.5673 & 0.28614 \tabularnewline
42 & 0.073414 & 0.6186 & 0.269082 \tabularnewline
43 & 0.033357 & 0.2811 & 0.389736 \tabularnewline
44 & -0.191259 & -1.6116 & 0.055746 \tabularnewline
45 & 0.089699 & 0.7558 & 0.226129 \tabularnewline
46 & -0.057785 & -0.4869 & 0.313912 \tabularnewline
47 & 0.069912 & 0.5891 & 0.278834 \tabularnewline
48 & -0.059925 & -0.5049 & 0.307582 \tabularnewline
\hline
\end{tabular}
%Source: https://freestatistics.org/blog/index.php?pk=29113&T=2

[TABLE]
[ROW][C]Partial Autocorrelation Function[/C][/ROW]
[ROW][C]Time lag k[/C][C]PACF(k)[/C][C]T-STAT[/C][C]P-value[/C][/ROW]
[ROW][C]1[/C][C]0.149665[/C][C]1.2611[/C][C]0.105701[/C][/ROW]
[ROW][C]2[/C][C]-0.166576[/C][C]-1.4036[/C][C]0.082399[/C][/ROW]
[ROW][C]3[/C][C]-0.040972[/C][C]-0.3452[/C][C]0.365469[/C][/ROW]
[ROW][C]4[/C][C]0.159547[/C][C]1.3444[/C][C]0.091555[/C][/ROW]
[ROW][C]5[/C][C]-0.114237[/C][C]-0.9626[/C][C]0.169512[/C][/ROW]
[ROW][C]6[/C][C]-0.077008[/C][C]-0.6489[/C][C]0.259254[/C][/ROW]
[ROW][C]7[/C][C]-0.038017[/C][C]-0.3203[/C][C]0.374826[/C][/ROW]
[ROW][C]8[/C][C]0.02053[/C][C]0.173[/C][C]0.431575[/C][/ROW]
[ROW][C]9[/C][C]-0.037479[/C][C]-0.3158[/C][C]0.37654[/C][/ROW]
[ROW][C]10[/C][C]-0.015864[/C][C]-0.1337[/C][C]0.447019[/C][/ROW]
[ROW][C]11[/C][C]0.064518[/C][C]0.5436[/C][C]0.294196[/C][/ROW]
[ROW][C]12[/C][C]-0.024628[/C][C]-0.2075[/C][C]0.418099[/C][/ROW]
[ROW][C]13[/C][C]-0.038266[/C][C]-0.3224[/C][C]0.374036[/C][/ROW]
[ROW][C]14[/C][C]0.105395[/C][C]0.8881[/C][C]0.18875[/C][/ROW]
[ROW][C]15[/C][C]-0.076339[/C][C]-0.6432[/C][C]0.261069[/C][/ROW]
[ROW][C]16[/C][C]-0.097169[/C][C]-0.8188[/C][C]0.207832[/C][/ROW]
[ROW][C]17[/C][C]0.015654[/C][C]0.1319[/C][C]0.447717[/C][/ROW]
[ROW][C]18[/C][C]0.019268[/C][C]0.1624[/C][C]0.435745[/C][/ROW]
[ROW][C]19[/C][C]0.081077[/C][C]0.6832[/C][C]0.248362[/C][/ROW]
[ROW][C]20[/C][C]-0.072768[/C][C]-0.6132[/C][C]0.270866[/C][/ROW]
[ROW][C]21[/C][C]-0.039245[/C][C]-0.3307[/C][C]0.370929[/C][/ROW]
[ROW][C]22[/C][C]0.095924[/C][C]0.8083[/C][C]0.210819[/C][/ROW]
[ROW][C]23[/C][C]-0.05878[/C][C]-0.4953[/C][C]0.310963[/C][/ROW]
[ROW][C]24[/C][C]-0.035062[/C][C]-0.2954[/C][C]0.38426[/C][/ROW]
[ROW][C]25[/C][C]-0.13921[/C][C]-1.173[/C][C]0.122357[/C][/ROW]
[ROW][C]26[/C][C]-0.021307[/C][C]-0.1795[/C][C]0.429013[/C][/ROW]
[ROW][C]27[/C][C]-0.065639[/C][C]-0.5531[/C][C]0.290973[/C][/ROW]
[ROW][C]28[/C][C]-0.093948[/C][C]-0.7916[/C][C]0.21561[/C][/ROW]
[ROW][C]29[/C][C]-0.098924[/C][C]-0.8335[/C][C]0.203666[/C][/ROW]
[ROW][C]30[/C][C]-0.094929[/C][C]-0.7999[/C][C]0.213222[/C][/ROW]
[ROW][C]31[/C][C]-0.013786[/C][C]-0.1162[/C][C]0.453925[/C][/ROW]
[ROW][C]32[/C][C]-0.113649[/C][C]-0.9576[/C][C]0.170751[/C][/ROW]
[ROW][C]33[/C][C]-0.232109[/C][C]-1.9558[/C][C]0.027213[/C][/ROW]
[ROW][C]34[/C][C]-0.005435[/C][C]-0.0458[/C][C]0.481801[/C][/ROW]
[ROW][C]35[/C][C]0.008529[/C][C]0.0719[/C][C]0.471457[/C][/ROW]
[ROW][C]36[/C][C]-0.050824[/C][C]-0.4283[/C][C]0.334882[/C][/ROW]
[ROW][C]37[/C][C]-0.032234[/C][C]-0.2716[/C][C]0.393354[/C][/ROW]
[ROW][C]38[/C][C]0.070759[/C][C]0.5962[/C][C]0.276459[/C][/ROW]
[ROW][C]39[/C][C]0.044733[/C][C]0.3769[/C][C]0.353675[/C][/ROW]
[ROW][C]40[/C][C]0.127598[/C][C]1.0752[/C][C]0.142971[/C][/ROW]
[ROW][C]41[/C][C]-0.06733[/C][C]-0.5673[/C][C]0.28614[/C][/ROW]
[ROW][C]42[/C][C]0.073414[/C][C]0.6186[/C][C]0.269082[/C][/ROW]
[ROW][C]43[/C][C]0.033357[/C][C]0.2811[/C][C]0.389736[/C][/ROW]
[ROW][C]44[/C][C]-0.191259[/C][C]-1.6116[/C][C]0.055746[/C][/ROW]
[ROW][C]45[/C][C]0.089699[/C][C]0.7558[/C][C]0.226129[/C][/ROW]
[ROW][C]46[/C][C]-0.057785[/C][C]-0.4869[/C][C]0.313912[/C][/ROW]
[ROW][C]47[/C][C]0.069912[/C][C]0.5891[/C][C]0.278834[/C][/ROW]
[ROW][C]48[/C][C]-0.059925[/C][C]-0.5049[/C][C]0.307582[/C][/ROW]
[/TABLE]
Source: https://freestatistics.org/blog/index.php?pk=29113&T=2

Globally Unique Identifier (entire table): ba.freestatistics.org/blog/index.php?pk=29113&T=2

As an alternative you can also use a QR Code:  

The GUIDs for individual cells are displayed in the table below:

Partial Autocorrelation Function
Time lag kPACF(k)T-STATP-value
10.1496651.26110.105701
2-0.166576-1.40360.082399
3-0.040972-0.34520.365469
40.1595471.34440.091555
5-0.114237-0.96260.169512
6-0.077008-0.64890.259254
7-0.038017-0.32030.374826
80.020530.1730.431575
9-0.037479-0.31580.37654
10-0.015864-0.13370.447019
110.0645180.54360.294196
12-0.024628-0.20750.418099
13-0.038266-0.32240.374036
140.1053950.88810.18875
15-0.076339-0.64320.261069
16-0.097169-0.81880.207832
170.0156540.13190.447717
180.0192680.16240.435745
190.0810770.68320.248362
20-0.072768-0.61320.270866
21-0.039245-0.33070.370929
220.0959240.80830.210819
23-0.05878-0.49530.310963
24-0.035062-0.29540.38426
25-0.13921-1.1730.122357
26-0.021307-0.17950.429013
27-0.065639-0.55310.290973
28-0.093948-0.79160.21561
29-0.098924-0.83350.203666
30-0.094929-0.79990.213222
31-0.013786-0.11620.453925
32-0.113649-0.95760.170751
33-0.232109-1.95580.027213
34-0.005435-0.04580.481801
350.0085290.07190.471457
36-0.050824-0.42830.334882
37-0.032234-0.27160.393354
380.0707590.59620.276459
390.0447330.37690.353675
400.1275981.07520.142971
41-0.06733-0.56730.28614
420.0734140.61860.269082
430.0333570.28110.389736
44-0.191259-1.61160.055746
450.0896990.75580.226129
46-0.057785-0.48690.313912
470.0699120.58910.278834
48-0.059925-0.50490.307582


Parameters (Session):
par1 = 48 ; par2 = 1 ; par3 = 1 ; par4 = 0 ; par5 = 12 ;
Parameters (R input):
par1 = 48 ; par2 = 1 ; par3 = 1 ; par4 = 0 ; par5 = 12 ;
R code (references can be found in the software module):
if (par1 == 'Default') {
par1 = 10*log10(length(x))
} else {
par1 <- as.numeric(par1)
}
par2 <- as.numeric(par2)
par3 <- as.numeric(par3)
par4 <- as.numeric(par4)
par5 <- as.numeric(par5)
if (par2 == 0) {
x <- log(x)
} else {
x <- (x ^ par2 - 1) / par2
}
if (par3 > 0) x <- diff(x,lag=1,difference=par3)
if (par4 > 0) x <- diff(x,lag=par5,difference=par4)
bitmap(file='pic1.png')
racf <- acf(x,par1,main='Autocorrelation',xlab='lags',ylab='ACF')
dev.off()
bitmap(file='pic2.png')
rpacf <- pacf(x,par1,main='Partial Autocorrelation',xlab='lags',ylab='PACF')
dev.off()
(myacf <- c(racf$acf))
(mypacf <- c(rpacf$acf))
lengthx <- length(x)
sqrtn <- sqrt(lengthx)
load(file='createtable')
a<-table.start()
a<-table.row.start(a)
a<-table.element(a,'Autocorrelation Function',4,TRUE)
a<-table.row.end(a)
a<-table.row.start(a)
a<-table.element(a,'Time lag k',header=TRUE)
a<-table.element(a,hyperlink('basics.htm','ACF(k)','click here for more information about the Autocorrelation Function'),header=TRUE)
a<-table.element(a,'T-STAT',header=TRUE)
a<-table.element(a,'P-value',header=TRUE)
a<-table.row.end(a)
for (i in 2:(par1+1)) {
a<-table.row.start(a)
a<-table.element(a,i-1,header=TRUE)
a<-table.element(a,round(myacf[i],6))
mytstat <- myacf[i]*sqrtn
a<-table.element(a,round(mytstat,4))
a<-table.element(a,round(1-pt(abs(mytstat),lengthx),6))
a<-table.row.end(a)
}
a<-table.end(a)
table.save(a,file='mytable.tab')
a<-table.start()
a<-table.row.start(a)
a<-table.element(a,'Partial Autocorrelation Function',4,TRUE)
a<-table.row.end(a)
a<-table.row.start(a)
a<-table.element(a,'Time lag k',header=TRUE)
a<-table.element(a,hyperlink('basics.htm','PACF(k)','click here for more information about the Partial Autocorrelation Function'),header=TRUE)
a<-table.element(a,'T-STAT',header=TRUE)
a<-table.element(a,'P-value',header=TRUE)
a<-table.row.end(a)
for (i in 1:par1) {
a<-table.row.start(a)
a<-table.element(a,i,header=TRUE)
a<-table.element(a,round(mypacf[i],6))
mytstat <- mypacf[i]*sqrtn
a<-table.element(a,round(mytstat,4))
a<-table.element(a,round(1-pt(abs(mytstat),lengthx),6))
a<-table.row.end(a)
}
a<-table.end(a)
table.save(a,file='mytable1.tab')