Free Statistics

of Irreproducible Research!

Author's title

Author*The author of this computation has been verified*
R Software Modulerwasp_autocorrelation.wasp
Title produced by software(Partial) Autocorrelation Function
Date of computationFri, 05 Dec 2008 02:33:06 -0700
Cite this page as followsStatistical Computations at FreeStatistics.org, Office for Research Development and Education, URL https://freestatistics.org/blog/index.php?v=date/2008/Dec/05/t122846962194v68twtddcuxqq.htm/, Retrieved Thu, 16 May 2024 15:43:06 +0000
Statistical Computations at FreeStatistics.org, Office for Research Development and Education, URL https://freestatistics.org/blog/index.php?pk=29086, Retrieved Thu, 16 May 2024 15:43:06 +0000
QR Codes:

Original text written by user:
IsPrivate?No (this computation is public)
User-defined keywords
Estimated Impact223
Family? (F = Feedback message, R = changed R code, M = changed R Module, P = changed Parameters, D = changed Data)
-     [Univariate Data Series] [Werkloosheid BELGIE] [2008-10-19 10:57:42] [46c5a5fbda57fdfa1d4ef48658f82a0c]
- RMP     [(Partial) Autocorrelation Function] [Taak 8 - Step 3 A...] [2008-12-05 09:33:06] [b23db733701c4d62df5e228d507c1c6a] [Current]
Feedback Forum

Post a new message
Dataseries X:
565464
547344
554788
562325
560854
555332
543599
536662
542722
593530
610763
612613
611324
594167
595454
590865
589379
584428
573100
567456
569028
620735
628884
628232
612117
595404
597141
593408
590072
579799
574205
572775
572942
619567
625809
619916
587625
565742
557274
560576
548854
531673
525919
511038
498662
555362
564591
541657
527070
509846
514258
516922
507561
492622
490243
469357
477580
528379
533590
517945


Summary of computational transaction
Raw Inputview raw input (R code)
Raw Outputview raw output of R engine
Computing time2 seconds
R Server'George Udny Yule' @ 72.249.76.132

\begin{tabular}{lllllllll}
\hline
Summary of computational transaction \tabularnewline
Raw Input & view raw input (R code)  \tabularnewline
Raw Output & view raw output of R engine  \tabularnewline
Computing time & 2 seconds \tabularnewline
R Server & 'George Udny Yule' @ 72.249.76.132 \tabularnewline
\hline
\end{tabular}
%Source: https://freestatistics.org/blog/index.php?pk=29086&T=0

[TABLE]
[ROW][C]Summary of computational transaction[/C][/ROW]
[ROW][C]Raw Input[/C][C]view raw input (R code) [/C][/ROW]
[ROW][C]Raw Output[/C][C]view raw output of R engine [/C][/ROW]
[ROW][C]Computing time[/C][C]2 seconds[/C][/ROW]
[ROW][C]R Server[/C][C]'George Udny Yule' @ 72.249.76.132[/C][/ROW]
[/TABLE]
Source: https://freestatistics.org/blog/index.php?pk=29086&T=0

Globally Unique Identifier (entire table): ba.freestatistics.org/blog/index.php?pk=29086&T=0

As an alternative you can also use a QR Code:  

The GUIDs for individual cells are displayed in the table below:

Summary of computational transaction
Raw Inputview raw input (R code)
Raw Outputview raw output of R engine
Computing time2 seconds
R Server'George Udny Yule' @ 72.249.76.132


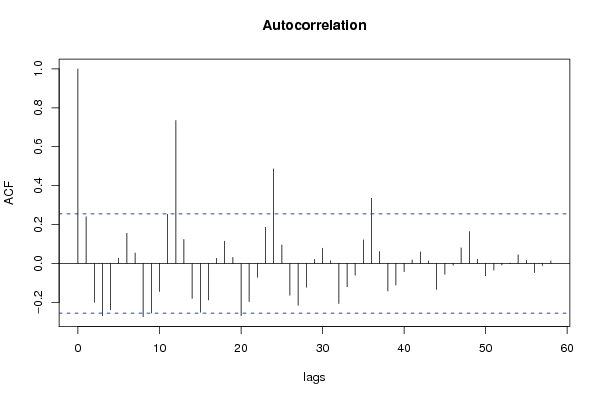
Autocorrelation Function
Time lag kACF(k)T-STATP-value
10.240451.84690.034887
2-0.199346-1.53120.065531
3-0.269533-2.07030.021404
4-0.238476-1.83180.036017
50.0260280.19990.421114
60.155011.19070.119279
70.0530670.40760.342516
8-0.273861-2.10360.019845
9-0.254561-1.95530.027643
10-0.144004-1.10610.136583
110.2527111.94110.028513
120.7343985.6410
130.1230250.9450.174263
14-0.180076-1.38320.085909
15-0.250815-1.92650.029429
16-0.187987-1.4440.07702
170.026340.20230.420181
180.1143370.87820.191689
190.0309070.23740.406585
20-0.268703-2.06390.021715
21-0.195985-1.50540.06878
22-0.071856-0.55190.291538
230.1855841.42550.079642
240.4861333.73410.000213
250.0950210.72990.234178
26-0.163736-1.25770.106731
27-0.215349-1.65410.051706
28-0.122435-0.94040.175413
290.020390.15660.438041
300.0784950.60290.274432
310.0132090.10150.459763
32-0.206634-1.58720.058908
33-0.119906-0.9210.180396
34-0.060711-0.46630.321348
350.1208170.9280.178592
360.3347782.57150.006333
370.0614940.47230.319212
38-0.141867-1.08970.140137
39-0.111535-0.85670.197533
40-0.041697-0.32030.374942
410.0179750.13810.445328
420.0590720.45370.325839
430.0129360.09940.460593
44-0.133971-1.02910.153828
45-0.055961-0.42980.334437
46-0.009433-0.07250.471242
470.0798530.61340.270997
480.1636041.25670.106913
490.021270.16340.435388
50-0.063008-0.4840.315097
51-0.034475-0.26480.396041
52-0.00772-0.05930.476458
530.0018230.0140.494438
540.044350.34070.367285
550.0160330.12320.451202
56-0.04695-0.36060.359831
57-0.011079-0.08510.466236
580.0125630.09650.461725
59NANANA
60NANANA

\begin{tabular}{lllllllll}
\hline
Autocorrelation Function \tabularnewline
Time lag k & ACF(k) & T-STAT & P-value \tabularnewline
1 & 0.24045 & 1.8469 & 0.034887 \tabularnewline
2 & -0.199346 & -1.5312 & 0.065531 \tabularnewline
3 & -0.269533 & -2.0703 & 0.021404 \tabularnewline
4 & -0.238476 & -1.8318 & 0.036017 \tabularnewline
5 & 0.026028 & 0.1999 & 0.421114 \tabularnewline
6 & 0.15501 & 1.1907 & 0.119279 \tabularnewline
7 & 0.053067 & 0.4076 & 0.342516 \tabularnewline
8 & -0.273861 & -2.1036 & 0.019845 \tabularnewline
9 & -0.254561 & -1.9553 & 0.027643 \tabularnewline
10 & -0.144004 & -1.1061 & 0.136583 \tabularnewline
11 & 0.252711 & 1.9411 & 0.028513 \tabularnewline
12 & 0.734398 & 5.641 & 0 \tabularnewline
13 & 0.123025 & 0.945 & 0.174263 \tabularnewline
14 & -0.180076 & -1.3832 & 0.085909 \tabularnewline
15 & -0.250815 & -1.9265 & 0.029429 \tabularnewline
16 & -0.187987 & -1.444 & 0.07702 \tabularnewline
17 & 0.02634 & 0.2023 & 0.420181 \tabularnewline
18 & 0.114337 & 0.8782 & 0.191689 \tabularnewline
19 & 0.030907 & 0.2374 & 0.406585 \tabularnewline
20 & -0.268703 & -2.0639 & 0.021715 \tabularnewline
21 & -0.195985 & -1.5054 & 0.06878 \tabularnewline
22 & -0.071856 & -0.5519 & 0.291538 \tabularnewline
23 & 0.185584 & 1.4255 & 0.079642 \tabularnewline
24 & 0.486133 & 3.7341 & 0.000213 \tabularnewline
25 & 0.095021 & 0.7299 & 0.234178 \tabularnewline
26 & -0.163736 & -1.2577 & 0.106731 \tabularnewline
27 & -0.215349 & -1.6541 & 0.051706 \tabularnewline
28 & -0.122435 & -0.9404 & 0.175413 \tabularnewline
29 & 0.02039 & 0.1566 & 0.438041 \tabularnewline
30 & 0.078495 & 0.6029 & 0.274432 \tabularnewline
31 & 0.013209 & 0.1015 & 0.459763 \tabularnewline
32 & -0.206634 & -1.5872 & 0.058908 \tabularnewline
33 & -0.119906 & -0.921 & 0.180396 \tabularnewline
34 & -0.060711 & -0.4663 & 0.321348 \tabularnewline
35 & 0.120817 & 0.928 & 0.178592 \tabularnewline
36 & 0.334778 & 2.5715 & 0.006333 \tabularnewline
37 & 0.061494 & 0.4723 & 0.319212 \tabularnewline
38 & -0.141867 & -1.0897 & 0.140137 \tabularnewline
39 & -0.111535 & -0.8567 & 0.197533 \tabularnewline
40 & -0.041697 & -0.3203 & 0.374942 \tabularnewline
41 & 0.017975 & 0.1381 & 0.445328 \tabularnewline
42 & 0.059072 & 0.4537 & 0.325839 \tabularnewline
43 & 0.012936 & 0.0994 & 0.460593 \tabularnewline
44 & -0.133971 & -1.0291 & 0.153828 \tabularnewline
45 & -0.055961 & -0.4298 & 0.334437 \tabularnewline
46 & -0.009433 & -0.0725 & 0.471242 \tabularnewline
47 & 0.079853 & 0.6134 & 0.270997 \tabularnewline
48 & 0.163604 & 1.2567 & 0.106913 \tabularnewline
49 & 0.02127 & 0.1634 & 0.435388 \tabularnewline
50 & -0.063008 & -0.484 & 0.315097 \tabularnewline
51 & -0.034475 & -0.2648 & 0.396041 \tabularnewline
52 & -0.00772 & -0.0593 & 0.476458 \tabularnewline
53 & 0.001823 & 0.014 & 0.494438 \tabularnewline
54 & 0.04435 & 0.3407 & 0.367285 \tabularnewline
55 & 0.016033 & 0.1232 & 0.451202 \tabularnewline
56 & -0.04695 & -0.3606 & 0.359831 \tabularnewline
57 & -0.011079 & -0.0851 & 0.466236 \tabularnewline
58 & 0.012563 & 0.0965 & 0.461725 \tabularnewline
59 & NA & NA & NA \tabularnewline
60 & NA & NA & NA \tabularnewline
\hline
\end{tabular}
%Source: https://freestatistics.org/blog/index.php?pk=29086&T=1

[TABLE]
[ROW][C]Autocorrelation Function[/C][/ROW]
[ROW][C]Time lag k[/C][C]ACF(k)[/C][C]T-STAT[/C][C]P-value[/C][/ROW]
[ROW][C]1[/C][C]0.24045[/C][C]1.8469[/C][C]0.034887[/C][/ROW]
[ROW][C]2[/C][C]-0.199346[/C][C]-1.5312[/C][C]0.065531[/C][/ROW]
[ROW][C]3[/C][C]-0.269533[/C][C]-2.0703[/C][C]0.021404[/C][/ROW]
[ROW][C]4[/C][C]-0.238476[/C][C]-1.8318[/C][C]0.036017[/C][/ROW]
[ROW][C]5[/C][C]0.026028[/C][C]0.1999[/C][C]0.421114[/C][/ROW]
[ROW][C]6[/C][C]0.15501[/C][C]1.1907[/C][C]0.119279[/C][/ROW]
[ROW][C]7[/C][C]0.053067[/C][C]0.4076[/C][C]0.342516[/C][/ROW]
[ROW][C]8[/C][C]-0.273861[/C][C]-2.1036[/C][C]0.019845[/C][/ROW]
[ROW][C]9[/C][C]-0.254561[/C][C]-1.9553[/C][C]0.027643[/C][/ROW]
[ROW][C]10[/C][C]-0.144004[/C][C]-1.1061[/C][C]0.136583[/C][/ROW]
[ROW][C]11[/C][C]0.252711[/C][C]1.9411[/C][C]0.028513[/C][/ROW]
[ROW][C]12[/C][C]0.734398[/C][C]5.641[/C][C]0[/C][/ROW]
[ROW][C]13[/C][C]0.123025[/C][C]0.945[/C][C]0.174263[/C][/ROW]
[ROW][C]14[/C][C]-0.180076[/C][C]-1.3832[/C][C]0.085909[/C][/ROW]
[ROW][C]15[/C][C]-0.250815[/C][C]-1.9265[/C][C]0.029429[/C][/ROW]
[ROW][C]16[/C][C]-0.187987[/C][C]-1.444[/C][C]0.07702[/C][/ROW]
[ROW][C]17[/C][C]0.02634[/C][C]0.2023[/C][C]0.420181[/C][/ROW]
[ROW][C]18[/C][C]0.114337[/C][C]0.8782[/C][C]0.191689[/C][/ROW]
[ROW][C]19[/C][C]0.030907[/C][C]0.2374[/C][C]0.406585[/C][/ROW]
[ROW][C]20[/C][C]-0.268703[/C][C]-2.0639[/C][C]0.021715[/C][/ROW]
[ROW][C]21[/C][C]-0.195985[/C][C]-1.5054[/C][C]0.06878[/C][/ROW]
[ROW][C]22[/C][C]-0.071856[/C][C]-0.5519[/C][C]0.291538[/C][/ROW]
[ROW][C]23[/C][C]0.185584[/C][C]1.4255[/C][C]0.079642[/C][/ROW]
[ROW][C]24[/C][C]0.486133[/C][C]3.7341[/C][C]0.000213[/C][/ROW]
[ROW][C]25[/C][C]0.095021[/C][C]0.7299[/C][C]0.234178[/C][/ROW]
[ROW][C]26[/C][C]-0.163736[/C][C]-1.2577[/C][C]0.106731[/C][/ROW]
[ROW][C]27[/C][C]-0.215349[/C][C]-1.6541[/C][C]0.051706[/C][/ROW]
[ROW][C]28[/C][C]-0.122435[/C][C]-0.9404[/C][C]0.175413[/C][/ROW]
[ROW][C]29[/C][C]0.02039[/C][C]0.1566[/C][C]0.438041[/C][/ROW]
[ROW][C]30[/C][C]0.078495[/C][C]0.6029[/C][C]0.274432[/C][/ROW]
[ROW][C]31[/C][C]0.013209[/C][C]0.1015[/C][C]0.459763[/C][/ROW]
[ROW][C]32[/C][C]-0.206634[/C][C]-1.5872[/C][C]0.058908[/C][/ROW]
[ROW][C]33[/C][C]-0.119906[/C][C]-0.921[/C][C]0.180396[/C][/ROW]
[ROW][C]34[/C][C]-0.060711[/C][C]-0.4663[/C][C]0.321348[/C][/ROW]
[ROW][C]35[/C][C]0.120817[/C][C]0.928[/C][C]0.178592[/C][/ROW]
[ROW][C]36[/C][C]0.334778[/C][C]2.5715[/C][C]0.006333[/C][/ROW]
[ROW][C]37[/C][C]0.061494[/C][C]0.4723[/C][C]0.319212[/C][/ROW]
[ROW][C]38[/C][C]-0.141867[/C][C]-1.0897[/C][C]0.140137[/C][/ROW]
[ROW][C]39[/C][C]-0.111535[/C][C]-0.8567[/C][C]0.197533[/C][/ROW]
[ROW][C]40[/C][C]-0.041697[/C][C]-0.3203[/C][C]0.374942[/C][/ROW]
[ROW][C]41[/C][C]0.017975[/C][C]0.1381[/C][C]0.445328[/C][/ROW]
[ROW][C]42[/C][C]0.059072[/C][C]0.4537[/C][C]0.325839[/C][/ROW]
[ROW][C]43[/C][C]0.012936[/C][C]0.0994[/C][C]0.460593[/C][/ROW]
[ROW][C]44[/C][C]-0.133971[/C][C]-1.0291[/C][C]0.153828[/C][/ROW]
[ROW][C]45[/C][C]-0.055961[/C][C]-0.4298[/C][C]0.334437[/C][/ROW]
[ROW][C]46[/C][C]-0.009433[/C][C]-0.0725[/C][C]0.471242[/C][/ROW]
[ROW][C]47[/C][C]0.079853[/C][C]0.6134[/C][C]0.270997[/C][/ROW]
[ROW][C]48[/C][C]0.163604[/C][C]1.2567[/C][C]0.106913[/C][/ROW]
[ROW][C]49[/C][C]0.02127[/C][C]0.1634[/C][C]0.435388[/C][/ROW]
[ROW][C]50[/C][C]-0.063008[/C][C]-0.484[/C][C]0.315097[/C][/ROW]
[ROW][C]51[/C][C]-0.034475[/C][C]-0.2648[/C][C]0.396041[/C][/ROW]
[ROW][C]52[/C][C]-0.00772[/C][C]-0.0593[/C][C]0.476458[/C][/ROW]
[ROW][C]53[/C][C]0.001823[/C][C]0.014[/C][C]0.494438[/C][/ROW]
[ROW][C]54[/C][C]0.04435[/C][C]0.3407[/C][C]0.367285[/C][/ROW]
[ROW][C]55[/C][C]0.016033[/C][C]0.1232[/C][C]0.451202[/C][/ROW]
[ROW][C]56[/C][C]-0.04695[/C][C]-0.3606[/C][C]0.359831[/C][/ROW]
[ROW][C]57[/C][C]-0.011079[/C][C]-0.0851[/C][C]0.466236[/C][/ROW]
[ROW][C]58[/C][C]0.012563[/C][C]0.0965[/C][C]0.461725[/C][/ROW]
[ROW][C]59[/C][C]NA[/C][C]NA[/C][C]NA[/C][/ROW]
[ROW][C]60[/C][C]NA[/C][C]NA[/C][C]NA[/C][/ROW]
[/TABLE]
Source: https://freestatistics.org/blog/index.php?pk=29086&T=1

Globally Unique Identifier (entire table): ba.freestatistics.org/blog/index.php?pk=29086&T=1

As an alternative you can also use a QR Code:  

The GUIDs for individual cells are displayed in the table below:

Autocorrelation Function
Time lag kACF(k)T-STATP-value
10.240451.84690.034887
2-0.199346-1.53120.065531
3-0.269533-2.07030.021404
4-0.238476-1.83180.036017
50.0260280.19990.421114
60.155011.19070.119279
70.0530670.40760.342516
8-0.273861-2.10360.019845
9-0.254561-1.95530.027643
10-0.144004-1.10610.136583
110.2527111.94110.028513
120.7343985.6410
130.1230250.9450.174263
14-0.180076-1.38320.085909
15-0.250815-1.92650.029429
16-0.187987-1.4440.07702
170.026340.20230.420181
180.1143370.87820.191689
190.0309070.23740.406585
20-0.268703-2.06390.021715
21-0.195985-1.50540.06878
22-0.071856-0.55190.291538
230.1855841.42550.079642
240.4861333.73410.000213
250.0950210.72990.234178
26-0.163736-1.25770.106731
27-0.215349-1.65410.051706
28-0.122435-0.94040.175413
290.020390.15660.438041
300.0784950.60290.274432
310.0132090.10150.459763
32-0.206634-1.58720.058908
33-0.119906-0.9210.180396
34-0.060711-0.46630.321348
350.1208170.9280.178592
360.3347782.57150.006333
370.0614940.47230.319212
38-0.141867-1.08970.140137
39-0.111535-0.85670.197533
40-0.041697-0.32030.374942
410.0179750.13810.445328
420.0590720.45370.325839
430.0129360.09940.460593
44-0.133971-1.02910.153828
45-0.055961-0.42980.334437
46-0.009433-0.07250.471242
470.0798530.61340.270997
480.1636041.25670.106913
490.021270.16340.435388
50-0.063008-0.4840.315097
51-0.034475-0.26480.396041
52-0.00772-0.05930.476458
530.0018230.0140.494438
540.044350.34070.367285
550.0160330.12320.451202
56-0.04695-0.36060.359831
57-0.011079-0.08510.466236
580.0125630.09650.461725
59NANANA
60NANANA


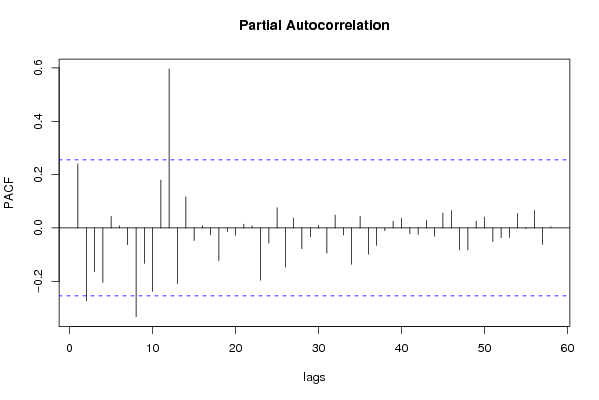
Partial Autocorrelation Function
Time lag kPACF(k)T-STATP-value
10.240451.84690.034887
2-0.272943-2.09650.020167
3-0.163864-1.25870.106554
4-0.203922-1.56640.061307
50.0431370.33130.37078
60.0078280.06010.476128
7-0.062704-0.48160.315924
8-0.332712-2.55560.006599
9-0.132581-1.01840.156329
10-0.237666-1.82550.03649
110.1797621.38080.086278
120.5963744.58081.2e-05
13-0.2084-1.60070.057387
140.1169990.89870.186236
15-0.046665-0.35840.360648
160.0089720.06890.472644
17-0.025698-0.19740.4221
18-0.122622-0.94190.175047
19-0.013554-0.10410.458718
20-0.027901-0.21430.415521
210.0139150.10690.457621
220.0079170.06080.475856
23-0.196461-1.5090.068312
24-0.056258-0.43210.333614
250.0758880.58290.28109
26-0.147119-1.130.131516
270.0370030.28420.388615
28-0.077682-0.59670.2765
29-0.033275-0.25560.399577
300.0101290.07780.469125
31-0.094599-0.72660.235163
320.0483830.37160.355748
33-0.026262-0.20170.420414
34-0.13624-1.04650.149804
350.0437560.33610.368995
36-0.098553-0.7570.226032
37-0.065002-0.49930.309715
38-0.01006-0.07730.469334
390.0248090.19060.42476
400.0371780.28560.388105
41-0.021352-0.1640.435143
42-0.023924-0.18380.427415
430.0280860.21570.41497
44-0.031477-0.24180.404896
450.0557860.42850.334924
460.0648480.49810.310131
47-0.082461-0.63340.264461
48-0.08258-0.63430.264166
490.0260670.20020.420997
500.0407980.31340.377551
51-0.051012-0.39180.348297
52-0.036357-0.27930.39051
53-0.035484-0.27260.393071
540.0546920.42010.337971
55-0.00308-0.02370.490603
560.0656740.50450.307911
57-0.062089-0.47690.317592
580.0042230.03240.487117
59NANANA
60NANANA

\begin{tabular}{lllllllll}
\hline
Partial Autocorrelation Function \tabularnewline
Time lag k & PACF(k) & T-STAT & P-value \tabularnewline
1 & 0.24045 & 1.8469 & 0.034887 \tabularnewline
2 & -0.272943 & -2.0965 & 0.020167 \tabularnewline
3 & -0.163864 & -1.2587 & 0.106554 \tabularnewline
4 & -0.203922 & -1.5664 & 0.061307 \tabularnewline
5 & 0.043137 & 0.3313 & 0.37078 \tabularnewline
6 & 0.007828 & 0.0601 & 0.476128 \tabularnewline
7 & -0.062704 & -0.4816 & 0.315924 \tabularnewline
8 & -0.332712 & -2.5556 & 0.006599 \tabularnewline
9 & -0.132581 & -1.0184 & 0.156329 \tabularnewline
10 & -0.237666 & -1.8255 & 0.03649 \tabularnewline
11 & 0.179762 & 1.3808 & 0.086278 \tabularnewline
12 & 0.596374 & 4.5808 & 1.2e-05 \tabularnewline
13 & -0.2084 & -1.6007 & 0.057387 \tabularnewline
14 & 0.116999 & 0.8987 & 0.186236 \tabularnewline
15 & -0.046665 & -0.3584 & 0.360648 \tabularnewline
16 & 0.008972 & 0.0689 & 0.472644 \tabularnewline
17 & -0.025698 & -0.1974 & 0.4221 \tabularnewline
18 & -0.122622 & -0.9419 & 0.175047 \tabularnewline
19 & -0.013554 & -0.1041 & 0.458718 \tabularnewline
20 & -0.027901 & -0.2143 & 0.415521 \tabularnewline
21 & 0.013915 & 0.1069 & 0.457621 \tabularnewline
22 & 0.007917 & 0.0608 & 0.475856 \tabularnewline
23 & -0.196461 & -1.509 & 0.068312 \tabularnewline
24 & -0.056258 & -0.4321 & 0.333614 \tabularnewline
25 & 0.075888 & 0.5829 & 0.28109 \tabularnewline
26 & -0.147119 & -1.13 & 0.131516 \tabularnewline
27 & 0.037003 & 0.2842 & 0.388615 \tabularnewline
28 & -0.077682 & -0.5967 & 0.2765 \tabularnewline
29 & -0.033275 & -0.2556 & 0.399577 \tabularnewline
30 & 0.010129 & 0.0778 & 0.469125 \tabularnewline
31 & -0.094599 & -0.7266 & 0.235163 \tabularnewline
32 & 0.048383 & 0.3716 & 0.355748 \tabularnewline
33 & -0.026262 & -0.2017 & 0.420414 \tabularnewline
34 & -0.13624 & -1.0465 & 0.149804 \tabularnewline
35 & 0.043756 & 0.3361 & 0.368995 \tabularnewline
36 & -0.098553 & -0.757 & 0.226032 \tabularnewline
37 & -0.065002 & -0.4993 & 0.309715 \tabularnewline
38 & -0.01006 & -0.0773 & 0.469334 \tabularnewline
39 & 0.024809 & 0.1906 & 0.42476 \tabularnewline
40 & 0.037178 & 0.2856 & 0.388105 \tabularnewline
41 & -0.021352 & -0.164 & 0.435143 \tabularnewline
42 & -0.023924 & -0.1838 & 0.427415 \tabularnewline
43 & 0.028086 & 0.2157 & 0.41497 \tabularnewline
44 & -0.031477 & -0.2418 & 0.404896 \tabularnewline
45 & 0.055786 & 0.4285 & 0.334924 \tabularnewline
46 & 0.064848 & 0.4981 & 0.310131 \tabularnewline
47 & -0.082461 & -0.6334 & 0.264461 \tabularnewline
48 & -0.08258 & -0.6343 & 0.264166 \tabularnewline
49 & 0.026067 & 0.2002 & 0.420997 \tabularnewline
50 & 0.040798 & 0.3134 & 0.377551 \tabularnewline
51 & -0.051012 & -0.3918 & 0.348297 \tabularnewline
52 & -0.036357 & -0.2793 & 0.39051 \tabularnewline
53 & -0.035484 & -0.2726 & 0.393071 \tabularnewline
54 & 0.054692 & 0.4201 & 0.337971 \tabularnewline
55 & -0.00308 & -0.0237 & 0.490603 \tabularnewline
56 & 0.065674 & 0.5045 & 0.307911 \tabularnewline
57 & -0.062089 & -0.4769 & 0.317592 \tabularnewline
58 & 0.004223 & 0.0324 & 0.487117 \tabularnewline
59 & NA & NA & NA \tabularnewline
60 & NA & NA & NA \tabularnewline
\hline
\end{tabular}
%Source: https://freestatistics.org/blog/index.php?pk=29086&T=2

[TABLE]
[ROW][C]Partial Autocorrelation Function[/C][/ROW]
[ROW][C]Time lag k[/C][C]PACF(k)[/C][C]T-STAT[/C][C]P-value[/C][/ROW]
[ROW][C]1[/C][C]0.24045[/C][C]1.8469[/C][C]0.034887[/C][/ROW]
[ROW][C]2[/C][C]-0.272943[/C][C]-2.0965[/C][C]0.020167[/C][/ROW]
[ROW][C]3[/C][C]-0.163864[/C][C]-1.2587[/C][C]0.106554[/C][/ROW]
[ROW][C]4[/C][C]-0.203922[/C][C]-1.5664[/C][C]0.061307[/C][/ROW]
[ROW][C]5[/C][C]0.043137[/C][C]0.3313[/C][C]0.37078[/C][/ROW]
[ROW][C]6[/C][C]0.007828[/C][C]0.0601[/C][C]0.476128[/C][/ROW]
[ROW][C]7[/C][C]-0.062704[/C][C]-0.4816[/C][C]0.315924[/C][/ROW]
[ROW][C]8[/C][C]-0.332712[/C][C]-2.5556[/C][C]0.006599[/C][/ROW]
[ROW][C]9[/C][C]-0.132581[/C][C]-1.0184[/C][C]0.156329[/C][/ROW]
[ROW][C]10[/C][C]-0.237666[/C][C]-1.8255[/C][C]0.03649[/C][/ROW]
[ROW][C]11[/C][C]0.179762[/C][C]1.3808[/C][C]0.086278[/C][/ROW]
[ROW][C]12[/C][C]0.596374[/C][C]4.5808[/C][C]1.2e-05[/C][/ROW]
[ROW][C]13[/C][C]-0.2084[/C][C]-1.6007[/C][C]0.057387[/C][/ROW]
[ROW][C]14[/C][C]0.116999[/C][C]0.8987[/C][C]0.186236[/C][/ROW]
[ROW][C]15[/C][C]-0.046665[/C][C]-0.3584[/C][C]0.360648[/C][/ROW]
[ROW][C]16[/C][C]0.008972[/C][C]0.0689[/C][C]0.472644[/C][/ROW]
[ROW][C]17[/C][C]-0.025698[/C][C]-0.1974[/C][C]0.4221[/C][/ROW]
[ROW][C]18[/C][C]-0.122622[/C][C]-0.9419[/C][C]0.175047[/C][/ROW]
[ROW][C]19[/C][C]-0.013554[/C][C]-0.1041[/C][C]0.458718[/C][/ROW]
[ROW][C]20[/C][C]-0.027901[/C][C]-0.2143[/C][C]0.415521[/C][/ROW]
[ROW][C]21[/C][C]0.013915[/C][C]0.1069[/C][C]0.457621[/C][/ROW]
[ROW][C]22[/C][C]0.007917[/C][C]0.0608[/C][C]0.475856[/C][/ROW]
[ROW][C]23[/C][C]-0.196461[/C][C]-1.509[/C][C]0.068312[/C][/ROW]
[ROW][C]24[/C][C]-0.056258[/C][C]-0.4321[/C][C]0.333614[/C][/ROW]
[ROW][C]25[/C][C]0.075888[/C][C]0.5829[/C][C]0.28109[/C][/ROW]
[ROW][C]26[/C][C]-0.147119[/C][C]-1.13[/C][C]0.131516[/C][/ROW]
[ROW][C]27[/C][C]0.037003[/C][C]0.2842[/C][C]0.388615[/C][/ROW]
[ROW][C]28[/C][C]-0.077682[/C][C]-0.5967[/C][C]0.2765[/C][/ROW]
[ROW][C]29[/C][C]-0.033275[/C][C]-0.2556[/C][C]0.399577[/C][/ROW]
[ROW][C]30[/C][C]0.010129[/C][C]0.0778[/C][C]0.469125[/C][/ROW]
[ROW][C]31[/C][C]-0.094599[/C][C]-0.7266[/C][C]0.235163[/C][/ROW]
[ROW][C]32[/C][C]0.048383[/C][C]0.3716[/C][C]0.355748[/C][/ROW]
[ROW][C]33[/C][C]-0.026262[/C][C]-0.2017[/C][C]0.420414[/C][/ROW]
[ROW][C]34[/C][C]-0.13624[/C][C]-1.0465[/C][C]0.149804[/C][/ROW]
[ROW][C]35[/C][C]0.043756[/C][C]0.3361[/C][C]0.368995[/C][/ROW]
[ROW][C]36[/C][C]-0.098553[/C][C]-0.757[/C][C]0.226032[/C][/ROW]
[ROW][C]37[/C][C]-0.065002[/C][C]-0.4993[/C][C]0.309715[/C][/ROW]
[ROW][C]38[/C][C]-0.01006[/C][C]-0.0773[/C][C]0.469334[/C][/ROW]
[ROW][C]39[/C][C]0.024809[/C][C]0.1906[/C][C]0.42476[/C][/ROW]
[ROW][C]40[/C][C]0.037178[/C][C]0.2856[/C][C]0.388105[/C][/ROW]
[ROW][C]41[/C][C]-0.021352[/C][C]-0.164[/C][C]0.435143[/C][/ROW]
[ROW][C]42[/C][C]-0.023924[/C][C]-0.1838[/C][C]0.427415[/C][/ROW]
[ROW][C]43[/C][C]0.028086[/C][C]0.2157[/C][C]0.41497[/C][/ROW]
[ROW][C]44[/C][C]-0.031477[/C][C]-0.2418[/C][C]0.404896[/C][/ROW]
[ROW][C]45[/C][C]0.055786[/C][C]0.4285[/C][C]0.334924[/C][/ROW]
[ROW][C]46[/C][C]0.064848[/C][C]0.4981[/C][C]0.310131[/C][/ROW]
[ROW][C]47[/C][C]-0.082461[/C][C]-0.6334[/C][C]0.264461[/C][/ROW]
[ROW][C]48[/C][C]-0.08258[/C][C]-0.6343[/C][C]0.264166[/C][/ROW]
[ROW][C]49[/C][C]0.026067[/C][C]0.2002[/C][C]0.420997[/C][/ROW]
[ROW][C]50[/C][C]0.040798[/C][C]0.3134[/C][C]0.377551[/C][/ROW]
[ROW][C]51[/C][C]-0.051012[/C][C]-0.3918[/C][C]0.348297[/C][/ROW]
[ROW][C]52[/C][C]-0.036357[/C][C]-0.2793[/C][C]0.39051[/C][/ROW]
[ROW][C]53[/C][C]-0.035484[/C][C]-0.2726[/C][C]0.393071[/C][/ROW]
[ROW][C]54[/C][C]0.054692[/C][C]0.4201[/C][C]0.337971[/C][/ROW]
[ROW][C]55[/C][C]-0.00308[/C][C]-0.0237[/C][C]0.490603[/C][/ROW]
[ROW][C]56[/C][C]0.065674[/C][C]0.5045[/C][C]0.307911[/C][/ROW]
[ROW][C]57[/C][C]-0.062089[/C][C]-0.4769[/C][C]0.317592[/C][/ROW]
[ROW][C]58[/C][C]0.004223[/C][C]0.0324[/C][C]0.487117[/C][/ROW]
[ROW][C]59[/C][C]NA[/C][C]NA[/C][C]NA[/C][/ROW]
[ROW][C]60[/C][C]NA[/C][C]NA[/C][C]NA[/C][/ROW]
[/TABLE]
Source: https://freestatistics.org/blog/index.php?pk=29086&T=2

Globally Unique Identifier (entire table): ba.freestatistics.org/blog/index.php?pk=29086&T=2

As an alternative you can also use a QR Code:  

The GUIDs for individual cells are displayed in the table below:

Partial Autocorrelation Function
Time lag kPACF(k)T-STATP-value
10.240451.84690.034887
2-0.272943-2.09650.020167
3-0.163864-1.25870.106554
4-0.203922-1.56640.061307
50.0431370.33130.37078
60.0078280.06010.476128
7-0.062704-0.48160.315924
8-0.332712-2.55560.006599
9-0.132581-1.01840.156329
10-0.237666-1.82550.03649
110.1797621.38080.086278
120.5963744.58081.2e-05
13-0.2084-1.60070.057387
140.1169990.89870.186236
15-0.046665-0.35840.360648
160.0089720.06890.472644
17-0.025698-0.19740.4221
18-0.122622-0.94190.175047
19-0.013554-0.10410.458718
20-0.027901-0.21430.415521
210.0139150.10690.457621
220.0079170.06080.475856
23-0.196461-1.5090.068312
24-0.056258-0.43210.333614
250.0758880.58290.28109
26-0.147119-1.130.131516
270.0370030.28420.388615
28-0.077682-0.59670.2765
29-0.033275-0.25560.399577
300.0101290.07780.469125
31-0.094599-0.72660.235163
320.0483830.37160.355748
33-0.026262-0.20170.420414
34-0.13624-1.04650.149804
350.0437560.33610.368995
36-0.098553-0.7570.226032
37-0.065002-0.49930.309715
38-0.01006-0.07730.469334
390.0248090.19060.42476
400.0371780.28560.388105
41-0.021352-0.1640.435143
42-0.023924-0.18380.427415
430.0280860.21570.41497
44-0.031477-0.24180.404896
450.0557860.42850.334924
460.0648480.49810.310131
47-0.082461-0.63340.264461
48-0.08258-0.63430.264166
490.0260670.20020.420997
500.0407980.31340.377551
51-0.051012-0.39180.348297
52-0.036357-0.27930.39051
53-0.035484-0.27260.393071
540.0546920.42010.337971
55-0.00308-0.02370.490603
560.0656740.50450.307911
57-0.062089-0.47690.317592
580.0042230.03240.487117
59NANANA
60NANANA


Parameters (Session):
par1 = 60 ; par2 = 1.2 ; par3 = 1 ; par4 = 0 ; par5 = 12 ;
Parameters (R input):
par1 = 60 ; par2 = 1.2 ; par3 = 1 ; par4 = 0 ; par5 = 12 ;
R code (references can be found in the software module):
if (par1 == 'Default') {
par1 = 10*log10(length(x))
} else {
par1 <- as.numeric(par1)
}
par2 <- as.numeric(par2)
par3 <- as.numeric(par3)
par4 <- as.numeric(par4)
par5 <- as.numeric(par5)
if (par2 == 0) {
x <- log(x)
} else {
x <- (x ^ par2 - 1) / par2
}
if (par3 > 0) x <- diff(x,lag=1,difference=par3)
if (par4 > 0) x <- diff(x,lag=par5,difference=par4)
bitmap(file='pic1.png')
racf <- acf(x,par1,main='Autocorrelation',xlab='lags',ylab='ACF')
dev.off()
bitmap(file='pic2.png')
rpacf <- pacf(x,par1,main='Partial Autocorrelation',xlab='lags',ylab='PACF')
dev.off()
(myacf <- c(racf$acf))
(mypacf <- c(rpacf$acf))
lengthx <- length(x)
sqrtn <- sqrt(lengthx)
load(file='createtable')
a<-table.start()
a<-table.row.start(a)
a<-table.element(a,'Autocorrelation Function',4,TRUE)
a<-table.row.end(a)
a<-table.row.start(a)
a<-table.element(a,'Time lag k',header=TRUE)
a<-table.element(a,hyperlink('basics.htm','ACF(k)','click here for more information about the Autocorrelation Function'),header=TRUE)
a<-table.element(a,'T-STAT',header=TRUE)
a<-table.element(a,'P-value',header=TRUE)
a<-table.row.end(a)
for (i in 2:(par1+1)) {
a<-table.row.start(a)
a<-table.element(a,i-1,header=TRUE)
a<-table.element(a,round(myacf[i],6))
mytstat <- myacf[i]*sqrtn
a<-table.element(a,round(mytstat,4))
a<-table.element(a,round(1-pt(abs(mytstat),lengthx),6))
a<-table.row.end(a)
}
a<-table.end(a)
table.save(a,file='mytable.tab')
a<-table.start()
a<-table.row.start(a)
a<-table.element(a,'Partial Autocorrelation Function',4,TRUE)
a<-table.row.end(a)
a<-table.row.start(a)
a<-table.element(a,'Time lag k',header=TRUE)
a<-table.element(a,hyperlink('basics.htm','PACF(k)','click here for more information about the Partial Autocorrelation Function'),header=TRUE)
a<-table.element(a,'T-STAT',header=TRUE)
a<-table.element(a,'P-value',header=TRUE)
a<-table.row.end(a)
for (i in 1:par1) {
a<-table.row.start(a)
a<-table.element(a,i,header=TRUE)
a<-table.element(a,round(mypacf[i],6))
mytstat <- mypacf[i]*sqrtn
a<-table.element(a,round(mytstat,4))
a<-table.element(a,round(1-pt(abs(mytstat),lengthx),6))
a<-table.row.end(a)
}
a<-table.end(a)
table.save(a,file='mytable1.tab')