Free Statistics
of Irreproducible Research!
Description of Statistical Computation | |||||||||||||||||||||||||||||||||||||||||
|---|---|---|---|---|---|---|---|---|---|---|---|---|---|---|---|---|---|---|---|---|---|---|---|---|---|---|---|---|---|---|---|---|---|---|---|---|---|---|---|---|---|
| Author's title | |||||||||||||||||||||||||||||||||||||||||
| Author | *The author of this computation has been verified* | ||||||||||||||||||||||||||||||||||||||||
| R Software Module | rwasp_univariatedataseries.wasp | ||||||||||||||||||||||||||||||||||||||||
| Title produced by software | Univariate Data Series | ||||||||||||||||||||||||||||||||||||||||
| Date of computation | Fri, 05 Dec 2008 02:24:52 -0700 | ||||||||||||||||||||||||||||||||||||||||
| Cite this page as follows | Statistical Computations at FreeStatistics.org, Office for Research Development and Education, URL https://freestatistics.org/blog/index.php?v=date/2008/Dec/05/t122846914031rt7qgk356p8em.htm/, Retrieved Thu, 16 May 2024 14:56:41 +0000 | ||||||||||||||||||||||||||||||||||||||||
| Statistical Computations at FreeStatistics.org, Office for Research Development and Education, URL https://freestatistics.org/blog/index.php?pk=29080, Retrieved Thu, 16 May 2024 14:56:41 +0000 | |||||||||||||||||||||||||||||||||||||||||
| QR Codes: | |||||||||||||||||||||||||||||||||||||||||
|
| |||||||||||||||||||||||||||||||||||||||||
| Original text written by user: | |||||||||||||||||||||||||||||||||||||||||
| IsPrivate? | No (this computation is public) | ||||||||||||||||||||||||||||||||||||||||
| User-defined keywords | |||||||||||||||||||||||||||||||||||||||||
| Estimated Impact | 232 | ||||||||||||||||||||||||||||||||||||||||
Tree of Dependent Computations | |||||||||||||||||||||||||||||||||||||||||
| Family? (F = Feedback message, R = changed R code, M = changed R Module, P = changed Parameters, D = changed Data) | |||||||||||||||||||||||||||||||||||||||||
| - [Univariate Data Series] [Run sequence plot...] [2008-12-02 21:59:14] [ed2ba3b6182103c15c0ab511ae4e6284] - PD [Univariate Data Series] [Run sequence plot...] [2008-12-05 09:24:52] [a8228479d4547a92e2d3f176a5299609] [Current] - RMPD [Central Tendency] [central tendency ...] [2008-12-05 09:27:45] [ed2ba3b6182103c15c0ab511ae4e6284] - RMPD [Percentiles] [Percentielen HICP...] [2008-12-05 09:31:12] [ed2ba3b6182103c15c0ab511ae4e6284] - RMPD [Harrell-Davis Quantiles] [Quantielen van HI...] [2008-12-05 09:35:07] [ed2ba3b6182103c15c0ab511ae4e6284] - RMPD [Univariate Explorative Data Analysis] [Univariate model ...] [2008-12-05 09:39:50] [ed2ba3b6182103c15c0ab511ae4e6284] - RMPD [Bootstrap Plot - Central Tendency] [Bootstrap (500 si...] [2008-12-05 09:42:16] [ed2ba3b6182103c15c0ab511ae4e6284] - RMPD [Mean Plot] [mean plot HICP al...] [2008-12-05 09:47:17] [ed2ba3b6182103c15c0ab511ae4e6284] | |||||||||||||||||||||||||||||||||||||||||
| Feedback Forum | |||||||||||||||||||||||||||||||||||||||||
Post a new message | |||||||||||||||||||||||||||||||||||||||||
Dataset | |||||||||||||||||||||||||||||||||||||||||
| Dataseries X: | |||||||||||||||||||||||||||||||||||||||||
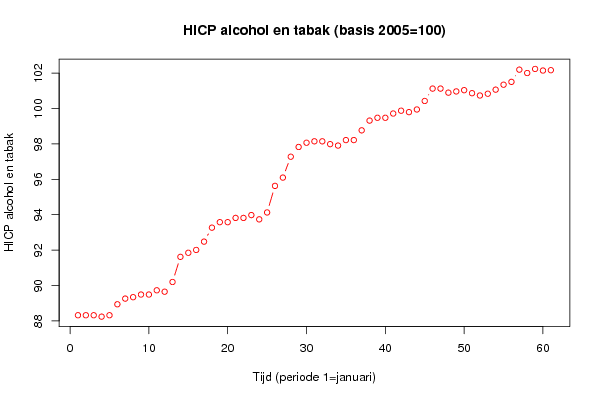
88.32 88.32 88.32 88.24 88.32 88.94 89.26 89.34 89.49 89.49 89.73 89.65 90.20 91.62 91.85 92.01 92.48 93.27 93.58 93.58 93.82 93.82 93.98 93.74 94.13 95.63 96.10 97.28 97.83 98.07 98.15 98.15 97.99 97.91 98.22 98.22 98.77 99.32 99.48 99.48 99.72 99.88 99.80 99.95 100.43 101.13 101.13 100.90 100.97 101.04 100.87 100.74 100.84 101.07 101.35 101.51 102.20 102.01 102.24 102.15 102.17 | |||||||||||||||||||||||||||||||||||||||||
Tables (Output of Computation) | |||||||||||||||||||||||||||||||||||||||||
| |||||||||||||||||||||||||||||||||||||||||
Figures (Output of Computation) | |||||||||||||||||||||||||||||||||||||||||
Input Parameters & R Code | |||||||||||||||||||||||||||||||||||||||||
| Parameters (Session): | |||||||||||||||||||||||||||||||||||||||||
| par1 = HICP alcohol en tabak ; par2 = http://epp.eurostat.ec.europa.eu/portal/page?_pageid=1996,39140985&_dad=portal&_schema=PORTAL&screen=detailref&language=en&product=EUROIND&root=EUROIND/shorties/euro_cp/cp020 ; par3 = geharmoniseerde consumptieprijsindex van Alcohol en tabak ; | |||||||||||||||||||||||||||||||||||||||||
| Parameters (R input): | |||||||||||||||||||||||||||||||||||||||||
| par1 = HICP alcohol en tabak ; par2 = http://epp.eurostat.ec.europa.eu/portal/page?_pageid=1996,39140985&_dad=portal&_schema=PORTAL&screen=detailref&language=en&product=EUROIND&root=EUROIND/shorties/euro_cp/cp020 ; par3 = geharmoniseerde consumptieprijsindex van Alcohol en tabak ; | |||||||||||||||||||||||||||||||||||||||||
| R code (references can be found in the software module): | |||||||||||||||||||||||||||||||||||||||||
bitmap(file='test1.png') | |||||||||||||||||||||||||||||||||||||||||