Free Statistics

of Irreproducible Research!

Author's title

Author*Unverified author*
R Software Modulerwasp_autocorrelation.wasp
Title produced by software(Partial) Autocorrelation Function
Date of computationWed, 03 Dec 2008 11:19:35 -0700
Cite this page as followsStatistical Computations at FreeStatistics.org, Office for Research Development and Education, URL https://freestatistics.org/blog/index.php?v=date/2008/Dec/03/t1228328577fs6ppo0lwa8ppix.htm/, Retrieved Fri, 17 May 2024 17:08:55 +0000
Statistical Computations at FreeStatistics.org, Office for Research Development and Education, URL https://freestatistics.org/blog/index.php?pk=28835, Retrieved Fri, 17 May 2024 17:08:55 +0000
QR Codes:

Original text written by user:
IsPrivate?No (this computation is public)
User-defined keywords
Estimated Impact188
Family? (F = Feedback message, R = changed R code, M = changed R Module, P = changed Parameters, D = changed Data)
-       [(Partial) Autocorrelation Function] [(P)ACF Producten ...] [2008-12-03 18:19:35] [d41d8cd98f00b204e9800998ecf8427e] [Current]
Feedback Forum

Post a new message
Dataseries X:
98.4
99.4
108.8
112.6
104.4
112.2
81.1
97.1
112.6
113.8
107.8
103.2
103.3
101.2
107.7
110.4
101.9
115.9
89.9
88.6
117.2
123.9
100
103.6
94.1
98.7
119.5
112.7
104.4
124.7
89.1
97
121.6
118.8
114
111.5
97.2
102.5
113.4
109.8
104.9
126.1
80
96.8
117.2
112.3
117.3
111.1
102.2
104.3
122.9
107.6
121.3
131.5
89
104.4
128.9
135.9
133.3
121.3
120.5
120.4
137.9
126.1
133.2
151.1
105
119
140.4
156.6
137.1
122.7
125.8


Summary of computational transaction
Raw Inputview raw input (R code)
Raw Outputview raw output of R engine
Computing time1 seconds
R Server'George Udny Yule' @ 72.249.76.132

\begin{tabular}{lllllllll}
\hline
Summary of computational transaction \tabularnewline
Raw Input & view raw input (R code)  \tabularnewline
Raw Output & view raw output of R engine  \tabularnewline
Computing time & 1 seconds \tabularnewline
R Server & 'George Udny Yule' @ 72.249.76.132 \tabularnewline
\hline
\end{tabular}
%Source: https://freestatistics.org/blog/index.php?pk=28835&T=0

[TABLE]
[ROW][C]Summary of computational transaction[/C][/ROW]
[ROW][C]Raw Input[/C][C]view raw input (R code) [/C][/ROW]
[ROW][C]Raw Output[/C][C]view raw output of R engine [/C][/ROW]
[ROW][C]Computing time[/C][C]1 seconds[/C][/ROW]
[ROW][C]R Server[/C][C]'George Udny Yule' @ 72.249.76.132[/C][/ROW]
[/TABLE]
Source: https://freestatistics.org/blog/index.php?pk=28835&T=0

Globally Unique Identifier (entire table): ba.freestatistics.org/blog/index.php?pk=28835&T=0

As an alternative you can also use a QR Code:  

The GUIDs for individual cells are displayed in the table below:

Summary of computational transaction
Raw Inputview raw input (R code)
Raw Outputview raw output of R engine
Computing time1 seconds
R Server'George Udny Yule' @ 72.249.76.132


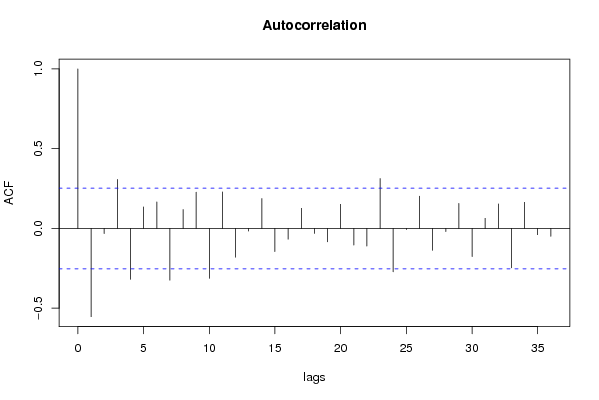
Autocorrelation Function
Time lag kACF(k)T-STATP-value
1-0.552979-4.28343.4e-05
2-0.032045-0.24820.402405
30.307052.37840.010295
4-0.318966-2.47070.008172
50.135021.04590.14991
60.1660851.28650.101608
7-0.324602-2.51440.007312
80.1185010.91790.181171
90.2274771.7620.041579
10-0.312307-2.41910.009304
110.2289491.77340.040616
12-0.180472-1.39790.083641
13-0.016439-0.12730.449549
140.1875461.45270.075755
15-0.144841-1.12190.13318
16-0.0671-0.51980.302574
170.1263410.97860.165846
18-0.031383-0.24310.404383
19-0.083852-0.64950.259243
200.1515881.17420.122478
21-0.104304-0.80790.21116
22-0.110157-0.85330.19845
230.3128612.42340.009204
24-0.272049-2.10730.019641
25-0.007146-0.05540.47802
260.2023361.56730.061154
27-0.137303-1.06350.145898
28-0.019498-0.1510.440227
290.1565851.21290.11496
30-0.17608-1.36390.088846
310.0634240.49130.31251
320.1540441.19320.11874
33-0.247154-1.91440.030168
340.1638011.26880.104707
35-0.038866-0.30110.382205
36-0.049256-0.38150.352078

\begin{tabular}{lllllllll}
\hline
Autocorrelation Function \tabularnewline
Time lag k & ACF(k) & T-STAT & P-value \tabularnewline
1 & -0.552979 & -4.2834 & 3.4e-05 \tabularnewline
2 & -0.032045 & -0.2482 & 0.402405 \tabularnewline
3 & 0.30705 & 2.3784 & 0.010295 \tabularnewline
4 & -0.318966 & -2.4707 & 0.008172 \tabularnewline
5 & 0.13502 & 1.0459 & 0.14991 \tabularnewline
6 & 0.166085 & 1.2865 & 0.101608 \tabularnewline
7 & -0.324602 & -2.5144 & 0.007312 \tabularnewline
8 & 0.118501 & 0.9179 & 0.181171 \tabularnewline
9 & 0.227477 & 1.762 & 0.041579 \tabularnewline
10 & -0.312307 & -2.4191 & 0.009304 \tabularnewline
11 & 0.228949 & 1.7734 & 0.040616 \tabularnewline
12 & -0.180472 & -1.3979 & 0.083641 \tabularnewline
13 & -0.016439 & -0.1273 & 0.449549 \tabularnewline
14 & 0.187546 & 1.4527 & 0.075755 \tabularnewline
15 & -0.144841 & -1.1219 & 0.13318 \tabularnewline
16 & -0.0671 & -0.5198 & 0.302574 \tabularnewline
17 & 0.126341 & 0.9786 & 0.165846 \tabularnewline
18 & -0.031383 & -0.2431 & 0.404383 \tabularnewline
19 & -0.083852 & -0.6495 & 0.259243 \tabularnewline
20 & 0.151588 & 1.1742 & 0.122478 \tabularnewline
21 & -0.104304 & -0.8079 & 0.21116 \tabularnewline
22 & -0.110157 & -0.8533 & 0.19845 \tabularnewline
23 & 0.312861 & 2.4234 & 0.009204 \tabularnewline
24 & -0.272049 & -2.1073 & 0.019641 \tabularnewline
25 & -0.007146 & -0.0554 & 0.47802 \tabularnewline
26 & 0.202336 & 1.5673 & 0.061154 \tabularnewline
27 & -0.137303 & -1.0635 & 0.145898 \tabularnewline
28 & -0.019498 & -0.151 & 0.440227 \tabularnewline
29 & 0.156585 & 1.2129 & 0.11496 \tabularnewline
30 & -0.17608 & -1.3639 & 0.088846 \tabularnewline
31 & 0.063424 & 0.4913 & 0.31251 \tabularnewline
32 & 0.154044 & 1.1932 & 0.11874 \tabularnewline
33 & -0.247154 & -1.9144 & 0.030168 \tabularnewline
34 & 0.163801 & 1.2688 & 0.104707 \tabularnewline
35 & -0.038866 & -0.3011 & 0.382205 \tabularnewline
36 & -0.049256 & -0.3815 & 0.352078 \tabularnewline
\hline
\end{tabular}
%Source: https://freestatistics.org/blog/index.php?pk=28835&T=1

[TABLE]
[ROW][C]Autocorrelation Function[/C][/ROW]
[ROW][C]Time lag k[/C][C]ACF(k)[/C][C]T-STAT[/C][C]P-value[/C][/ROW]
[ROW][C]1[/C][C]-0.552979[/C][C]-4.2834[/C][C]3.4e-05[/C][/ROW]
[ROW][C]2[/C][C]-0.032045[/C][C]-0.2482[/C][C]0.402405[/C][/ROW]
[ROW][C]3[/C][C]0.30705[/C][C]2.3784[/C][C]0.010295[/C][/ROW]
[ROW][C]4[/C][C]-0.318966[/C][C]-2.4707[/C][C]0.008172[/C][/ROW]
[ROW][C]5[/C][C]0.13502[/C][C]1.0459[/C][C]0.14991[/C][/ROW]
[ROW][C]6[/C][C]0.166085[/C][C]1.2865[/C][C]0.101608[/C][/ROW]
[ROW][C]7[/C][C]-0.324602[/C][C]-2.5144[/C][C]0.007312[/C][/ROW]
[ROW][C]8[/C][C]0.118501[/C][C]0.9179[/C][C]0.181171[/C][/ROW]
[ROW][C]9[/C][C]0.227477[/C][C]1.762[/C][C]0.041579[/C][/ROW]
[ROW][C]10[/C][C]-0.312307[/C][C]-2.4191[/C][C]0.009304[/C][/ROW]
[ROW][C]11[/C][C]0.228949[/C][C]1.7734[/C][C]0.040616[/C][/ROW]
[ROW][C]12[/C][C]-0.180472[/C][C]-1.3979[/C][C]0.083641[/C][/ROW]
[ROW][C]13[/C][C]-0.016439[/C][C]-0.1273[/C][C]0.449549[/C][/ROW]
[ROW][C]14[/C][C]0.187546[/C][C]1.4527[/C][C]0.075755[/C][/ROW]
[ROW][C]15[/C][C]-0.144841[/C][C]-1.1219[/C][C]0.13318[/C][/ROW]
[ROW][C]16[/C][C]-0.0671[/C][C]-0.5198[/C][C]0.302574[/C][/ROW]
[ROW][C]17[/C][C]0.126341[/C][C]0.9786[/C][C]0.165846[/C][/ROW]
[ROW][C]18[/C][C]-0.031383[/C][C]-0.2431[/C][C]0.404383[/C][/ROW]
[ROW][C]19[/C][C]-0.083852[/C][C]-0.6495[/C][C]0.259243[/C][/ROW]
[ROW][C]20[/C][C]0.151588[/C][C]1.1742[/C][C]0.122478[/C][/ROW]
[ROW][C]21[/C][C]-0.104304[/C][C]-0.8079[/C][C]0.21116[/C][/ROW]
[ROW][C]22[/C][C]-0.110157[/C][C]-0.8533[/C][C]0.19845[/C][/ROW]
[ROW][C]23[/C][C]0.312861[/C][C]2.4234[/C][C]0.009204[/C][/ROW]
[ROW][C]24[/C][C]-0.272049[/C][C]-2.1073[/C][C]0.019641[/C][/ROW]
[ROW][C]25[/C][C]-0.007146[/C][C]-0.0554[/C][C]0.47802[/C][/ROW]
[ROW][C]26[/C][C]0.202336[/C][C]1.5673[/C][C]0.061154[/C][/ROW]
[ROW][C]27[/C][C]-0.137303[/C][C]-1.0635[/C][C]0.145898[/C][/ROW]
[ROW][C]28[/C][C]-0.019498[/C][C]-0.151[/C][C]0.440227[/C][/ROW]
[ROW][C]29[/C][C]0.156585[/C][C]1.2129[/C][C]0.11496[/C][/ROW]
[ROW][C]30[/C][C]-0.17608[/C][C]-1.3639[/C][C]0.088846[/C][/ROW]
[ROW][C]31[/C][C]0.063424[/C][C]0.4913[/C][C]0.31251[/C][/ROW]
[ROW][C]32[/C][C]0.154044[/C][C]1.1932[/C][C]0.11874[/C][/ROW]
[ROW][C]33[/C][C]-0.247154[/C][C]-1.9144[/C][C]0.030168[/C][/ROW]
[ROW][C]34[/C][C]0.163801[/C][C]1.2688[/C][C]0.104707[/C][/ROW]
[ROW][C]35[/C][C]-0.038866[/C][C]-0.3011[/C][C]0.382205[/C][/ROW]
[ROW][C]36[/C][C]-0.049256[/C][C]-0.3815[/C][C]0.352078[/C][/ROW]
[/TABLE]
Source: https://freestatistics.org/blog/index.php?pk=28835&T=1

Globally Unique Identifier (entire table): ba.freestatistics.org/blog/index.php?pk=28835&T=1

As an alternative you can also use a QR Code:  

The GUIDs for individual cells are displayed in the table below:

Autocorrelation Function
Time lag kACF(k)T-STATP-value
1-0.552979-4.28343.4e-05
2-0.032045-0.24820.402405
30.307052.37840.010295
4-0.318966-2.47070.008172
50.135021.04590.14991
60.1660851.28650.101608
7-0.324602-2.51440.007312
80.1185010.91790.181171
90.2274771.7620.041579
10-0.312307-2.41910.009304
110.2289491.77340.040616
12-0.180472-1.39790.083641
13-0.016439-0.12730.449549
140.1875461.45270.075755
15-0.144841-1.12190.13318
16-0.0671-0.51980.302574
170.1263410.97860.165846
18-0.031383-0.24310.404383
19-0.083852-0.64950.259243
200.1515881.17420.122478
21-0.104304-0.80790.21116
22-0.110157-0.85330.19845
230.3128612.42340.009204
24-0.272049-2.10730.019641
25-0.007146-0.05540.47802
260.2023361.56730.061154
27-0.137303-1.06350.145898
28-0.019498-0.1510.440227
290.1565851.21290.11496
30-0.17608-1.36390.088846
310.0634240.49130.31251
320.1540441.19320.11874
33-0.247154-1.91440.030168
340.1638011.26880.104707
35-0.038866-0.30110.382205
36-0.049256-0.38150.352078


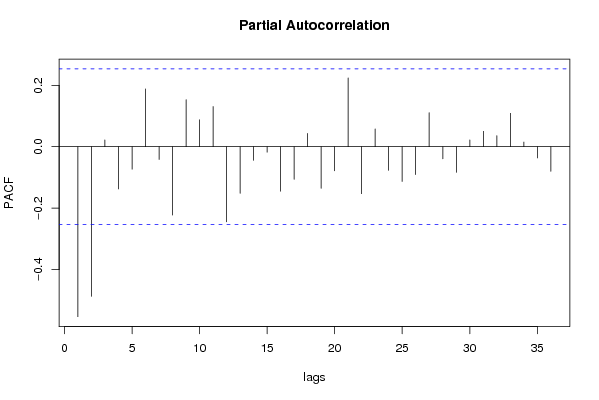
Partial Autocorrelation Function
Time lag kPACF(k)T-STATP-value
1-0.552979-4.28343.4e-05
2-0.486637-3.76950.000188
30.0219050.16970.432917
4-0.13733-1.06380.145852
5-0.07312-0.56640.286622
60.1881341.45730.075127
7-0.041317-0.320.375024
8-0.22233-1.72220.045096
90.1529111.18440.120455
100.0875390.67810.250166
110.1307221.01260.157667
12-0.244569-1.89440.031495
13-0.151716-1.17520.122282
14-0.044219-0.34250.366578
15-0.01792-0.13880.445032
16-0.14456-1.11980.13364
17-0.105915-0.82040.207613
180.0432850.33530.36929
19-0.13533-1.04830.149361
20-0.078607-0.60890.272449
210.2236421.73230.044177
22-0.152785-1.18350.120645
230.0577720.44750.328062
24-0.076844-0.59520.276963
25-0.112907-0.87460.192647
26-0.090712-0.70270.242494
270.1105780.85650.197555
28-0.039549-0.30630.380201
29-0.083438-0.64630.260272
300.0220320.17070.432532
310.0502730.38940.349175
320.0358790.27790.391014
330.1085380.84070.201918
340.0151610.11740.453452
35-0.036393-0.28190.389496
36-0.080003-0.61970.268901

\begin{tabular}{lllllllll}
\hline
Partial Autocorrelation Function \tabularnewline
Time lag k & PACF(k) & T-STAT & P-value \tabularnewline
1 & -0.552979 & -4.2834 & 3.4e-05 \tabularnewline
2 & -0.486637 & -3.7695 & 0.000188 \tabularnewline
3 & 0.021905 & 0.1697 & 0.432917 \tabularnewline
4 & -0.13733 & -1.0638 & 0.145852 \tabularnewline
5 & -0.07312 & -0.5664 & 0.286622 \tabularnewline
6 & 0.188134 & 1.4573 & 0.075127 \tabularnewline
7 & -0.041317 & -0.32 & 0.375024 \tabularnewline
8 & -0.22233 & -1.7222 & 0.045096 \tabularnewline
9 & 0.152911 & 1.1844 & 0.120455 \tabularnewline
10 & 0.087539 & 0.6781 & 0.250166 \tabularnewline
11 & 0.130722 & 1.0126 & 0.157667 \tabularnewline
12 & -0.244569 & -1.8944 & 0.031495 \tabularnewline
13 & -0.151716 & -1.1752 & 0.122282 \tabularnewline
14 & -0.044219 & -0.3425 & 0.366578 \tabularnewline
15 & -0.01792 & -0.1388 & 0.445032 \tabularnewline
16 & -0.14456 & -1.1198 & 0.13364 \tabularnewline
17 & -0.105915 & -0.8204 & 0.207613 \tabularnewline
18 & 0.043285 & 0.3353 & 0.36929 \tabularnewline
19 & -0.13533 & -1.0483 & 0.149361 \tabularnewline
20 & -0.078607 & -0.6089 & 0.272449 \tabularnewline
21 & 0.223642 & 1.7323 & 0.044177 \tabularnewline
22 & -0.152785 & -1.1835 & 0.120645 \tabularnewline
23 & 0.057772 & 0.4475 & 0.328062 \tabularnewline
24 & -0.076844 & -0.5952 & 0.276963 \tabularnewline
25 & -0.112907 & -0.8746 & 0.192647 \tabularnewline
26 & -0.090712 & -0.7027 & 0.242494 \tabularnewline
27 & 0.110578 & 0.8565 & 0.197555 \tabularnewline
28 & -0.039549 & -0.3063 & 0.380201 \tabularnewline
29 & -0.083438 & -0.6463 & 0.260272 \tabularnewline
30 & 0.022032 & 0.1707 & 0.432532 \tabularnewline
31 & 0.050273 & 0.3894 & 0.349175 \tabularnewline
32 & 0.035879 & 0.2779 & 0.391014 \tabularnewline
33 & 0.108538 & 0.8407 & 0.201918 \tabularnewline
34 & 0.015161 & 0.1174 & 0.453452 \tabularnewline
35 & -0.036393 & -0.2819 & 0.389496 \tabularnewline
36 & -0.080003 & -0.6197 & 0.268901 \tabularnewline
\hline
\end{tabular}
%Source: https://freestatistics.org/blog/index.php?pk=28835&T=2

[TABLE]
[ROW][C]Partial Autocorrelation Function[/C][/ROW]
[ROW][C]Time lag k[/C][C]PACF(k)[/C][C]T-STAT[/C][C]P-value[/C][/ROW]
[ROW][C]1[/C][C]-0.552979[/C][C]-4.2834[/C][C]3.4e-05[/C][/ROW]
[ROW][C]2[/C][C]-0.486637[/C][C]-3.7695[/C][C]0.000188[/C][/ROW]
[ROW][C]3[/C][C]0.021905[/C][C]0.1697[/C][C]0.432917[/C][/ROW]
[ROW][C]4[/C][C]-0.13733[/C][C]-1.0638[/C][C]0.145852[/C][/ROW]
[ROW][C]5[/C][C]-0.07312[/C][C]-0.5664[/C][C]0.286622[/C][/ROW]
[ROW][C]6[/C][C]0.188134[/C][C]1.4573[/C][C]0.075127[/C][/ROW]
[ROW][C]7[/C][C]-0.041317[/C][C]-0.32[/C][C]0.375024[/C][/ROW]
[ROW][C]8[/C][C]-0.22233[/C][C]-1.7222[/C][C]0.045096[/C][/ROW]
[ROW][C]9[/C][C]0.152911[/C][C]1.1844[/C][C]0.120455[/C][/ROW]
[ROW][C]10[/C][C]0.087539[/C][C]0.6781[/C][C]0.250166[/C][/ROW]
[ROW][C]11[/C][C]0.130722[/C][C]1.0126[/C][C]0.157667[/C][/ROW]
[ROW][C]12[/C][C]-0.244569[/C][C]-1.8944[/C][C]0.031495[/C][/ROW]
[ROW][C]13[/C][C]-0.151716[/C][C]-1.1752[/C][C]0.122282[/C][/ROW]
[ROW][C]14[/C][C]-0.044219[/C][C]-0.3425[/C][C]0.366578[/C][/ROW]
[ROW][C]15[/C][C]-0.01792[/C][C]-0.1388[/C][C]0.445032[/C][/ROW]
[ROW][C]16[/C][C]-0.14456[/C][C]-1.1198[/C][C]0.13364[/C][/ROW]
[ROW][C]17[/C][C]-0.105915[/C][C]-0.8204[/C][C]0.207613[/C][/ROW]
[ROW][C]18[/C][C]0.043285[/C][C]0.3353[/C][C]0.36929[/C][/ROW]
[ROW][C]19[/C][C]-0.13533[/C][C]-1.0483[/C][C]0.149361[/C][/ROW]
[ROW][C]20[/C][C]-0.078607[/C][C]-0.6089[/C][C]0.272449[/C][/ROW]
[ROW][C]21[/C][C]0.223642[/C][C]1.7323[/C][C]0.044177[/C][/ROW]
[ROW][C]22[/C][C]-0.152785[/C][C]-1.1835[/C][C]0.120645[/C][/ROW]
[ROW][C]23[/C][C]0.057772[/C][C]0.4475[/C][C]0.328062[/C][/ROW]
[ROW][C]24[/C][C]-0.076844[/C][C]-0.5952[/C][C]0.276963[/C][/ROW]
[ROW][C]25[/C][C]-0.112907[/C][C]-0.8746[/C][C]0.192647[/C][/ROW]
[ROW][C]26[/C][C]-0.090712[/C][C]-0.7027[/C][C]0.242494[/C][/ROW]
[ROW][C]27[/C][C]0.110578[/C][C]0.8565[/C][C]0.197555[/C][/ROW]
[ROW][C]28[/C][C]-0.039549[/C][C]-0.3063[/C][C]0.380201[/C][/ROW]
[ROW][C]29[/C][C]-0.083438[/C][C]-0.6463[/C][C]0.260272[/C][/ROW]
[ROW][C]30[/C][C]0.022032[/C][C]0.1707[/C][C]0.432532[/C][/ROW]
[ROW][C]31[/C][C]0.050273[/C][C]0.3894[/C][C]0.349175[/C][/ROW]
[ROW][C]32[/C][C]0.035879[/C][C]0.2779[/C][C]0.391014[/C][/ROW]
[ROW][C]33[/C][C]0.108538[/C][C]0.8407[/C][C]0.201918[/C][/ROW]
[ROW][C]34[/C][C]0.015161[/C][C]0.1174[/C][C]0.453452[/C][/ROW]
[ROW][C]35[/C][C]-0.036393[/C][C]-0.2819[/C][C]0.389496[/C][/ROW]
[ROW][C]36[/C][C]-0.080003[/C][C]-0.6197[/C][C]0.268901[/C][/ROW]
[/TABLE]
Source: https://freestatistics.org/blog/index.php?pk=28835&T=2

Globally Unique Identifier (entire table): ba.freestatistics.org/blog/index.php?pk=28835&T=2

As an alternative you can also use a QR Code:  

The GUIDs for individual cells are displayed in the table below:

Partial Autocorrelation Function
Time lag kPACF(k)T-STATP-value
1-0.552979-4.28343.4e-05
2-0.486637-3.76950.000188
30.0219050.16970.432917
4-0.13733-1.06380.145852
5-0.07312-0.56640.286622
60.1881341.45730.075127
7-0.041317-0.320.375024
8-0.22233-1.72220.045096
90.1529111.18440.120455
100.0875390.67810.250166
110.1307221.01260.157667
12-0.244569-1.89440.031495
13-0.151716-1.17520.122282
14-0.044219-0.34250.366578
15-0.01792-0.13880.445032
16-0.14456-1.11980.13364
17-0.105915-0.82040.207613
180.0432850.33530.36929
19-0.13533-1.04830.149361
20-0.078607-0.60890.272449
210.2236421.73230.044177
22-0.152785-1.18350.120645
230.0577720.44750.328062
24-0.076844-0.59520.276963
25-0.112907-0.87460.192647
26-0.090712-0.70270.242494
270.1105780.85650.197555
28-0.039549-0.30630.380201
29-0.083438-0.64630.260272
300.0220320.17070.432532
310.0502730.38940.349175
320.0358790.27790.391014
330.1085380.84070.201918
340.0151610.11740.453452
35-0.036393-0.28190.389496
36-0.080003-0.61970.268901


Parameters (Session):
par1 = -0.4 ; par2 = 0 ; par3 = 1 ; par4 = 12 ;
Parameters (R input):
par1 = 36 ; par2 = -0.8 ; par3 = 1 ; par4 = 1 ; par5 = 12 ;
R code (references can be found in the software module):
if (par1 == 'Default') {
par1 = 10*log10(length(x))
} else {
par1 <- as.numeric(par1)
}
par2 <- as.numeric(par2)
par3 <- as.numeric(par3)
par4 <- as.numeric(par4)
par5 <- as.numeric(par5)
if (par2 == 0) {
x <- log(x)
} else {
x <- (x ^ par2 - 1) / par2
}
if (par3 > 0) x <- diff(x,lag=1,difference=par3)
if (par4 > 0) x <- diff(x,lag=par5,difference=par4)
bitmap(file='pic1.png')
racf <- acf(x,par1,main='Autocorrelation',xlab='lags',ylab='ACF')
dev.off()
bitmap(file='pic2.png')
rpacf <- pacf(x,par1,main='Partial Autocorrelation',xlab='lags',ylab='PACF')
dev.off()
(myacf <- c(racf$acf))
(mypacf <- c(rpacf$acf))
lengthx <- length(x)
sqrtn <- sqrt(lengthx)
load(file='createtable')
a<-table.start()
a<-table.row.start(a)
a<-table.element(a,'Autocorrelation Function',4,TRUE)
a<-table.row.end(a)
a<-table.row.start(a)
a<-table.element(a,'Time lag k',header=TRUE)
a<-table.element(a,hyperlink('basics.htm','ACF(k)','click here for more information about the Autocorrelation Function'),header=TRUE)
a<-table.element(a,'T-STAT',header=TRUE)
a<-table.element(a,'P-value',header=TRUE)
a<-table.row.end(a)
for (i in 2:(par1+1)) {
a<-table.row.start(a)
a<-table.element(a,i-1,header=TRUE)
a<-table.element(a,round(myacf[i],6))
mytstat <- myacf[i]*sqrtn
a<-table.element(a,round(mytstat,4))
a<-table.element(a,round(1-pt(abs(mytstat),lengthx),6))
a<-table.row.end(a)
}
a<-table.end(a)
table.save(a,file='mytable.tab')
a<-table.start()
a<-table.row.start(a)
a<-table.element(a,'Partial Autocorrelation Function',4,TRUE)
a<-table.row.end(a)
a<-table.row.start(a)
a<-table.element(a,'Time lag k',header=TRUE)
a<-table.element(a,hyperlink('basics.htm','PACF(k)','click here for more information about the Partial Autocorrelation Function'),header=TRUE)
a<-table.element(a,'T-STAT',header=TRUE)
a<-table.element(a,'P-value',header=TRUE)
a<-table.row.end(a)
for (i in 1:par1) {
a<-table.row.start(a)
a<-table.element(a,i,header=TRUE)
a<-table.element(a,round(mypacf[i],6))
mytstat <- mypacf[i]*sqrtn
a<-table.element(a,round(mytstat,4))
a<-table.element(a,round(1-pt(abs(mytstat),lengthx),6))
a<-table.row.end(a)
}
a<-table.end(a)
table.save(a,file='mytable1.tab')