Free Statistics

of Irreproducible Research!

Author's title

Author*The author of this computation has been verified*
R Software Modulerwasp_autocorrelation.wasp
Title produced by software(Partial) Autocorrelation Function
Date of computationWed, 03 Dec 2008 10:15:34 -0700
Cite this page as followsStatistical Computations at FreeStatistics.org, Office for Research Development and Education, URL https://freestatistics.org/blog/index.php?v=date/2008/Dec/03/t12283246541th2avmgkzquks5.htm/, Retrieved Fri, 17 May 2024 00:46:32 +0000
Statistical Computations at FreeStatistics.org, Office for Research Development and Education, URL https://freestatistics.org/blog/index.php?pk=28806, Retrieved Fri, 17 May 2024 00:46:32 +0000
QR Codes:

Original text written by user:
IsPrivate?No (this computation is public)
User-defined keywords
Estimated Impact179
Family? (F = Feedback message, R = changed R code, M = changed R Module, P = changed Parameters, D = changed Data)
F       [(Partial) Autocorrelation Function] [ACF d=1 D=1] [2008-12-03 17:15:34] [21d7d81e7693ad6dde5aadefb1046611] [Current]
Feedback Forum
2008-12-15 18:03:45 [Davy De Nef] [reply
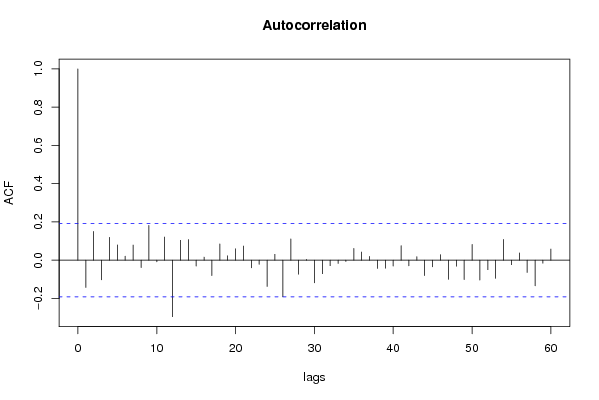
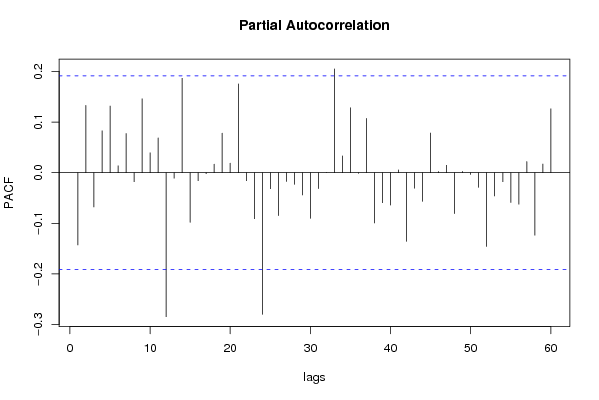
Hier heeft de student d=1 en D=1 gesteld. Daardoor is de dalende langetermijn trend verdwnenen en is ook de seizoenaliteit uit de tijdreeks weggehaald.

Post a new message
Dataseries X:
206010
198112
194519
185705
180173
176142
203401
221902
197378
185001
176356
180449
180144
173666
165688
161570
156145
153730
182698
200765
176512
166618
158644
159585
163095
159044
155511
153745
150569
150605
179612
194690
189917
184128
175335
179566
181140
177876
175041
169292
166070
166972
206348
215706
202108
195411
193111
195198
198770
194163
190420
189733
186029
191531
232571
243477
227247
217859
208679
213188
216234
213586
209465
204045
200237
203666
241476
260307
243324
244460
233575
237217
235243
230354
227184
221678
217142
219452
256446
265845
248624
241114
229245
231805
219277
219313
212610
214771
211142
211457
240048
240636
230580
208795
197922
194596
194581
185686
178106
172608
167302
168053
202300
202388
182516
173476
166444
171297
169701
164182
161914
159612
151001
158114
186530
187069
174330
169362


Summary of computational transaction
Raw Inputview raw input (R code)
Raw Outputview raw output of R engine
Computing time1 seconds
R Server'George Udny Yule' @ 72.249.76.132

\begin{tabular}{lllllllll}
\hline
Summary of computational transaction \tabularnewline
Raw Input & view raw input (R code)  \tabularnewline
Raw Output & view raw output of R engine  \tabularnewline
Computing time & 1 seconds \tabularnewline
R Server & 'George Udny Yule' @ 72.249.76.132 \tabularnewline
\hline
\end{tabular}
%Source: https://freestatistics.org/blog/index.php?pk=28806&T=0

[TABLE]
[ROW][C]Summary of computational transaction[/C][/ROW]
[ROW][C]Raw Input[/C][C]view raw input (R code) [/C][/ROW]
[ROW][C]Raw Output[/C][C]view raw output of R engine [/C][/ROW]
[ROW][C]Computing time[/C][C]1 seconds[/C][/ROW]
[ROW][C]R Server[/C][C]'George Udny Yule' @ 72.249.76.132[/C][/ROW]
[/TABLE]
Source: https://freestatistics.org/blog/index.php?pk=28806&T=0

Globally Unique Identifier (entire table): ba.freestatistics.org/blog/index.php?pk=28806&T=0

As an alternative you can also use a QR Code:  

The GUIDs for individual cells are displayed in the table below:

Summary of computational transaction
Raw Inputview raw input (R code)
Raw Outputview raw output of R engine
Computing time1 seconds
R Server'George Udny Yule' @ 72.249.76.132


Autocorrelation Function
Time lag kACF(k)T-STATP-value
1-0.142705-1.46230.073324
20.1504591.54170.063072
3-0.10265-1.05180.147642
40.119221.22160.11229
50.0799670.81940.207203
60.0207840.2130.41588
70.0790310.80980.209937
8-0.038536-0.39490.346869
90.181431.85910.032906
10-0.008444-0.08650.465608
110.1209181.2390.109046
12-0.295359-3.02650.001556
130.1041081.06680.144256
140.1077181.10380.136106
15-0.030828-0.31590.376356
160.0159410.16330.43528
17-0.080768-0.82760.204879
180.0849940.87090.19289
190.022530.23090.408937
200.0596040.61080.271341
210.0739710.7580.22508
22-0.040145-0.41140.340822
23-0.021666-0.2220.412367
24-0.137698-1.4110.080602
250.030740.3150.376697
26-0.191628-1.96360.02611
270.1113551.14110.128222
28-0.073304-0.75110.227123
290.0037620.03860.48466
30-0.118683-1.21610.11333
31-0.070935-0.72690.234463
32-0.028761-0.29470.384397
33-0.016945-0.17360.431245
34-0.006468-0.06630.473641
350.0612670.62780.265749
360.0424360.43480.332285
370.0196860.20170.420262
38-0.043248-0.44320.329279
39-0.041643-0.42670.335232
40-0.030835-0.3160.376327
410.0760590.77940.218758
42-0.029369-0.30090.382028
430.0183350.18790.425667
44-0.080261-0.82240.206348
45-0.034563-0.35420.361962
460.0289470.29660.383671
47-0.099905-1.02370.154159
48-0.031731-0.32510.372858
49-0.101645-1.04150.150007
500.082180.84210.200824
51-0.103729-1.06290.145132
52-0.049859-0.51090.305247
53-0.094699-0.97040.167045
540.1082991.10970.134823
55-0.023745-0.24330.404119
560.0375650.38490.350536
57-0.063842-0.65420.25721
58-0.134171-1.37480.086053
59-0.015547-0.15930.436866
600.0579770.59410.276865

\begin{tabular}{lllllllll}
\hline
Autocorrelation Function \tabularnewline
Time lag k & ACF(k) & T-STAT & P-value \tabularnewline
1 & -0.142705 & -1.4623 & 0.073324 \tabularnewline
2 & 0.150459 & 1.5417 & 0.063072 \tabularnewline
3 & -0.10265 & -1.0518 & 0.147642 \tabularnewline
4 & 0.11922 & 1.2216 & 0.11229 \tabularnewline
5 & 0.079967 & 0.8194 & 0.207203 \tabularnewline
6 & 0.020784 & 0.213 & 0.41588 \tabularnewline
7 & 0.079031 & 0.8098 & 0.209937 \tabularnewline
8 & -0.038536 & -0.3949 & 0.346869 \tabularnewline
9 & 0.18143 & 1.8591 & 0.032906 \tabularnewline
10 & -0.008444 & -0.0865 & 0.465608 \tabularnewline
11 & 0.120918 & 1.239 & 0.109046 \tabularnewline
12 & -0.295359 & -3.0265 & 0.001556 \tabularnewline
13 & 0.104108 & 1.0668 & 0.144256 \tabularnewline
14 & 0.107718 & 1.1038 & 0.136106 \tabularnewline
15 & -0.030828 & -0.3159 & 0.376356 \tabularnewline
16 & 0.015941 & 0.1633 & 0.43528 \tabularnewline
17 & -0.080768 & -0.8276 & 0.204879 \tabularnewline
18 & 0.084994 & 0.8709 & 0.19289 \tabularnewline
19 & 0.02253 & 0.2309 & 0.408937 \tabularnewline
20 & 0.059604 & 0.6108 & 0.271341 \tabularnewline
21 & 0.073971 & 0.758 & 0.22508 \tabularnewline
22 & -0.040145 & -0.4114 & 0.340822 \tabularnewline
23 & -0.021666 & -0.222 & 0.412367 \tabularnewline
24 & -0.137698 & -1.411 & 0.080602 \tabularnewline
25 & 0.03074 & 0.315 & 0.376697 \tabularnewline
26 & -0.191628 & -1.9636 & 0.02611 \tabularnewline
27 & 0.111355 & 1.1411 & 0.128222 \tabularnewline
28 & -0.073304 & -0.7511 & 0.227123 \tabularnewline
29 & 0.003762 & 0.0386 & 0.48466 \tabularnewline
30 & -0.118683 & -1.2161 & 0.11333 \tabularnewline
31 & -0.070935 & -0.7269 & 0.234463 \tabularnewline
32 & -0.028761 & -0.2947 & 0.384397 \tabularnewline
33 & -0.016945 & -0.1736 & 0.431245 \tabularnewline
34 & -0.006468 & -0.0663 & 0.473641 \tabularnewline
35 & 0.061267 & 0.6278 & 0.265749 \tabularnewline
36 & 0.042436 & 0.4348 & 0.332285 \tabularnewline
37 & 0.019686 & 0.2017 & 0.420262 \tabularnewline
38 & -0.043248 & -0.4432 & 0.329279 \tabularnewline
39 & -0.041643 & -0.4267 & 0.335232 \tabularnewline
40 & -0.030835 & -0.316 & 0.376327 \tabularnewline
41 & 0.076059 & 0.7794 & 0.218758 \tabularnewline
42 & -0.029369 & -0.3009 & 0.382028 \tabularnewline
43 & 0.018335 & 0.1879 & 0.425667 \tabularnewline
44 & -0.080261 & -0.8224 & 0.206348 \tabularnewline
45 & -0.034563 & -0.3542 & 0.361962 \tabularnewline
46 & 0.028947 & 0.2966 & 0.383671 \tabularnewline
47 & -0.099905 & -1.0237 & 0.154159 \tabularnewline
48 & -0.031731 & -0.3251 & 0.372858 \tabularnewline
49 & -0.101645 & -1.0415 & 0.150007 \tabularnewline
50 & 0.08218 & 0.8421 & 0.200824 \tabularnewline
51 & -0.103729 & -1.0629 & 0.145132 \tabularnewline
52 & -0.049859 & -0.5109 & 0.305247 \tabularnewline
53 & -0.094699 & -0.9704 & 0.167045 \tabularnewline
54 & 0.108299 & 1.1097 & 0.134823 \tabularnewline
55 & -0.023745 & -0.2433 & 0.404119 \tabularnewline
56 & 0.037565 & 0.3849 & 0.350536 \tabularnewline
57 & -0.063842 & -0.6542 & 0.25721 \tabularnewline
58 & -0.134171 & -1.3748 & 0.086053 \tabularnewline
59 & -0.015547 & -0.1593 & 0.436866 \tabularnewline
60 & 0.057977 & 0.5941 & 0.276865 \tabularnewline
\hline
\end{tabular}
%Source: https://freestatistics.org/blog/index.php?pk=28806&T=1

[TABLE]
[ROW][C]Autocorrelation Function[/C][/ROW]
[ROW][C]Time lag k[/C][C]ACF(k)[/C][C]T-STAT[/C][C]P-value[/C][/ROW]
[ROW][C]1[/C][C]-0.142705[/C][C]-1.4623[/C][C]0.073324[/C][/ROW]
[ROW][C]2[/C][C]0.150459[/C][C]1.5417[/C][C]0.063072[/C][/ROW]
[ROW][C]3[/C][C]-0.10265[/C][C]-1.0518[/C][C]0.147642[/C][/ROW]
[ROW][C]4[/C][C]0.11922[/C][C]1.2216[/C][C]0.11229[/C][/ROW]
[ROW][C]5[/C][C]0.079967[/C][C]0.8194[/C][C]0.207203[/C][/ROW]
[ROW][C]6[/C][C]0.020784[/C][C]0.213[/C][C]0.41588[/C][/ROW]
[ROW][C]7[/C][C]0.079031[/C][C]0.8098[/C][C]0.209937[/C][/ROW]
[ROW][C]8[/C][C]-0.038536[/C][C]-0.3949[/C][C]0.346869[/C][/ROW]
[ROW][C]9[/C][C]0.18143[/C][C]1.8591[/C][C]0.032906[/C][/ROW]
[ROW][C]10[/C][C]-0.008444[/C][C]-0.0865[/C][C]0.465608[/C][/ROW]
[ROW][C]11[/C][C]0.120918[/C][C]1.239[/C][C]0.109046[/C][/ROW]
[ROW][C]12[/C][C]-0.295359[/C][C]-3.0265[/C][C]0.001556[/C][/ROW]
[ROW][C]13[/C][C]0.104108[/C][C]1.0668[/C][C]0.144256[/C][/ROW]
[ROW][C]14[/C][C]0.107718[/C][C]1.1038[/C][C]0.136106[/C][/ROW]
[ROW][C]15[/C][C]-0.030828[/C][C]-0.3159[/C][C]0.376356[/C][/ROW]
[ROW][C]16[/C][C]0.015941[/C][C]0.1633[/C][C]0.43528[/C][/ROW]
[ROW][C]17[/C][C]-0.080768[/C][C]-0.8276[/C][C]0.204879[/C][/ROW]
[ROW][C]18[/C][C]0.084994[/C][C]0.8709[/C][C]0.19289[/C][/ROW]
[ROW][C]19[/C][C]0.02253[/C][C]0.2309[/C][C]0.408937[/C][/ROW]
[ROW][C]20[/C][C]0.059604[/C][C]0.6108[/C][C]0.271341[/C][/ROW]
[ROW][C]21[/C][C]0.073971[/C][C]0.758[/C][C]0.22508[/C][/ROW]
[ROW][C]22[/C][C]-0.040145[/C][C]-0.4114[/C][C]0.340822[/C][/ROW]
[ROW][C]23[/C][C]-0.021666[/C][C]-0.222[/C][C]0.412367[/C][/ROW]
[ROW][C]24[/C][C]-0.137698[/C][C]-1.411[/C][C]0.080602[/C][/ROW]
[ROW][C]25[/C][C]0.03074[/C][C]0.315[/C][C]0.376697[/C][/ROW]
[ROW][C]26[/C][C]-0.191628[/C][C]-1.9636[/C][C]0.02611[/C][/ROW]
[ROW][C]27[/C][C]0.111355[/C][C]1.1411[/C][C]0.128222[/C][/ROW]
[ROW][C]28[/C][C]-0.073304[/C][C]-0.7511[/C][C]0.227123[/C][/ROW]
[ROW][C]29[/C][C]0.003762[/C][C]0.0386[/C][C]0.48466[/C][/ROW]
[ROW][C]30[/C][C]-0.118683[/C][C]-1.2161[/C][C]0.11333[/C][/ROW]
[ROW][C]31[/C][C]-0.070935[/C][C]-0.7269[/C][C]0.234463[/C][/ROW]
[ROW][C]32[/C][C]-0.028761[/C][C]-0.2947[/C][C]0.384397[/C][/ROW]
[ROW][C]33[/C][C]-0.016945[/C][C]-0.1736[/C][C]0.431245[/C][/ROW]
[ROW][C]34[/C][C]-0.006468[/C][C]-0.0663[/C][C]0.473641[/C][/ROW]
[ROW][C]35[/C][C]0.061267[/C][C]0.6278[/C][C]0.265749[/C][/ROW]
[ROW][C]36[/C][C]0.042436[/C][C]0.4348[/C][C]0.332285[/C][/ROW]
[ROW][C]37[/C][C]0.019686[/C][C]0.2017[/C][C]0.420262[/C][/ROW]
[ROW][C]38[/C][C]-0.043248[/C][C]-0.4432[/C][C]0.329279[/C][/ROW]
[ROW][C]39[/C][C]-0.041643[/C][C]-0.4267[/C][C]0.335232[/C][/ROW]
[ROW][C]40[/C][C]-0.030835[/C][C]-0.316[/C][C]0.376327[/C][/ROW]
[ROW][C]41[/C][C]0.076059[/C][C]0.7794[/C][C]0.218758[/C][/ROW]
[ROW][C]42[/C][C]-0.029369[/C][C]-0.3009[/C][C]0.382028[/C][/ROW]
[ROW][C]43[/C][C]0.018335[/C][C]0.1879[/C][C]0.425667[/C][/ROW]
[ROW][C]44[/C][C]-0.080261[/C][C]-0.8224[/C][C]0.206348[/C][/ROW]
[ROW][C]45[/C][C]-0.034563[/C][C]-0.3542[/C][C]0.361962[/C][/ROW]
[ROW][C]46[/C][C]0.028947[/C][C]0.2966[/C][C]0.383671[/C][/ROW]
[ROW][C]47[/C][C]-0.099905[/C][C]-1.0237[/C][C]0.154159[/C][/ROW]
[ROW][C]48[/C][C]-0.031731[/C][C]-0.3251[/C][C]0.372858[/C][/ROW]
[ROW][C]49[/C][C]-0.101645[/C][C]-1.0415[/C][C]0.150007[/C][/ROW]
[ROW][C]50[/C][C]0.08218[/C][C]0.8421[/C][C]0.200824[/C][/ROW]
[ROW][C]51[/C][C]-0.103729[/C][C]-1.0629[/C][C]0.145132[/C][/ROW]
[ROW][C]52[/C][C]-0.049859[/C][C]-0.5109[/C][C]0.305247[/C][/ROW]
[ROW][C]53[/C][C]-0.094699[/C][C]-0.9704[/C][C]0.167045[/C][/ROW]
[ROW][C]54[/C][C]0.108299[/C][C]1.1097[/C][C]0.134823[/C][/ROW]
[ROW][C]55[/C][C]-0.023745[/C][C]-0.2433[/C][C]0.404119[/C][/ROW]
[ROW][C]56[/C][C]0.037565[/C][C]0.3849[/C][C]0.350536[/C][/ROW]
[ROW][C]57[/C][C]-0.063842[/C][C]-0.6542[/C][C]0.25721[/C][/ROW]
[ROW][C]58[/C][C]-0.134171[/C][C]-1.3748[/C][C]0.086053[/C][/ROW]
[ROW][C]59[/C][C]-0.015547[/C][C]-0.1593[/C][C]0.436866[/C][/ROW]
[ROW][C]60[/C][C]0.057977[/C][C]0.5941[/C][C]0.276865[/C][/ROW]
[/TABLE]
Source: https://freestatistics.org/blog/index.php?pk=28806&T=1

Globally Unique Identifier (entire table): ba.freestatistics.org/blog/index.php?pk=28806&T=1

As an alternative you can also use a QR Code:  

The GUIDs for individual cells are displayed in the table below:

Autocorrelation Function
Time lag kACF(k)T-STATP-value
1-0.142705-1.46230.073324
20.1504591.54170.063072
3-0.10265-1.05180.147642
40.119221.22160.11229
50.0799670.81940.207203
60.0207840.2130.41588
70.0790310.80980.209937
8-0.038536-0.39490.346869
90.181431.85910.032906
10-0.008444-0.08650.465608
110.1209181.2390.109046
12-0.295359-3.02650.001556
130.1041081.06680.144256
140.1077181.10380.136106
15-0.030828-0.31590.376356
160.0159410.16330.43528
17-0.080768-0.82760.204879
180.0849940.87090.19289
190.022530.23090.408937
200.0596040.61080.271341
210.0739710.7580.22508
22-0.040145-0.41140.340822
23-0.021666-0.2220.412367
24-0.137698-1.4110.080602
250.030740.3150.376697
26-0.191628-1.96360.02611
270.1113551.14110.128222
28-0.073304-0.75110.227123
290.0037620.03860.48466
30-0.118683-1.21610.11333
31-0.070935-0.72690.234463
32-0.028761-0.29470.384397
33-0.016945-0.17360.431245
34-0.006468-0.06630.473641
350.0612670.62780.265749
360.0424360.43480.332285
370.0196860.20170.420262
38-0.043248-0.44320.329279
39-0.041643-0.42670.335232
40-0.030835-0.3160.376327
410.0760590.77940.218758
42-0.029369-0.30090.382028
430.0183350.18790.425667
44-0.080261-0.82240.206348
45-0.034563-0.35420.361962
460.0289470.29660.383671
47-0.099905-1.02370.154159
48-0.031731-0.32510.372858
49-0.101645-1.04150.150007
500.082180.84210.200824
51-0.103729-1.06290.145132
52-0.049859-0.51090.305247
53-0.094699-0.97040.167045
540.1082991.10970.134823
55-0.023745-0.24330.404119
560.0375650.38490.350536
57-0.063842-0.65420.25721
58-0.134171-1.37480.086053
59-0.015547-0.15930.436866
600.0579770.59410.276865


Partial Autocorrelation Function
Time lag kPACF(k)T-STATP-value
1-0.142705-1.46230.073324
20.1327981.36080.088249
3-0.067625-0.69290.244937
40.0825370.84570.199808
50.1316241.34870.090161
60.0134260.13760.445418
70.0772180.79130.215291
8-0.017728-0.18170.428101
90.1458941.4950.068962
100.0391290.40090.344636
110.0686860.70380.241551
12-0.284427-2.91450.002177
13-0.010906-0.11180.455617
140.1863181.90920.029484
15-0.098176-1.0060.158364
16-0.015939-0.16330.435289
17-0.0021-0.02150.491438
180.0168390.17250.431671
190.0779040.79830.213255
200.0186140.19070.424551
210.175271.7960.037687
22-0.015801-0.16190.435844
23-0.091034-0.93280.176526
24-0.279712-2.86620.00251
25-0.031758-0.32540.372755
26-0.084745-0.86840.193583
27-0.017429-0.17860.429301
28-0.0231-0.23670.406673
29-0.044091-0.45180.326175
30-0.090089-0.92310.179027
31-0.031492-0.32270.373782
32-0.000104-0.00110.499577
330.204832.09890.019113
340.0330490.33870.367773
350.1280981.31260.096087
36-0.001195-0.01220.495125
370.1071111.09760.137452
38-0.099311-1.01760.155595
39-0.059313-0.60780.272324
40-0.063966-0.65550.256805
410.0054520.05590.477776
42-0.135522-1.38870.083934
43-0.030679-0.31440.376932
44-0.05656-0.57960.281724
450.0781930.80120.2124
460.002220.02280.490946
470.0145230.14880.44099
48-0.080731-0.82720.204987
490.002450.02510.490008
50-0.00343-0.03510.486016
51-0.028868-0.29580.383979
52-0.145656-1.49250.069279
53-0.045924-0.47060.319459
54-0.01789-0.18330.427452
55-0.058864-0.60320.273845
56-0.062201-0.63740.262634
570.0217820.22320.411906
58-0.123582-1.26630.104097
590.0169370.17350.431278
600.1261741.29290.099442

\begin{tabular}{lllllllll}
\hline
Partial Autocorrelation Function \tabularnewline
Time lag k & PACF(k) & T-STAT & P-value \tabularnewline
1 & -0.142705 & -1.4623 & 0.073324 \tabularnewline
2 & 0.132798 & 1.3608 & 0.088249 \tabularnewline
3 & -0.067625 & -0.6929 & 0.244937 \tabularnewline
4 & 0.082537 & 0.8457 & 0.199808 \tabularnewline
5 & 0.131624 & 1.3487 & 0.090161 \tabularnewline
6 & 0.013426 & 0.1376 & 0.445418 \tabularnewline
7 & 0.077218 & 0.7913 & 0.215291 \tabularnewline
8 & -0.017728 & -0.1817 & 0.428101 \tabularnewline
9 & 0.145894 & 1.495 & 0.068962 \tabularnewline
10 & 0.039129 & 0.4009 & 0.344636 \tabularnewline
11 & 0.068686 & 0.7038 & 0.241551 \tabularnewline
12 & -0.284427 & -2.9145 & 0.002177 \tabularnewline
13 & -0.010906 & -0.1118 & 0.455617 \tabularnewline
14 & 0.186318 & 1.9092 & 0.029484 \tabularnewline
15 & -0.098176 & -1.006 & 0.158364 \tabularnewline
16 & -0.015939 & -0.1633 & 0.435289 \tabularnewline
17 & -0.0021 & -0.0215 & 0.491438 \tabularnewline
18 & 0.016839 & 0.1725 & 0.431671 \tabularnewline
19 & 0.077904 & 0.7983 & 0.213255 \tabularnewline
20 & 0.018614 & 0.1907 & 0.424551 \tabularnewline
21 & 0.17527 & 1.796 & 0.037687 \tabularnewline
22 & -0.015801 & -0.1619 & 0.435844 \tabularnewline
23 & -0.091034 & -0.9328 & 0.176526 \tabularnewline
24 & -0.279712 & -2.8662 & 0.00251 \tabularnewline
25 & -0.031758 & -0.3254 & 0.372755 \tabularnewline
26 & -0.084745 & -0.8684 & 0.193583 \tabularnewline
27 & -0.017429 & -0.1786 & 0.429301 \tabularnewline
28 & -0.0231 & -0.2367 & 0.406673 \tabularnewline
29 & -0.044091 & -0.4518 & 0.326175 \tabularnewline
30 & -0.090089 & -0.9231 & 0.179027 \tabularnewline
31 & -0.031492 & -0.3227 & 0.373782 \tabularnewline
32 & -0.000104 & -0.0011 & 0.499577 \tabularnewline
33 & 0.20483 & 2.0989 & 0.019113 \tabularnewline
34 & 0.033049 & 0.3387 & 0.367773 \tabularnewline
35 & 0.128098 & 1.3126 & 0.096087 \tabularnewline
36 & -0.001195 & -0.0122 & 0.495125 \tabularnewline
37 & 0.107111 & 1.0976 & 0.137452 \tabularnewline
38 & -0.099311 & -1.0176 & 0.155595 \tabularnewline
39 & -0.059313 & -0.6078 & 0.272324 \tabularnewline
40 & -0.063966 & -0.6555 & 0.256805 \tabularnewline
41 & 0.005452 & 0.0559 & 0.477776 \tabularnewline
42 & -0.135522 & -1.3887 & 0.083934 \tabularnewline
43 & -0.030679 & -0.3144 & 0.376932 \tabularnewline
44 & -0.05656 & -0.5796 & 0.281724 \tabularnewline
45 & 0.078193 & 0.8012 & 0.2124 \tabularnewline
46 & 0.00222 & 0.0228 & 0.490946 \tabularnewline
47 & 0.014523 & 0.1488 & 0.44099 \tabularnewline
48 & -0.080731 & -0.8272 & 0.204987 \tabularnewline
49 & 0.00245 & 0.0251 & 0.490008 \tabularnewline
50 & -0.00343 & -0.0351 & 0.486016 \tabularnewline
51 & -0.028868 & -0.2958 & 0.383979 \tabularnewline
52 & -0.145656 & -1.4925 & 0.069279 \tabularnewline
53 & -0.045924 & -0.4706 & 0.319459 \tabularnewline
54 & -0.01789 & -0.1833 & 0.427452 \tabularnewline
55 & -0.058864 & -0.6032 & 0.273845 \tabularnewline
56 & -0.062201 & -0.6374 & 0.262634 \tabularnewline
57 & 0.021782 & 0.2232 & 0.411906 \tabularnewline
58 & -0.123582 & -1.2663 & 0.104097 \tabularnewline
59 & 0.016937 & 0.1735 & 0.431278 \tabularnewline
60 & 0.126174 & 1.2929 & 0.099442 \tabularnewline
\hline
\end{tabular}
%Source: https://freestatistics.org/blog/index.php?pk=28806&T=2

[TABLE]
[ROW][C]Partial Autocorrelation Function[/C][/ROW]
[ROW][C]Time lag k[/C][C]PACF(k)[/C][C]T-STAT[/C][C]P-value[/C][/ROW]
[ROW][C]1[/C][C]-0.142705[/C][C]-1.4623[/C][C]0.073324[/C][/ROW]
[ROW][C]2[/C][C]0.132798[/C][C]1.3608[/C][C]0.088249[/C][/ROW]
[ROW][C]3[/C][C]-0.067625[/C][C]-0.6929[/C][C]0.244937[/C][/ROW]
[ROW][C]4[/C][C]0.082537[/C][C]0.8457[/C][C]0.199808[/C][/ROW]
[ROW][C]5[/C][C]0.131624[/C][C]1.3487[/C][C]0.090161[/C][/ROW]
[ROW][C]6[/C][C]0.013426[/C][C]0.1376[/C][C]0.445418[/C][/ROW]
[ROW][C]7[/C][C]0.077218[/C][C]0.7913[/C][C]0.215291[/C][/ROW]
[ROW][C]8[/C][C]-0.017728[/C][C]-0.1817[/C][C]0.428101[/C][/ROW]
[ROW][C]9[/C][C]0.145894[/C][C]1.495[/C][C]0.068962[/C][/ROW]
[ROW][C]10[/C][C]0.039129[/C][C]0.4009[/C][C]0.344636[/C][/ROW]
[ROW][C]11[/C][C]0.068686[/C][C]0.7038[/C][C]0.241551[/C][/ROW]
[ROW][C]12[/C][C]-0.284427[/C][C]-2.9145[/C][C]0.002177[/C][/ROW]
[ROW][C]13[/C][C]-0.010906[/C][C]-0.1118[/C][C]0.455617[/C][/ROW]
[ROW][C]14[/C][C]0.186318[/C][C]1.9092[/C][C]0.029484[/C][/ROW]
[ROW][C]15[/C][C]-0.098176[/C][C]-1.006[/C][C]0.158364[/C][/ROW]
[ROW][C]16[/C][C]-0.015939[/C][C]-0.1633[/C][C]0.435289[/C][/ROW]
[ROW][C]17[/C][C]-0.0021[/C][C]-0.0215[/C][C]0.491438[/C][/ROW]
[ROW][C]18[/C][C]0.016839[/C][C]0.1725[/C][C]0.431671[/C][/ROW]
[ROW][C]19[/C][C]0.077904[/C][C]0.7983[/C][C]0.213255[/C][/ROW]
[ROW][C]20[/C][C]0.018614[/C][C]0.1907[/C][C]0.424551[/C][/ROW]
[ROW][C]21[/C][C]0.17527[/C][C]1.796[/C][C]0.037687[/C][/ROW]
[ROW][C]22[/C][C]-0.015801[/C][C]-0.1619[/C][C]0.435844[/C][/ROW]
[ROW][C]23[/C][C]-0.091034[/C][C]-0.9328[/C][C]0.176526[/C][/ROW]
[ROW][C]24[/C][C]-0.279712[/C][C]-2.8662[/C][C]0.00251[/C][/ROW]
[ROW][C]25[/C][C]-0.031758[/C][C]-0.3254[/C][C]0.372755[/C][/ROW]
[ROW][C]26[/C][C]-0.084745[/C][C]-0.8684[/C][C]0.193583[/C][/ROW]
[ROW][C]27[/C][C]-0.017429[/C][C]-0.1786[/C][C]0.429301[/C][/ROW]
[ROW][C]28[/C][C]-0.0231[/C][C]-0.2367[/C][C]0.406673[/C][/ROW]
[ROW][C]29[/C][C]-0.044091[/C][C]-0.4518[/C][C]0.326175[/C][/ROW]
[ROW][C]30[/C][C]-0.090089[/C][C]-0.9231[/C][C]0.179027[/C][/ROW]
[ROW][C]31[/C][C]-0.031492[/C][C]-0.3227[/C][C]0.373782[/C][/ROW]
[ROW][C]32[/C][C]-0.000104[/C][C]-0.0011[/C][C]0.499577[/C][/ROW]
[ROW][C]33[/C][C]0.20483[/C][C]2.0989[/C][C]0.019113[/C][/ROW]
[ROW][C]34[/C][C]0.033049[/C][C]0.3387[/C][C]0.367773[/C][/ROW]
[ROW][C]35[/C][C]0.128098[/C][C]1.3126[/C][C]0.096087[/C][/ROW]
[ROW][C]36[/C][C]-0.001195[/C][C]-0.0122[/C][C]0.495125[/C][/ROW]
[ROW][C]37[/C][C]0.107111[/C][C]1.0976[/C][C]0.137452[/C][/ROW]
[ROW][C]38[/C][C]-0.099311[/C][C]-1.0176[/C][C]0.155595[/C][/ROW]
[ROW][C]39[/C][C]-0.059313[/C][C]-0.6078[/C][C]0.272324[/C][/ROW]
[ROW][C]40[/C][C]-0.063966[/C][C]-0.6555[/C][C]0.256805[/C][/ROW]
[ROW][C]41[/C][C]0.005452[/C][C]0.0559[/C][C]0.477776[/C][/ROW]
[ROW][C]42[/C][C]-0.135522[/C][C]-1.3887[/C][C]0.083934[/C][/ROW]
[ROW][C]43[/C][C]-0.030679[/C][C]-0.3144[/C][C]0.376932[/C][/ROW]
[ROW][C]44[/C][C]-0.05656[/C][C]-0.5796[/C][C]0.281724[/C][/ROW]
[ROW][C]45[/C][C]0.078193[/C][C]0.8012[/C][C]0.2124[/C][/ROW]
[ROW][C]46[/C][C]0.00222[/C][C]0.0228[/C][C]0.490946[/C][/ROW]
[ROW][C]47[/C][C]0.014523[/C][C]0.1488[/C][C]0.44099[/C][/ROW]
[ROW][C]48[/C][C]-0.080731[/C][C]-0.8272[/C][C]0.204987[/C][/ROW]
[ROW][C]49[/C][C]0.00245[/C][C]0.0251[/C][C]0.490008[/C][/ROW]
[ROW][C]50[/C][C]-0.00343[/C][C]-0.0351[/C][C]0.486016[/C][/ROW]
[ROW][C]51[/C][C]-0.028868[/C][C]-0.2958[/C][C]0.383979[/C][/ROW]
[ROW][C]52[/C][C]-0.145656[/C][C]-1.4925[/C][C]0.069279[/C][/ROW]
[ROW][C]53[/C][C]-0.045924[/C][C]-0.4706[/C][C]0.319459[/C][/ROW]
[ROW][C]54[/C][C]-0.01789[/C][C]-0.1833[/C][C]0.427452[/C][/ROW]
[ROW][C]55[/C][C]-0.058864[/C][C]-0.6032[/C][C]0.273845[/C][/ROW]
[ROW][C]56[/C][C]-0.062201[/C][C]-0.6374[/C][C]0.262634[/C][/ROW]
[ROW][C]57[/C][C]0.021782[/C][C]0.2232[/C][C]0.411906[/C][/ROW]
[ROW][C]58[/C][C]-0.123582[/C][C]-1.2663[/C][C]0.104097[/C][/ROW]
[ROW][C]59[/C][C]0.016937[/C][C]0.1735[/C][C]0.431278[/C][/ROW]
[ROW][C]60[/C][C]0.126174[/C][C]1.2929[/C][C]0.099442[/C][/ROW]
[/TABLE]
Source: https://freestatistics.org/blog/index.php?pk=28806&T=2

Globally Unique Identifier (entire table): ba.freestatistics.org/blog/index.php?pk=28806&T=2

As an alternative you can also use a QR Code:  

The GUIDs for individual cells are displayed in the table below:

Partial Autocorrelation Function
Time lag kPACF(k)T-STATP-value
1-0.142705-1.46230.073324
20.1327981.36080.088249
3-0.067625-0.69290.244937
40.0825370.84570.199808
50.1316241.34870.090161
60.0134260.13760.445418
70.0772180.79130.215291
8-0.017728-0.18170.428101
90.1458941.4950.068962
100.0391290.40090.344636
110.0686860.70380.241551
12-0.284427-2.91450.002177
13-0.010906-0.11180.455617
140.1863181.90920.029484
15-0.098176-1.0060.158364
16-0.015939-0.16330.435289
17-0.0021-0.02150.491438
180.0168390.17250.431671
190.0779040.79830.213255
200.0186140.19070.424551
210.175271.7960.037687
22-0.015801-0.16190.435844
23-0.091034-0.93280.176526
24-0.279712-2.86620.00251
25-0.031758-0.32540.372755
26-0.084745-0.86840.193583
27-0.017429-0.17860.429301
28-0.0231-0.23670.406673
29-0.044091-0.45180.326175
30-0.090089-0.92310.179027
31-0.031492-0.32270.373782
32-0.000104-0.00110.499577
330.204832.09890.019113
340.0330490.33870.367773
350.1280981.31260.096087
36-0.001195-0.01220.495125
370.1071111.09760.137452
38-0.099311-1.01760.155595
39-0.059313-0.60780.272324
40-0.063966-0.65550.256805
410.0054520.05590.477776
42-0.135522-1.38870.083934
43-0.030679-0.31440.376932
44-0.05656-0.57960.281724
450.0781930.80120.2124
460.002220.02280.490946
470.0145230.14880.44099
48-0.080731-0.82720.204987
490.002450.02510.490008
50-0.00343-0.03510.486016
51-0.028868-0.29580.383979
52-0.145656-1.49250.069279
53-0.045924-0.47060.319459
54-0.01789-0.18330.427452
55-0.058864-0.60320.273845
56-0.062201-0.63740.262634
570.0217820.22320.411906
58-0.123582-1.26630.104097
590.0169370.17350.431278
600.1261741.29290.099442


Parameters (Session):
par1 = 60 ; par2 = 1 ; par3 = 1 ; par4 = 1 ; par5 = 12 ;
Parameters (R input):
par1 = 60 ; par2 = 1 ; par3 = 1 ; par4 = 1 ; par5 = 12 ;
R code (references can be found in the software module):
if (par1 == 'Default') {
par1 = 10*log10(length(x))
} else {
par1 <- as.numeric(par1)
}
par2 <- as.numeric(par2)
par3 <- as.numeric(par3)
par4 <- as.numeric(par4)
par5 <- as.numeric(par5)
if (par2 == 0) {
x <- log(x)
} else {
x <- (x ^ par2 - 1) / par2
}
if (par3 > 0) x <- diff(x,lag=1,difference=par3)
if (par4 > 0) x <- diff(x,lag=par5,difference=par4)
bitmap(file='pic1.png')
racf <- acf(x,par1,main='Autocorrelation',xlab='lags',ylab='ACF')
dev.off()
bitmap(file='pic2.png')
rpacf <- pacf(x,par1,main='Partial Autocorrelation',xlab='lags',ylab='PACF')
dev.off()
(myacf <- c(racf$acf))
(mypacf <- c(rpacf$acf))
lengthx <- length(x)
sqrtn <- sqrt(lengthx)
load(file='createtable')
a<-table.start()
a<-table.row.start(a)
a<-table.element(a,'Autocorrelation Function',4,TRUE)
a<-table.row.end(a)
a<-table.row.start(a)
a<-table.element(a,'Time lag k',header=TRUE)
a<-table.element(a,hyperlink('basics.htm','ACF(k)','click here for more information about the Autocorrelation Function'),header=TRUE)
a<-table.element(a,'T-STAT',header=TRUE)
a<-table.element(a,'P-value',header=TRUE)
a<-table.row.end(a)
for (i in 2:(par1+1)) {
a<-table.row.start(a)
a<-table.element(a,i-1,header=TRUE)
a<-table.element(a,round(myacf[i],6))
mytstat <- myacf[i]*sqrtn
a<-table.element(a,round(mytstat,4))
a<-table.element(a,round(1-pt(abs(mytstat),lengthx),6))
a<-table.row.end(a)
}
a<-table.end(a)
table.save(a,file='mytable.tab')
a<-table.start()
a<-table.row.start(a)
a<-table.element(a,'Partial Autocorrelation Function',4,TRUE)
a<-table.row.end(a)
a<-table.row.start(a)
a<-table.element(a,'Time lag k',header=TRUE)
a<-table.element(a,hyperlink('basics.htm','PACF(k)','click here for more information about the Partial Autocorrelation Function'),header=TRUE)
a<-table.element(a,'T-STAT',header=TRUE)
a<-table.element(a,'P-value',header=TRUE)
a<-table.row.end(a)
for (i in 1:par1) {
a<-table.row.start(a)
a<-table.element(a,i,header=TRUE)
a<-table.element(a,round(mypacf[i],6))
mytstat <- mypacf[i]*sqrtn
a<-table.element(a,round(mytstat,4))
a<-table.element(a,round(1-pt(abs(mytstat),lengthx),6))
a<-table.row.end(a)
}
a<-table.end(a)
table.save(a,file='mytable1.tab')