Free Statistics

of Irreproducible Research!

Author's title

Author*The author of this computation has been verified*
R Software Modulerwasp_autocorrelation.wasp
Title produced by software(Partial) Autocorrelation Function
Date of computationWed, 03 Dec 2008 09:02:28 -0700
Cite this page as followsStatistical Computations at FreeStatistics.org, Office for Research Development and Education, URL https://freestatistics.org/blog/index.php?v=date/2008/Dec/03/t1228320231389ulqliwce1jnh.htm/, Retrieved Fri, 17 May 2024 18:48:45 +0000
Statistical Computations at FreeStatistics.org, Office for Research Development and Education, URL https://freestatistics.org/blog/index.php?pk=28760, Retrieved Fri, 17 May 2024 18:48:45 +0000
QR Codes:

Original text written by user:
IsPrivate?No (this computation is public)
User-defined keywords
Estimated Impact222
Family? (F = Feedback message, R = changed R code, M = changed R Module, P = changed Parameters, D = changed Data)
-     [Univariate Data Series] [Uitvoer.Nederland] [2008-12-03 15:11:10] [988ab43f527fc78aae41c84649095267]
-   P   [Univariate Data Series] [Export From Belgi...] [2008-12-03 15:52:29] [988ab43f527fc78aae41c84649095267]
- RMP       [(Partial) Autocorrelation Function] [Partial Autocorre...] [2008-12-03 16:02:28] [5d823194959040fa9b19b8c8302177e6] [Current]
Feedback Forum

Post a new message
Dataseries X:
2236
2084.9
2409.5
2199.3
2203.5
2254.1
1975.8
1742.2
2520.6
2438.1
2126.3
2267.5
2201.1
2128.5
2596
2458.2
2210.5
2621.2
2231.4
2103.6
2685.8
2539.3
2462.4
2693.3
2307.7
2385.9
2737.6
2653.9
2545.4
2848.8
2359.5
2488.3
2861.1
2717.9
2844
2749
2652.9
2660.2
3187.1
2774.1
3158.2
3244.6
2665.5
2820.8
2983.4
3077.4
3024.8
2731.8
3046.2
2834.8
3292.8
2946.1
3196.9
3284.2
3003
2979
3137.4
3630.2
3270.7
2942.3


Summary of computational transaction
Raw Inputview raw input (R code)
Raw Outputview raw output of R engine
Computing time1 seconds
R Server'George Udny Yule' @ 72.249.76.132

\begin{tabular}{lllllllll}
\hline
Summary of computational transaction \tabularnewline
Raw Input & view raw input (R code)  \tabularnewline
Raw Output & view raw output of R engine  \tabularnewline
Computing time & 1 seconds \tabularnewline
R Server & 'George Udny Yule' @ 72.249.76.132 \tabularnewline
\hline
\end{tabular}
%Source: https://freestatistics.org/blog/index.php?pk=28760&T=0

[TABLE]
[ROW][C]Summary of computational transaction[/C][/ROW]
[ROW][C]Raw Input[/C][C]view raw input (R code) [/C][/ROW]
[ROW][C]Raw Output[/C][C]view raw output of R engine [/C][/ROW]
[ROW][C]Computing time[/C][C]1 seconds[/C][/ROW]
[ROW][C]R Server[/C][C]'George Udny Yule' @ 72.249.76.132[/C][/ROW]
[/TABLE]
Source: https://freestatistics.org/blog/index.php?pk=28760&T=0

Globally Unique Identifier (entire table): ba.freestatistics.org/blog/index.php?pk=28760&T=0

As an alternative you can also use a QR Code:  

The GUIDs for individual cells are displayed in the table below:

Summary of computational transaction
Raw Inputview raw input (R code)
Raw Outputview raw output of R engine
Computing time1 seconds
R Server'George Udny Yule' @ 72.249.76.132


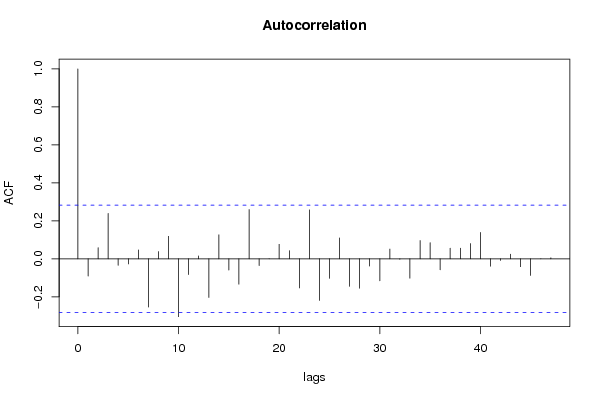
Autocorrelation Function
Time lag kACF(k)T-STATP-value
1-0.090581-0.62760.266632
20.0590850.40930.342052
30.2390961.65650.052072
4-0.034064-0.2360.407217
5-0.02687-0.18620.426552
60.0470250.32580.372997
7-0.254084-1.76030.04236
80.0385340.2670.395317
90.1184880.82090.207878
10-0.304319-2.10840.020122
11-0.082466-0.57130.285218
120.015380.10660.457794
13-0.203232-1.4080.082783
140.1264510.87610.192676
15-0.059-0.40880.342266
16-0.133052-0.92180.180618
170.2597491.79960.039106
18-0.035305-0.24460.403904
19-6.7e-05-5e-040.499815
200.0766140.53080.299005
210.0433550.30040.382596
22-0.153339-1.06240.146694
230.2579691.78730.040105
24-0.219056-1.51770.067829
25-0.102304-0.70880.240943
260.1099160.76150.225035
27-0.144566-1.00160.160784
28-0.154498-1.07040.144898
29-0.03808-0.26380.396521
30-0.115785-0.80220.213201
310.0515830.35740.361189
32-0.002332-0.01620.493589
33-0.101498-0.70320.242664
340.0963770.66770.253755
350.0851920.59020.278903
36-0.057448-0.3980.346193
370.0563230.39020.349052
380.0559050.38730.350116
390.0804820.55760.289857
400.1391510.96410.169923
41-0.038362-0.26580.395774
42-0.008291-0.05740.477215
430.0246690.17090.432504
44-0.040977-0.28390.388855
45-0.087373-0.60530.273904
465e-053e-040.499862
470.0055570.03850.484725
48NANANA

\begin{tabular}{lllllllll}
\hline
Autocorrelation Function \tabularnewline
Time lag k & ACF(k) & T-STAT & P-value \tabularnewline
1 & -0.090581 & -0.6276 & 0.266632 \tabularnewline
2 & 0.059085 & 0.4093 & 0.342052 \tabularnewline
3 & 0.239096 & 1.6565 & 0.052072 \tabularnewline
4 & -0.034064 & -0.236 & 0.407217 \tabularnewline
5 & -0.02687 & -0.1862 & 0.426552 \tabularnewline
6 & 0.047025 & 0.3258 & 0.372997 \tabularnewline
7 & -0.254084 & -1.7603 & 0.04236 \tabularnewline
8 & 0.038534 & 0.267 & 0.395317 \tabularnewline
9 & 0.118488 & 0.8209 & 0.207878 \tabularnewline
10 & -0.304319 & -2.1084 & 0.020122 \tabularnewline
11 & -0.082466 & -0.5713 & 0.285218 \tabularnewline
12 & 0.01538 & 0.1066 & 0.457794 \tabularnewline
13 & -0.203232 & -1.408 & 0.082783 \tabularnewline
14 & 0.126451 & 0.8761 & 0.192676 \tabularnewline
15 & -0.059 & -0.4088 & 0.342266 \tabularnewline
16 & -0.133052 & -0.9218 & 0.180618 \tabularnewline
17 & 0.259749 & 1.7996 & 0.039106 \tabularnewline
18 & -0.035305 & -0.2446 & 0.403904 \tabularnewline
19 & -6.7e-05 & -5e-04 & 0.499815 \tabularnewline
20 & 0.076614 & 0.5308 & 0.299005 \tabularnewline
21 & 0.043355 & 0.3004 & 0.382596 \tabularnewline
22 & -0.153339 & -1.0624 & 0.146694 \tabularnewline
23 & 0.257969 & 1.7873 & 0.040105 \tabularnewline
24 & -0.219056 & -1.5177 & 0.067829 \tabularnewline
25 & -0.102304 & -0.7088 & 0.240943 \tabularnewline
26 & 0.109916 & 0.7615 & 0.225035 \tabularnewline
27 & -0.144566 & -1.0016 & 0.160784 \tabularnewline
28 & -0.154498 & -1.0704 & 0.144898 \tabularnewline
29 & -0.03808 & -0.2638 & 0.396521 \tabularnewline
30 & -0.115785 & -0.8022 & 0.213201 \tabularnewline
31 & 0.051583 & 0.3574 & 0.361189 \tabularnewline
32 & -0.002332 & -0.0162 & 0.493589 \tabularnewline
33 & -0.101498 & -0.7032 & 0.242664 \tabularnewline
34 & 0.096377 & 0.6677 & 0.253755 \tabularnewline
35 & 0.085192 & 0.5902 & 0.278903 \tabularnewline
36 & -0.057448 & -0.398 & 0.346193 \tabularnewline
37 & 0.056323 & 0.3902 & 0.349052 \tabularnewline
38 & 0.055905 & 0.3873 & 0.350116 \tabularnewline
39 & 0.080482 & 0.5576 & 0.289857 \tabularnewline
40 & 0.139151 & 0.9641 & 0.169923 \tabularnewline
41 & -0.038362 & -0.2658 & 0.395774 \tabularnewline
42 & -0.008291 & -0.0574 & 0.477215 \tabularnewline
43 & 0.024669 & 0.1709 & 0.432504 \tabularnewline
44 & -0.040977 & -0.2839 & 0.388855 \tabularnewline
45 & -0.087373 & -0.6053 & 0.273904 \tabularnewline
46 & 5e-05 & 3e-04 & 0.499862 \tabularnewline
47 & 0.005557 & 0.0385 & 0.484725 \tabularnewline
48 & NA & NA & NA \tabularnewline
\hline
\end{tabular}
%Source: https://freestatistics.org/blog/index.php?pk=28760&T=1

[TABLE]
[ROW][C]Autocorrelation Function[/C][/ROW]
[ROW][C]Time lag k[/C][C]ACF(k)[/C][C]T-STAT[/C][C]P-value[/C][/ROW]
[ROW][C]1[/C][C]-0.090581[/C][C]-0.6276[/C][C]0.266632[/C][/ROW]
[ROW][C]2[/C][C]0.059085[/C][C]0.4093[/C][C]0.342052[/C][/ROW]
[ROW][C]3[/C][C]0.239096[/C][C]1.6565[/C][C]0.052072[/C][/ROW]
[ROW][C]4[/C][C]-0.034064[/C][C]-0.236[/C][C]0.407217[/C][/ROW]
[ROW][C]5[/C][C]-0.02687[/C][C]-0.1862[/C][C]0.426552[/C][/ROW]
[ROW][C]6[/C][C]0.047025[/C][C]0.3258[/C][C]0.372997[/C][/ROW]
[ROW][C]7[/C][C]-0.254084[/C][C]-1.7603[/C][C]0.04236[/C][/ROW]
[ROW][C]8[/C][C]0.038534[/C][C]0.267[/C][C]0.395317[/C][/ROW]
[ROW][C]9[/C][C]0.118488[/C][C]0.8209[/C][C]0.207878[/C][/ROW]
[ROW][C]10[/C][C]-0.304319[/C][C]-2.1084[/C][C]0.020122[/C][/ROW]
[ROW][C]11[/C][C]-0.082466[/C][C]-0.5713[/C][C]0.285218[/C][/ROW]
[ROW][C]12[/C][C]0.01538[/C][C]0.1066[/C][C]0.457794[/C][/ROW]
[ROW][C]13[/C][C]-0.203232[/C][C]-1.408[/C][C]0.082783[/C][/ROW]
[ROW][C]14[/C][C]0.126451[/C][C]0.8761[/C][C]0.192676[/C][/ROW]
[ROW][C]15[/C][C]-0.059[/C][C]-0.4088[/C][C]0.342266[/C][/ROW]
[ROW][C]16[/C][C]-0.133052[/C][C]-0.9218[/C][C]0.180618[/C][/ROW]
[ROW][C]17[/C][C]0.259749[/C][C]1.7996[/C][C]0.039106[/C][/ROW]
[ROW][C]18[/C][C]-0.035305[/C][C]-0.2446[/C][C]0.403904[/C][/ROW]
[ROW][C]19[/C][C]-6.7e-05[/C][C]-5e-04[/C][C]0.499815[/C][/ROW]
[ROW][C]20[/C][C]0.076614[/C][C]0.5308[/C][C]0.299005[/C][/ROW]
[ROW][C]21[/C][C]0.043355[/C][C]0.3004[/C][C]0.382596[/C][/ROW]
[ROW][C]22[/C][C]-0.153339[/C][C]-1.0624[/C][C]0.146694[/C][/ROW]
[ROW][C]23[/C][C]0.257969[/C][C]1.7873[/C][C]0.040105[/C][/ROW]
[ROW][C]24[/C][C]-0.219056[/C][C]-1.5177[/C][C]0.067829[/C][/ROW]
[ROW][C]25[/C][C]-0.102304[/C][C]-0.7088[/C][C]0.240943[/C][/ROW]
[ROW][C]26[/C][C]0.109916[/C][C]0.7615[/C][C]0.225035[/C][/ROW]
[ROW][C]27[/C][C]-0.144566[/C][C]-1.0016[/C][C]0.160784[/C][/ROW]
[ROW][C]28[/C][C]-0.154498[/C][C]-1.0704[/C][C]0.144898[/C][/ROW]
[ROW][C]29[/C][C]-0.03808[/C][C]-0.2638[/C][C]0.396521[/C][/ROW]
[ROW][C]30[/C][C]-0.115785[/C][C]-0.8022[/C][C]0.213201[/C][/ROW]
[ROW][C]31[/C][C]0.051583[/C][C]0.3574[/C][C]0.361189[/C][/ROW]
[ROW][C]32[/C][C]-0.002332[/C][C]-0.0162[/C][C]0.493589[/C][/ROW]
[ROW][C]33[/C][C]-0.101498[/C][C]-0.7032[/C][C]0.242664[/C][/ROW]
[ROW][C]34[/C][C]0.096377[/C][C]0.6677[/C][C]0.253755[/C][/ROW]
[ROW][C]35[/C][C]0.085192[/C][C]0.5902[/C][C]0.278903[/C][/ROW]
[ROW][C]36[/C][C]-0.057448[/C][C]-0.398[/C][C]0.346193[/C][/ROW]
[ROW][C]37[/C][C]0.056323[/C][C]0.3902[/C][C]0.349052[/C][/ROW]
[ROW][C]38[/C][C]0.055905[/C][C]0.3873[/C][C]0.350116[/C][/ROW]
[ROW][C]39[/C][C]0.080482[/C][C]0.5576[/C][C]0.289857[/C][/ROW]
[ROW][C]40[/C][C]0.139151[/C][C]0.9641[/C][C]0.169923[/C][/ROW]
[ROW][C]41[/C][C]-0.038362[/C][C]-0.2658[/C][C]0.395774[/C][/ROW]
[ROW][C]42[/C][C]-0.008291[/C][C]-0.0574[/C][C]0.477215[/C][/ROW]
[ROW][C]43[/C][C]0.024669[/C][C]0.1709[/C][C]0.432504[/C][/ROW]
[ROW][C]44[/C][C]-0.040977[/C][C]-0.2839[/C][C]0.388855[/C][/ROW]
[ROW][C]45[/C][C]-0.087373[/C][C]-0.6053[/C][C]0.273904[/C][/ROW]
[ROW][C]46[/C][C]5e-05[/C][C]3e-04[/C][C]0.499862[/C][/ROW]
[ROW][C]47[/C][C]0.005557[/C][C]0.0385[/C][C]0.484725[/C][/ROW]
[ROW][C]48[/C][C]NA[/C][C]NA[/C][C]NA[/C][/ROW]
[/TABLE]
Source: https://freestatistics.org/blog/index.php?pk=28760&T=1

Globally Unique Identifier (entire table): ba.freestatistics.org/blog/index.php?pk=28760&T=1

As an alternative you can also use a QR Code:  

The GUIDs for individual cells are displayed in the table below:

Autocorrelation Function
Time lag kACF(k)T-STATP-value
1-0.090581-0.62760.266632
20.0590850.40930.342052
30.2390961.65650.052072
4-0.034064-0.2360.407217
5-0.02687-0.18620.426552
60.0470250.32580.372997
7-0.254084-1.76030.04236
80.0385340.2670.395317
90.1184880.82090.207878
10-0.304319-2.10840.020122
11-0.082466-0.57130.285218
120.015380.10660.457794
13-0.203232-1.4080.082783
140.1264510.87610.192676
15-0.059-0.40880.342266
16-0.133052-0.92180.180618
170.2597491.79960.039106
18-0.035305-0.24460.403904
19-6.7e-05-5e-040.499815
200.0766140.53080.299005
210.0433550.30040.382596
22-0.153339-1.06240.146694
230.2579691.78730.040105
24-0.219056-1.51770.067829
25-0.102304-0.70880.240943
260.1099160.76150.225035
27-0.144566-1.00160.160784
28-0.154498-1.07040.144898
29-0.03808-0.26380.396521
30-0.115785-0.80220.213201
310.0515830.35740.361189
32-0.002332-0.01620.493589
33-0.101498-0.70320.242664
340.0963770.66770.253755
350.0851920.59020.278903
36-0.057448-0.3980.346193
370.0563230.39020.349052
380.0559050.38730.350116
390.0804820.55760.289857
400.1391510.96410.169923
41-0.038362-0.26580.395774
42-0.008291-0.05740.477215
430.0246690.17090.432504
44-0.040977-0.28390.388855
45-0.087373-0.60530.273904
465e-053e-040.499862
470.0055570.03850.484725
48NANANA


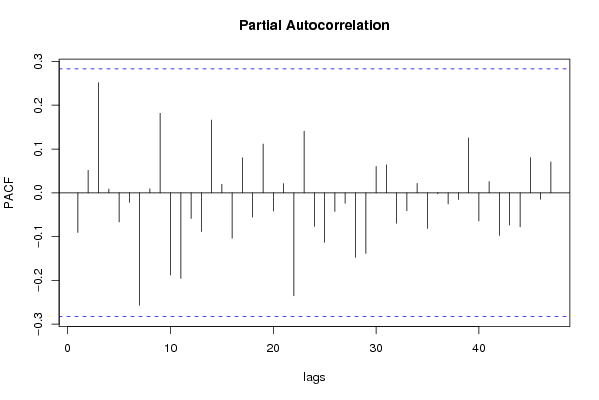
Partial Autocorrelation Function
Time lag kPACF(k)T-STATP-value
1-0.090581-0.62760.266632
20.05130.35540.361916
30.2515411.74270.043893
40.0086820.06010.476144
5-0.066615-0.46150.323255
6-0.021994-0.15240.439764
7-0.256845-1.77950.040747
80.0092090.06380.474696
90.1814751.25730.107365
10-0.187859-1.30150.099645
11-0.195533-1.35470.090929
12-0.058472-0.40510.343601
13-0.08868-0.61440.270929
140.1660681.15060.127809
150.019370.13420.446903
16-0.103804-0.71920.237759
170.0798450.55320.291352
18-0.055343-0.38340.351547
190.1113330.77130.222143
20-0.041641-0.28850.387103
210.0210810.14610.442246
22-0.235234-1.62980.05485
230.1406770.97460.167313
24-0.07684-0.53240.298466
25-0.113031-0.78310.218706
26-0.042693-0.29580.384335
27-0.023802-0.16490.434855
28-0.147406-1.02130.156126
29-0.138412-0.95890.171195
300.0601710.41690.339314
310.0638270.44220.330164
32-0.069638-0.48250.315833
33-0.04112-0.28490.388479
340.0213020.14760.441645
35-0.081438-0.56420.287617
36-0.002384-0.01650.493444
37-0.025401-0.1760.430525
38-0.015525-0.10760.457396
390.1252560.86780.194912
40-0.064179-0.44460.329287
410.0257250.17820.429648
42-0.097383-0.67470.251555
43-0.073796-0.51130.305752
44-0.077773-0.53880.296248
450.0805670.55820.289656
46-0.014874-0.10310.459175
470.0704460.48810.313863
48NANANA

\begin{tabular}{lllllllll}
\hline
Partial Autocorrelation Function \tabularnewline
Time lag k & PACF(k) & T-STAT & P-value \tabularnewline
1 & -0.090581 & -0.6276 & 0.266632 \tabularnewline
2 & 0.0513 & 0.3554 & 0.361916 \tabularnewline
3 & 0.251541 & 1.7427 & 0.043893 \tabularnewline
4 & 0.008682 & 0.0601 & 0.476144 \tabularnewline
5 & -0.066615 & -0.4615 & 0.323255 \tabularnewline
6 & -0.021994 & -0.1524 & 0.439764 \tabularnewline
7 & -0.256845 & -1.7795 & 0.040747 \tabularnewline
8 & 0.009209 & 0.0638 & 0.474696 \tabularnewline
9 & 0.181475 & 1.2573 & 0.107365 \tabularnewline
10 & -0.187859 & -1.3015 & 0.099645 \tabularnewline
11 & -0.195533 & -1.3547 & 0.090929 \tabularnewline
12 & -0.058472 & -0.4051 & 0.343601 \tabularnewline
13 & -0.08868 & -0.6144 & 0.270929 \tabularnewline
14 & 0.166068 & 1.1506 & 0.127809 \tabularnewline
15 & 0.01937 & 0.1342 & 0.446903 \tabularnewline
16 & -0.103804 & -0.7192 & 0.237759 \tabularnewline
17 & 0.079845 & 0.5532 & 0.291352 \tabularnewline
18 & -0.055343 & -0.3834 & 0.351547 \tabularnewline
19 & 0.111333 & 0.7713 & 0.222143 \tabularnewline
20 & -0.041641 & -0.2885 & 0.387103 \tabularnewline
21 & 0.021081 & 0.1461 & 0.442246 \tabularnewline
22 & -0.235234 & -1.6298 & 0.05485 \tabularnewline
23 & 0.140677 & 0.9746 & 0.167313 \tabularnewline
24 & -0.07684 & -0.5324 & 0.298466 \tabularnewline
25 & -0.113031 & -0.7831 & 0.218706 \tabularnewline
26 & -0.042693 & -0.2958 & 0.384335 \tabularnewline
27 & -0.023802 & -0.1649 & 0.434855 \tabularnewline
28 & -0.147406 & -1.0213 & 0.156126 \tabularnewline
29 & -0.138412 & -0.9589 & 0.171195 \tabularnewline
30 & 0.060171 & 0.4169 & 0.339314 \tabularnewline
31 & 0.063827 & 0.4422 & 0.330164 \tabularnewline
32 & -0.069638 & -0.4825 & 0.315833 \tabularnewline
33 & -0.04112 & -0.2849 & 0.388479 \tabularnewline
34 & 0.021302 & 0.1476 & 0.441645 \tabularnewline
35 & -0.081438 & -0.5642 & 0.287617 \tabularnewline
36 & -0.002384 & -0.0165 & 0.493444 \tabularnewline
37 & -0.025401 & -0.176 & 0.430525 \tabularnewline
38 & -0.015525 & -0.1076 & 0.457396 \tabularnewline
39 & 0.125256 & 0.8678 & 0.194912 \tabularnewline
40 & -0.064179 & -0.4446 & 0.329287 \tabularnewline
41 & 0.025725 & 0.1782 & 0.429648 \tabularnewline
42 & -0.097383 & -0.6747 & 0.251555 \tabularnewline
43 & -0.073796 & -0.5113 & 0.305752 \tabularnewline
44 & -0.077773 & -0.5388 & 0.296248 \tabularnewline
45 & 0.080567 & 0.5582 & 0.289656 \tabularnewline
46 & -0.014874 & -0.1031 & 0.459175 \tabularnewline
47 & 0.070446 & 0.4881 & 0.313863 \tabularnewline
48 & NA & NA & NA \tabularnewline
\hline
\end{tabular}
%Source: https://freestatistics.org/blog/index.php?pk=28760&T=2

[TABLE]
[ROW][C]Partial Autocorrelation Function[/C][/ROW]
[ROW][C]Time lag k[/C][C]PACF(k)[/C][C]T-STAT[/C][C]P-value[/C][/ROW]
[ROW][C]1[/C][C]-0.090581[/C][C]-0.6276[/C][C]0.266632[/C][/ROW]
[ROW][C]2[/C][C]0.0513[/C][C]0.3554[/C][C]0.361916[/C][/ROW]
[ROW][C]3[/C][C]0.251541[/C][C]1.7427[/C][C]0.043893[/C][/ROW]
[ROW][C]4[/C][C]0.008682[/C][C]0.0601[/C][C]0.476144[/C][/ROW]
[ROW][C]5[/C][C]-0.066615[/C][C]-0.4615[/C][C]0.323255[/C][/ROW]
[ROW][C]6[/C][C]-0.021994[/C][C]-0.1524[/C][C]0.439764[/C][/ROW]
[ROW][C]7[/C][C]-0.256845[/C][C]-1.7795[/C][C]0.040747[/C][/ROW]
[ROW][C]8[/C][C]0.009209[/C][C]0.0638[/C][C]0.474696[/C][/ROW]
[ROW][C]9[/C][C]0.181475[/C][C]1.2573[/C][C]0.107365[/C][/ROW]
[ROW][C]10[/C][C]-0.187859[/C][C]-1.3015[/C][C]0.099645[/C][/ROW]
[ROW][C]11[/C][C]-0.195533[/C][C]-1.3547[/C][C]0.090929[/C][/ROW]
[ROW][C]12[/C][C]-0.058472[/C][C]-0.4051[/C][C]0.343601[/C][/ROW]
[ROW][C]13[/C][C]-0.08868[/C][C]-0.6144[/C][C]0.270929[/C][/ROW]
[ROW][C]14[/C][C]0.166068[/C][C]1.1506[/C][C]0.127809[/C][/ROW]
[ROW][C]15[/C][C]0.01937[/C][C]0.1342[/C][C]0.446903[/C][/ROW]
[ROW][C]16[/C][C]-0.103804[/C][C]-0.7192[/C][C]0.237759[/C][/ROW]
[ROW][C]17[/C][C]0.079845[/C][C]0.5532[/C][C]0.291352[/C][/ROW]
[ROW][C]18[/C][C]-0.055343[/C][C]-0.3834[/C][C]0.351547[/C][/ROW]
[ROW][C]19[/C][C]0.111333[/C][C]0.7713[/C][C]0.222143[/C][/ROW]
[ROW][C]20[/C][C]-0.041641[/C][C]-0.2885[/C][C]0.387103[/C][/ROW]
[ROW][C]21[/C][C]0.021081[/C][C]0.1461[/C][C]0.442246[/C][/ROW]
[ROW][C]22[/C][C]-0.235234[/C][C]-1.6298[/C][C]0.05485[/C][/ROW]
[ROW][C]23[/C][C]0.140677[/C][C]0.9746[/C][C]0.167313[/C][/ROW]
[ROW][C]24[/C][C]-0.07684[/C][C]-0.5324[/C][C]0.298466[/C][/ROW]
[ROW][C]25[/C][C]-0.113031[/C][C]-0.7831[/C][C]0.218706[/C][/ROW]
[ROW][C]26[/C][C]-0.042693[/C][C]-0.2958[/C][C]0.384335[/C][/ROW]
[ROW][C]27[/C][C]-0.023802[/C][C]-0.1649[/C][C]0.434855[/C][/ROW]
[ROW][C]28[/C][C]-0.147406[/C][C]-1.0213[/C][C]0.156126[/C][/ROW]
[ROW][C]29[/C][C]-0.138412[/C][C]-0.9589[/C][C]0.171195[/C][/ROW]
[ROW][C]30[/C][C]0.060171[/C][C]0.4169[/C][C]0.339314[/C][/ROW]
[ROW][C]31[/C][C]0.063827[/C][C]0.4422[/C][C]0.330164[/C][/ROW]
[ROW][C]32[/C][C]-0.069638[/C][C]-0.4825[/C][C]0.315833[/C][/ROW]
[ROW][C]33[/C][C]-0.04112[/C][C]-0.2849[/C][C]0.388479[/C][/ROW]
[ROW][C]34[/C][C]0.021302[/C][C]0.1476[/C][C]0.441645[/C][/ROW]
[ROW][C]35[/C][C]-0.081438[/C][C]-0.5642[/C][C]0.287617[/C][/ROW]
[ROW][C]36[/C][C]-0.002384[/C][C]-0.0165[/C][C]0.493444[/C][/ROW]
[ROW][C]37[/C][C]-0.025401[/C][C]-0.176[/C][C]0.430525[/C][/ROW]
[ROW][C]38[/C][C]-0.015525[/C][C]-0.1076[/C][C]0.457396[/C][/ROW]
[ROW][C]39[/C][C]0.125256[/C][C]0.8678[/C][C]0.194912[/C][/ROW]
[ROW][C]40[/C][C]-0.064179[/C][C]-0.4446[/C][C]0.329287[/C][/ROW]
[ROW][C]41[/C][C]0.025725[/C][C]0.1782[/C][C]0.429648[/C][/ROW]
[ROW][C]42[/C][C]-0.097383[/C][C]-0.6747[/C][C]0.251555[/C][/ROW]
[ROW][C]43[/C][C]-0.073796[/C][C]-0.5113[/C][C]0.305752[/C][/ROW]
[ROW][C]44[/C][C]-0.077773[/C][C]-0.5388[/C][C]0.296248[/C][/ROW]
[ROW][C]45[/C][C]0.080567[/C][C]0.5582[/C][C]0.289656[/C][/ROW]
[ROW][C]46[/C][C]-0.014874[/C][C]-0.1031[/C][C]0.459175[/C][/ROW]
[ROW][C]47[/C][C]0.070446[/C][C]0.4881[/C][C]0.313863[/C][/ROW]
[ROW][C]48[/C][C]NA[/C][C]NA[/C][C]NA[/C][/ROW]
[/TABLE]
Source: https://freestatistics.org/blog/index.php?pk=28760&T=2

Globally Unique Identifier (entire table): ba.freestatistics.org/blog/index.php?pk=28760&T=2

As an alternative you can also use a QR Code:  

The GUIDs for individual cells are displayed in the table below:

Partial Autocorrelation Function
Time lag kPACF(k)T-STATP-value
1-0.090581-0.62760.266632
20.05130.35540.361916
30.2515411.74270.043893
40.0086820.06010.476144
5-0.066615-0.46150.323255
6-0.021994-0.15240.439764
7-0.256845-1.77950.040747
80.0092090.06380.474696
90.1814751.25730.107365
10-0.187859-1.30150.099645
11-0.195533-1.35470.090929
12-0.058472-0.40510.343601
13-0.08868-0.61440.270929
140.1660681.15060.127809
150.019370.13420.446903
16-0.103804-0.71920.237759
170.0798450.55320.291352
18-0.055343-0.38340.351547
190.1113330.77130.222143
20-0.041641-0.28850.387103
210.0210810.14610.442246
22-0.235234-1.62980.05485
230.1406770.97460.167313
24-0.07684-0.53240.298466
25-0.113031-0.78310.218706
26-0.042693-0.29580.384335
27-0.023802-0.16490.434855
28-0.147406-1.02130.156126
29-0.138412-0.95890.171195
300.0601710.41690.339314
310.0638270.44220.330164
32-0.069638-0.48250.315833
33-0.04112-0.28490.388479
340.0213020.14760.441645
35-0.081438-0.56420.287617
36-0.002384-0.01650.493444
37-0.025401-0.1760.430525
38-0.015525-0.10760.457396
390.1252560.86780.194912
40-0.064179-0.44460.329287
410.0257250.17820.429648
42-0.097383-0.67470.251555
43-0.073796-0.51130.305752
44-0.077773-0.53880.296248
450.0805670.55820.289656
46-0.014874-0.10310.459175
470.0704460.48810.313863
48NANANA


Parameters (Session):
par1 = 48 ; par2 = 1 ; par3 = 0 ; par4 = 1 ; par5 = 12 ;
Parameters (R input):
par1 = 48 ; par2 = 1 ; par3 = 0 ; par4 = 1 ; par5 = 12 ;
R code (references can be found in the software module):
if (par1 == 'Default') {
par1 = 10*log10(length(x))
} else {
par1 <- as.numeric(par1)
}
par2 <- as.numeric(par2)
par3 <- as.numeric(par3)
par4 <- as.numeric(par4)
par5 <- as.numeric(par5)
if (par2 == 0) {
x <- log(x)
} else {
x <- (x ^ par2 - 1) / par2
}
if (par3 > 0) x <- diff(x,lag=1,difference=par3)
if (par4 > 0) x <- diff(x,lag=par5,difference=par4)
bitmap(file='pic1.png')
racf <- acf(x,par1,main='Autocorrelation',xlab='lags',ylab='ACF')
dev.off()
bitmap(file='pic2.png')
rpacf <- pacf(x,par1,main='Partial Autocorrelation',xlab='lags',ylab='PACF')
dev.off()
(myacf <- c(racf$acf))
(mypacf <- c(rpacf$acf))
lengthx <- length(x)
sqrtn <- sqrt(lengthx)
load(file='createtable')
a<-table.start()
a<-table.row.start(a)
a<-table.element(a,'Autocorrelation Function',4,TRUE)
a<-table.row.end(a)
a<-table.row.start(a)
a<-table.element(a,'Time lag k',header=TRUE)
a<-table.element(a,hyperlink('basics.htm','ACF(k)','click here for more information about the Autocorrelation Function'),header=TRUE)
a<-table.element(a,'T-STAT',header=TRUE)
a<-table.element(a,'P-value',header=TRUE)
a<-table.row.end(a)
for (i in 2:(par1+1)) {
a<-table.row.start(a)
a<-table.element(a,i-1,header=TRUE)
a<-table.element(a,round(myacf[i],6))
mytstat <- myacf[i]*sqrtn
a<-table.element(a,round(mytstat,4))
a<-table.element(a,round(1-pt(abs(mytstat),lengthx),6))
a<-table.row.end(a)
}
a<-table.end(a)
table.save(a,file='mytable.tab')
a<-table.start()
a<-table.row.start(a)
a<-table.element(a,'Partial Autocorrelation Function',4,TRUE)
a<-table.row.end(a)
a<-table.row.start(a)
a<-table.element(a,'Time lag k',header=TRUE)
a<-table.element(a,hyperlink('basics.htm','PACF(k)','click here for more information about the Partial Autocorrelation Function'),header=TRUE)
a<-table.element(a,'T-STAT',header=TRUE)
a<-table.element(a,'P-value',header=TRUE)
a<-table.row.end(a)
for (i in 1:par1) {
a<-table.row.start(a)
a<-table.element(a,i,header=TRUE)
a<-table.element(a,round(mypacf[i],6))
mytstat <- mypacf[i]*sqrtn
a<-table.element(a,round(mytstat,4))
a<-table.element(a,round(1-pt(abs(mytstat),lengthx),6))
a<-table.row.end(a)
}
a<-table.end(a)
table.save(a,file='mytable1.tab')