Free Statistics

of Irreproducible Research!

Author's title

Author*Unverified author*
R Software Modulerwasp_autocorrelation.wasp
Title produced by software(Partial) Autocorrelation Function
Date of computationWed, 03 Dec 2008 05:33:31 -0700
Cite this page as followsStatistical Computations at FreeStatistics.org, Office for Research Development and Education, URL https://freestatistics.org/blog/index.php?v=date/2008/Dec/03/t1228307638or9gxrlaiuz8769.htm/, Retrieved Fri, 17 May 2024 18:55:14 +0000
Statistical Computations at FreeStatistics.org, Office for Research Development and Education, URL https://freestatistics.org/blog/index.php?pk=28654, Retrieved Fri, 17 May 2024 18:55:14 +0000
QR Codes:

Original text written by user:
IsPrivate?No (this computation is public)
User-defined keywords
Estimated Impact200
Family? (F = Feedback message, R = changed R code, M = changed R Module, P = changed Parameters, D = changed Data)
F     [Univariate Data Series] [Airline data] [2007-10-18 09:58:47] [42daae401fd3def69a25014f2252b4c2]
- RMPD  [(Partial) Autocorrelation Function] [s0700274] [2008-11-29 16:41:03] [b28ef2aea2cd58ceb5ad90223572c703]
F   P       [(Partial) Autocorrelation Function] [Q6] [2008-12-03 12:33:31] [d41d8cd98f00b204e9800998ecf8427e] [Current]
Feedback Forum
2008-12-03 19:04:14 [407693b66d7f2e0b350979005057872d] [reply
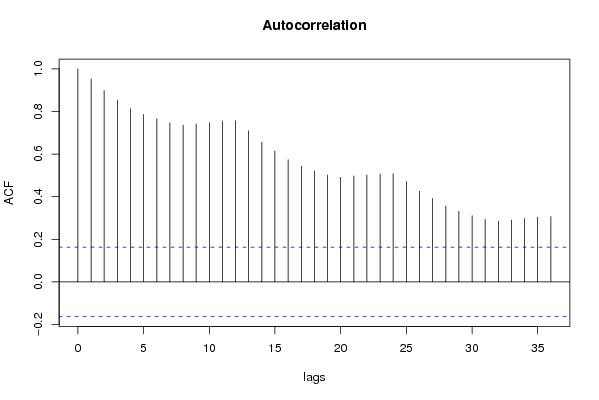
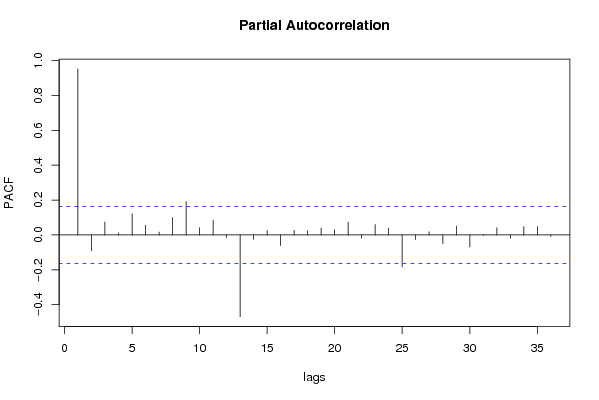
Deze vraag is zeer gedetailleerd beantwoord. We zien hier als we differentiëren door de kleine d op 1 te zetten is het langzaam dalens patroon weg. Een langzaam dalend patroon in de ACF.
Als we voor grote d ook nog eens een 1 invullen dan is de trend helemaal weggewerkt. We hebben de reeks stationair gemaakt.
Bij de VRM gaan we op zoek naar de kleinste varantie door kleine en grote d te differentiëren. 152.689254257193 is de kleinste waarde voor de variantie.
Die is de spectraalanalyse zonder dat we de parameter veranderd hebben. We zien regelmatige golfbewegingen op de grafiek, sterke pieken met lage frequenties. De lnge termijn trend heeft een belangrijk effect. Bij het cumulatief periodogram zien we een steile grafiek met lange termijn trend met nog eens een trapfunctie in de grafiek.
Als we de kleine d op 1 zetten hebben we geen dalende grafiek meer. De stijging in het cumulatief periodogram is zeer groot we spreken hier van significante stijgingen.
Als we de grote d op 1 zetten zien we gen duidelijke trapbeweging meer dse seizonale trend is helemaal verdwenen.
2008-12-04 14:30:47 [c97d2ae59c98cf77a04815c1edffab5a] [reply
de vraag is correct beantwoord.
je kan nog aanvullen dat we in de autocorrelatie te maken hebben met een 'hangmatpatroon' waarvan de palen zich bevinden in de periodes 12,24,36,..
dit wijst op seizoenaliteit.
2008-12-07 18:15:42 [Sandra Hofmans] [reply
Je ziet hier een hangmatpatroon. Allereerst is er, zoals de student vermeldde, sprake van een lange termijn trend. Maar je kan hier ook seizoenaliteit waarnemen. Dit is te zien op lag 12,24,36,…
2008-12-08 12:58:25 [Dave Bellekens] [reply
Als we de waarden d en D gelijk houden aan 0 dan zien we inderdaad in de autocorrelatie functie een dalende trend. Er is sprake van een hangmatpatroon met pieken op lags 12,24 en 26. Dit wijst niet alleen op een dalende trend, maar ook op de aanwezigheid van seizoenaliteit, die we beide zullen verwijderen door de d en D aan te passen.

Post a new message
Dataseries X:
112
118
132
129
121
135
148
148
136
119
104
118
115
126
141
135
125
149
170
170
158
133
114
140
145
150
178
163
172
178
199
199
184
162
146
166
171
180
193
181
183
218
230
242
209
191
172
194
196
196
236
235
229
243
264
272
237
211
180
201
204
188
235
227
234
264
302
293
259
229
203
229
242
233
267
269
270
315
364
347
312
274
237
278
284
277
317
313
318
374
413
405
355
306
271
306
315
301
356
348
355
422
465
467
404
347
305
336
340
318
362
348
363
435
491
505
404
359
310
337
360
342
406
396
420
472
548
559
463
407
362
405
417
391
419
461
472
535
622
606
508
461
390
432


Summary of computational transaction
Raw Inputview raw input (R code)
Raw Outputview raw output of R engine
Computing time1 seconds
R Server'George Udny Yule' @ 72.249.76.132

\begin{tabular}{lllllllll}
\hline
Summary of computational transaction \tabularnewline
Raw Input & view raw input (R code)  \tabularnewline
Raw Output & view raw output of R engine  \tabularnewline
Computing time & 1 seconds \tabularnewline
R Server & 'George Udny Yule' @ 72.249.76.132 \tabularnewline
\hline
\end{tabular}
%Source: https://freestatistics.org/blog/index.php?pk=28654&T=0

[TABLE]
[ROW][C]Summary of computational transaction[/C][/ROW]
[ROW][C]Raw Input[/C][C]view raw input (R code) [/C][/ROW]
[ROW][C]Raw Output[/C][C]view raw output of R engine [/C][/ROW]
[ROW][C]Computing time[/C][C]1 seconds[/C][/ROW]
[ROW][C]R Server[/C][C]'George Udny Yule' @ 72.249.76.132[/C][/ROW]
[/TABLE]
Source: https://freestatistics.org/blog/index.php?pk=28654&T=0

Globally Unique Identifier (entire table): ba.freestatistics.org/blog/index.php?pk=28654&T=0

As an alternative you can also use a QR Code:  

The GUIDs for individual cells are displayed in the table below:

Summary of computational transaction
Raw Inputview raw input (R code)
Raw Outputview raw output of R engine
Computing time1 seconds
R Server'George Udny Yule' @ 72.249.76.132


Autocorrelation Function
Time lag kACF(k)T-STATP-value
10.95235911.42830
20.8984910.78190
30.85361310.24340
40.8133089.75970
50.7858479.43020
60.7659439.19130
70.7469528.96340
80.735848.83010
90.7409598.89150
100.7472738.96730
110.7551459.06170
120.7564299.07720
130.7093668.51240
140.6566177.87940
150.6147617.37710
160.5737986.88560
170.5427496.5130
180.5202746.24330
190.5017176.02060
200.4912665.89520
210.4977855.97340
220.5020356.02440
230.5065136.07820
240.507816.09370
250.4703215.64390
260.4255365.10641e-06
270.3915694.69883e-06
280.3564134.2771.7e-05
290.3313253.97595.5e-05
300.3107023.72840.000138
310.2931023.51720.000292
320.2849163.4190.000409
330.2905953.48710.000324
340.2971223.56550.000247
350.3036383.64370.000187
360.3064633.67760.000166

\begin{tabular}{lllllllll}
\hline
Autocorrelation Function \tabularnewline
Time lag k & ACF(k) & T-STAT & P-value \tabularnewline
1 & 0.952359 & 11.4283 & 0 \tabularnewline
2 & 0.89849 & 10.7819 & 0 \tabularnewline
3 & 0.853613 & 10.2434 & 0 \tabularnewline
4 & 0.813308 & 9.7597 & 0 \tabularnewline
5 & 0.785847 & 9.4302 & 0 \tabularnewline
6 & 0.765943 & 9.1913 & 0 \tabularnewline
7 & 0.746952 & 8.9634 & 0 \tabularnewline
8 & 0.73584 & 8.8301 & 0 \tabularnewline
9 & 0.740959 & 8.8915 & 0 \tabularnewline
10 & 0.747273 & 8.9673 & 0 \tabularnewline
11 & 0.755145 & 9.0617 & 0 \tabularnewline
12 & 0.756429 & 9.0772 & 0 \tabularnewline
13 & 0.709366 & 8.5124 & 0 \tabularnewline
14 & 0.656617 & 7.8794 & 0 \tabularnewline
15 & 0.614761 & 7.3771 & 0 \tabularnewline
16 & 0.573798 & 6.8856 & 0 \tabularnewline
17 & 0.542749 & 6.513 & 0 \tabularnewline
18 & 0.520274 & 6.2433 & 0 \tabularnewline
19 & 0.501717 & 6.0206 & 0 \tabularnewline
20 & 0.491266 & 5.8952 & 0 \tabularnewline
21 & 0.497785 & 5.9734 & 0 \tabularnewline
22 & 0.502035 & 6.0244 & 0 \tabularnewline
23 & 0.506513 & 6.0782 & 0 \tabularnewline
24 & 0.50781 & 6.0937 & 0 \tabularnewline
25 & 0.470321 & 5.6439 & 0 \tabularnewline
26 & 0.425536 & 5.1064 & 1e-06 \tabularnewline
27 & 0.391569 & 4.6988 & 3e-06 \tabularnewline
28 & 0.356413 & 4.277 & 1.7e-05 \tabularnewline
29 & 0.331325 & 3.9759 & 5.5e-05 \tabularnewline
30 & 0.310702 & 3.7284 & 0.000138 \tabularnewline
31 & 0.293102 & 3.5172 & 0.000292 \tabularnewline
32 & 0.284916 & 3.419 & 0.000409 \tabularnewline
33 & 0.290595 & 3.4871 & 0.000324 \tabularnewline
34 & 0.297122 & 3.5655 & 0.000247 \tabularnewline
35 & 0.303638 & 3.6437 & 0.000187 \tabularnewline
36 & 0.306463 & 3.6776 & 0.000166 \tabularnewline
\hline
\end{tabular}
%Source: https://freestatistics.org/blog/index.php?pk=28654&T=1

[TABLE]
[ROW][C]Autocorrelation Function[/C][/ROW]
[ROW][C]Time lag k[/C][C]ACF(k)[/C][C]T-STAT[/C][C]P-value[/C][/ROW]
[ROW][C]1[/C][C]0.952359[/C][C]11.4283[/C][C]0[/C][/ROW]
[ROW][C]2[/C][C]0.89849[/C][C]10.7819[/C][C]0[/C][/ROW]
[ROW][C]3[/C][C]0.853613[/C][C]10.2434[/C][C]0[/C][/ROW]
[ROW][C]4[/C][C]0.813308[/C][C]9.7597[/C][C]0[/C][/ROW]
[ROW][C]5[/C][C]0.785847[/C][C]9.4302[/C][C]0[/C][/ROW]
[ROW][C]6[/C][C]0.765943[/C][C]9.1913[/C][C]0[/C][/ROW]
[ROW][C]7[/C][C]0.746952[/C][C]8.9634[/C][C]0[/C][/ROW]
[ROW][C]8[/C][C]0.73584[/C][C]8.8301[/C][C]0[/C][/ROW]
[ROW][C]9[/C][C]0.740959[/C][C]8.8915[/C][C]0[/C][/ROW]
[ROW][C]10[/C][C]0.747273[/C][C]8.9673[/C][C]0[/C][/ROW]
[ROW][C]11[/C][C]0.755145[/C][C]9.0617[/C][C]0[/C][/ROW]
[ROW][C]12[/C][C]0.756429[/C][C]9.0772[/C][C]0[/C][/ROW]
[ROW][C]13[/C][C]0.709366[/C][C]8.5124[/C][C]0[/C][/ROW]
[ROW][C]14[/C][C]0.656617[/C][C]7.8794[/C][C]0[/C][/ROW]
[ROW][C]15[/C][C]0.614761[/C][C]7.3771[/C][C]0[/C][/ROW]
[ROW][C]16[/C][C]0.573798[/C][C]6.8856[/C][C]0[/C][/ROW]
[ROW][C]17[/C][C]0.542749[/C][C]6.513[/C][C]0[/C][/ROW]
[ROW][C]18[/C][C]0.520274[/C][C]6.2433[/C][C]0[/C][/ROW]
[ROW][C]19[/C][C]0.501717[/C][C]6.0206[/C][C]0[/C][/ROW]
[ROW][C]20[/C][C]0.491266[/C][C]5.8952[/C][C]0[/C][/ROW]
[ROW][C]21[/C][C]0.497785[/C][C]5.9734[/C][C]0[/C][/ROW]
[ROW][C]22[/C][C]0.502035[/C][C]6.0244[/C][C]0[/C][/ROW]
[ROW][C]23[/C][C]0.506513[/C][C]6.0782[/C][C]0[/C][/ROW]
[ROW][C]24[/C][C]0.50781[/C][C]6.0937[/C][C]0[/C][/ROW]
[ROW][C]25[/C][C]0.470321[/C][C]5.6439[/C][C]0[/C][/ROW]
[ROW][C]26[/C][C]0.425536[/C][C]5.1064[/C][C]1e-06[/C][/ROW]
[ROW][C]27[/C][C]0.391569[/C][C]4.6988[/C][C]3e-06[/C][/ROW]
[ROW][C]28[/C][C]0.356413[/C][C]4.277[/C][C]1.7e-05[/C][/ROW]
[ROW][C]29[/C][C]0.331325[/C][C]3.9759[/C][C]5.5e-05[/C][/ROW]
[ROW][C]30[/C][C]0.310702[/C][C]3.7284[/C][C]0.000138[/C][/ROW]
[ROW][C]31[/C][C]0.293102[/C][C]3.5172[/C][C]0.000292[/C][/ROW]
[ROW][C]32[/C][C]0.284916[/C][C]3.419[/C][C]0.000409[/C][/ROW]
[ROW][C]33[/C][C]0.290595[/C][C]3.4871[/C][C]0.000324[/C][/ROW]
[ROW][C]34[/C][C]0.297122[/C][C]3.5655[/C][C]0.000247[/C][/ROW]
[ROW][C]35[/C][C]0.303638[/C][C]3.6437[/C][C]0.000187[/C][/ROW]
[ROW][C]36[/C][C]0.306463[/C][C]3.6776[/C][C]0.000166[/C][/ROW]
[/TABLE]
Source: https://freestatistics.org/blog/index.php?pk=28654&T=1

Globally Unique Identifier (entire table): ba.freestatistics.org/blog/index.php?pk=28654&T=1

As an alternative you can also use a QR Code:  

The GUIDs for individual cells are displayed in the table below:

Autocorrelation Function
Time lag kACF(k)T-STATP-value
10.95235911.42830
20.8984910.78190
30.85361310.24340
40.8133089.75970
50.7858479.43020
60.7659439.19130
70.7469528.96340
80.735848.83010
90.7409598.89150
100.7472738.96730
110.7551459.06170
120.7564299.07720
130.7093668.51240
140.6566177.87940
150.6147617.37710
160.5737986.88560
170.5427496.5130
180.5202746.24330
190.5017176.02060
200.4912665.89520
210.4977855.97340
220.5020356.02440
230.5065136.07820
240.507816.09370
250.4703215.64390
260.4255365.10641e-06
270.3915694.69883e-06
280.3564134.2771.7e-05
290.3313253.97595.5e-05
300.3107023.72840.000138
310.2931023.51720.000292
320.2849163.4190.000409
330.2905953.48710.000324
340.2971223.56550.000247
350.3036383.64370.000187
360.3064633.67760.000166


Partial Autocorrelation Function
Time lag kPACF(k)T-STATP-value
10.95235911.42830
2-0.091366-1.09640.137369
30.0732970.87960.190282
40.0120530.14460.442598
50.1207971.44960.074677
60.0554680.66560.253362
70.0164950.19790.421688
80.0987951.18550.118879
90.191062.29270.011656
100.0416490.49980.308993
110.0844261.01310.156354
12-0.015118-0.18140.428149
13-0.469189-5.63030
14-0.025247-0.3030.381177
150.025360.30430.380664
16-0.061097-0.73320.232326
170.0266340.31960.374865
180.0234480.28140.389414
190.0390380.46850.320083
200.029570.35480.361615
210.0728030.87360.191885
22-0.017471-0.20970.417118
230.0596010.71520.237817
240.0395610.47470.31785
25-0.183442-2.20130.014653
26-0.027111-0.32530.372703
270.0180570.21670.414379
28-0.049699-0.59640.275927
290.0509850.61180.270809
30-0.069162-0.82990.203971
31-0.002983-0.03580.485745
320.0417270.50070.308666
33-0.019187-0.23020.409112
340.0473980.56880.285199
350.0477320.57280.283841
36-0.008587-0.1030.459036

\begin{tabular}{lllllllll}
\hline
Partial Autocorrelation Function \tabularnewline
Time lag k & PACF(k) & T-STAT & P-value \tabularnewline
1 & 0.952359 & 11.4283 & 0 \tabularnewline
2 & -0.091366 & -1.0964 & 0.137369 \tabularnewline
3 & 0.073297 & 0.8796 & 0.190282 \tabularnewline
4 & 0.012053 & 0.1446 & 0.442598 \tabularnewline
5 & 0.120797 & 1.4496 & 0.074677 \tabularnewline
6 & 0.055468 & 0.6656 & 0.253362 \tabularnewline
7 & 0.016495 & 0.1979 & 0.421688 \tabularnewline
8 & 0.098795 & 1.1855 & 0.118879 \tabularnewline
9 & 0.19106 & 2.2927 & 0.011656 \tabularnewline
10 & 0.041649 & 0.4998 & 0.308993 \tabularnewline
11 & 0.084426 & 1.0131 & 0.156354 \tabularnewline
12 & -0.015118 & -0.1814 & 0.428149 \tabularnewline
13 & -0.469189 & -5.6303 & 0 \tabularnewline
14 & -0.025247 & -0.303 & 0.381177 \tabularnewline
15 & 0.02536 & 0.3043 & 0.380664 \tabularnewline
16 & -0.061097 & -0.7332 & 0.232326 \tabularnewline
17 & 0.026634 & 0.3196 & 0.374865 \tabularnewline
18 & 0.023448 & 0.2814 & 0.389414 \tabularnewline
19 & 0.039038 & 0.4685 & 0.320083 \tabularnewline
20 & 0.02957 & 0.3548 & 0.361615 \tabularnewline
21 & 0.072803 & 0.8736 & 0.191885 \tabularnewline
22 & -0.017471 & -0.2097 & 0.417118 \tabularnewline
23 & 0.059601 & 0.7152 & 0.237817 \tabularnewline
24 & 0.039561 & 0.4747 & 0.31785 \tabularnewline
25 & -0.183442 & -2.2013 & 0.014653 \tabularnewline
26 & -0.027111 & -0.3253 & 0.372703 \tabularnewline
27 & 0.018057 & 0.2167 & 0.414379 \tabularnewline
28 & -0.049699 & -0.5964 & 0.275927 \tabularnewline
29 & 0.050985 & 0.6118 & 0.270809 \tabularnewline
30 & -0.069162 & -0.8299 & 0.203971 \tabularnewline
31 & -0.002983 & -0.0358 & 0.485745 \tabularnewline
32 & 0.041727 & 0.5007 & 0.308666 \tabularnewline
33 & -0.019187 & -0.2302 & 0.409112 \tabularnewline
34 & 0.047398 & 0.5688 & 0.285199 \tabularnewline
35 & 0.047732 & 0.5728 & 0.283841 \tabularnewline
36 & -0.008587 & -0.103 & 0.459036 \tabularnewline
\hline
\end{tabular}
%Source: https://freestatistics.org/blog/index.php?pk=28654&T=2

[TABLE]
[ROW][C]Partial Autocorrelation Function[/C][/ROW]
[ROW][C]Time lag k[/C][C]PACF(k)[/C][C]T-STAT[/C][C]P-value[/C][/ROW]
[ROW][C]1[/C][C]0.952359[/C][C]11.4283[/C][C]0[/C][/ROW]
[ROW][C]2[/C][C]-0.091366[/C][C]-1.0964[/C][C]0.137369[/C][/ROW]
[ROW][C]3[/C][C]0.073297[/C][C]0.8796[/C][C]0.190282[/C][/ROW]
[ROW][C]4[/C][C]0.012053[/C][C]0.1446[/C][C]0.442598[/C][/ROW]
[ROW][C]5[/C][C]0.120797[/C][C]1.4496[/C][C]0.074677[/C][/ROW]
[ROW][C]6[/C][C]0.055468[/C][C]0.6656[/C][C]0.253362[/C][/ROW]
[ROW][C]7[/C][C]0.016495[/C][C]0.1979[/C][C]0.421688[/C][/ROW]
[ROW][C]8[/C][C]0.098795[/C][C]1.1855[/C][C]0.118879[/C][/ROW]
[ROW][C]9[/C][C]0.19106[/C][C]2.2927[/C][C]0.011656[/C][/ROW]
[ROW][C]10[/C][C]0.041649[/C][C]0.4998[/C][C]0.308993[/C][/ROW]
[ROW][C]11[/C][C]0.084426[/C][C]1.0131[/C][C]0.156354[/C][/ROW]
[ROW][C]12[/C][C]-0.015118[/C][C]-0.1814[/C][C]0.428149[/C][/ROW]
[ROW][C]13[/C][C]-0.469189[/C][C]-5.6303[/C][C]0[/C][/ROW]
[ROW][C]14[/C][C]-0.025247[/C][C]-0.303[/C][C]0.381177[/C][/ROW]
[ROW][C]15[/C][C]0.02536[/C][C]0.3043[/C][C]0.380664[/C][/ROW]
[ROW][C]16[/C][C]-0.061097[/C][C]-0.7332[/C][C]0.232326[/C][/ROW]
[ROW][C]17[/C][C]0.026634[/C][C]0.3196[/C][C]0.374865[/C][/ROW]
[ROW][C]18[/C][C]0.023448[/C][C]0.2814[/C][C]0.389414[/C][/ROW]
[ROW][C]19[/C][C]0.039038[/C][C]0.4685[/C][C]0.320083[/C][/ROW]
[ROW][C]20[/C][C]0.02957[/C][C]0.3548[/C][C]0.361615[/C][/ROW]
[ROW][C]21[/C][C]0.072803[/C][C]0.8736[/C][C]0.191885[/C][/ROW]
[ROW][C]22[/C][C]-0.017471[/C][C]-0.2097[/C][C]0.417118[/C][/ROW]
[ROW][C]23[/C][C]0.059601[/C][C]0.7152[/C][C]0.237817[/C][/ROW]
[ROW][C]24[/C][C]0.039561[/C][C]0.4747[/C][C]0.31785[/C][/ROW]
[ROW][C]25[/C][C]-0.183442[/C][C]-2.2013[/C][C]0.014653[/C][/ROW]
[ROW][C]26[/C][C]-0.027111[/C][C]-0.3253[/C][C]0.372703[/C][/ROW]
[ROW][C]27[/C][C]0.018057[/C][C]0.2167[/C][C]0.414379[/C][/ROW]
[ROW][C]28[/C][C]-0.049699[/C][C]-0.5964[/C][C]0.275927[/C][/ROW]
[ROW][C]29[/C][C]0.050985[/C][C]0.6118[/C][C]0.270809[/C][/ROW]
[ROW][C]30[/C][C]-0.069162[/C][C]-0.8299[/C][C]0.203971[/C][/ROW]
[ROW][C]31[/C][C]-0.002983[/C][C]-0.0358[/C][C]0.485745[/C][/ROW]
[ROW][C]32[/C][C]0.041727[/C][C]0.5007[/C][C]0.308666[/C][/ROW]
[ROW][C]33[/C][C]-0.019187[/C][C]-0.2302[/C][C]0.409112[/C][/ROW]
[ROW][C]34[/C][C]0.047398[/C][C]0.5688[/C][C]0.285199[/C][/ROW]
[ROW][C]35[/C][C]0.047732[/C][C]0.5728[/C][C]0.283841[/C][/ROW]
[ROW][C]36[/C][C]-0.008587[/C][C]-0.103[/C][C]0.459036[/C][/ROW]
[/TABLE]
Source: https://freestatistics.org/blog/index.php?pk=28654&T=2

Globally Unique Identifier (entire table): ba.freestatistics.org/blog/index.php?pk=28654&T=2

As an alternative you can also use a QR Code:  

The GUIDs for individual cells are displayed in the table below:

Partial Autocorrelation Function
Time lag kPACF(k)T-STATP-value
10.95235911.42830
2-0.091366-1.09640.137369
30.0732970.87960.190282
40.0120530.14460.442598
50.1207971.44960.074677
60.0554680.66560.253362
70.0164950.19790.421688
80.0987951.18550.118879
90.191062.29270.011656
100.0416490.49980.308993
110.0844261.01310.156354
12-0.015118-0.18140.428149
13-0.469189-5.63030
14-0.025247-0.3030.381177
150.025360.30430.380664
16-0.061097-0.73320.232326
170.0266340.31960.374865
180.0234480.28140.389414
190.0390380.46850.320083
200.029570.35480.361615
210.0728030.87360.191885
22-0.017471-0.20970.417118
230.0596010.71520.237817
240.0395610.47470.31785
25-0.183442-2.20130.014653
26-0.027111-0.32530.372703
270.0180570.21670.414379
28-0.049699-0.59640.275927
290.0509850.61180.270809
30-0.069162-0.82990.203971
31-0.002983-0.03580.485745
320.0417270.50070.308666
33-0.019187-0.23020.409112
340.0473980.56880.285199
350.0477320.57280.283841
36-0.008587-0.1030.459036


Parameters (Session):
par1 = 36 ; par2 = -0.3 ; par3 = 0 ; par4 = 0 ; par5 = 12 ;
Parameters (R input):
par1 = 36 ; par2 = -0.3 ; par3 = 0 ; par4 = 0 ; par5 = 12 ;
R code (references can be found in the software module):
if (par1 == 'Default') {
par1 = 10*log10(length(x))
} else {
par1 <- as.numeric(par1)
}
par2 <- as.numeric(par2)
par3 <- as.numeric(par3)
par4 <- as.numeric(par4)
par5 <- as.numeric(par5)
if (par2 == 0) {
x <- log(x)
} else {
x <- (x ^ par2 - 1) / par2
}
if (par3 > 0) x <- diff(x,lag=1,difference=par3)
if (par4 > 0) x <- diff(x,lag=par5,difference=par4)
bitmap(file='pic1.png')
racf <- acf(x,par1,main='Autocorrelation',xlab='lags',ylab='ACF')
dev.off()
bitmap(file='pic2.png')
rpacf <- pacf(x,par1,main='Partial Autocorrelation',xlab='lags',ylab='PACF')
dev.off()
(myacf <- c(racf$acf))
(mypacf <- c(rpacf$acf))
lengthx <- length(x)
sqrtn <- sqrt(lengthx)
load(file='createtable')
a<-table.start()
a<-table.row.start(a)
a<-table.element(a,'Autocorrelation Function',4,TRUE)
a<-table.row.end(a)
a<-table.row.start(a)
a<-table.element(a,'Time lag k',header=TRUE)
a<-table.element(a,hyperlink('basics.htm','ACF(k)','click here for more information about the Autocorrelation Function'),header=TRUE)
a<-table.element(a,'T-STAT',header=TRUE)
a<-table.element(a,'P-value',header=TRUE)
a<-table.row.end(a)
for (i in 2:(par1+1)) {
a<-table.row.start(a)
a<-table.element(a,i-1,header=TRUE)
a<-table.element(a,round(myacf[i],6))
mytstat <- myacf[i]*sqrtn
a<-table.element(a,round(mytstat,4))
a<-table.element(a,round(1-pt(abs(mytstat),lengthx),6))
a<-table.row.end(a)
}
a<-table.end(a)
table.save(a,file='mytable.tab')
a<-table.start()
a<-table.row.start(a)
a<-table.element(a,'Partial Autocorrelation Function',4,TRUE)
a<-table.row.end(a)
a<-table.row.start(a)
a<-table.element(a,'Time lag k',header=TRUE)
a<-table.element(a,hyperlink('basics.htm','PACF(k)','click here for more information about the Partial Autocorrelation Function'),header=TRUE)
a<-table.element(a,'T-STAT',header=TRUE)
a<-table.element(a,'P-value',header=TRUE)
a<-table.row.end(a)
for (i in 1:par1) {
a<-table.row.start(a)
a<-table.element(a,i,header=TRUE)
a<-table.element(a,round(mypacf[i],6))
mytstat <- mypacf[i]*sqrtn
a<-table.element(a,round(mytstat,4))
a<-table.element(a,round(1-pt(abs(mytstat),lengthx),6))
a<-table.row.end(a)
}
a<-table.end(a)
table.save(a,file='mytable1.tab')