Free Statistics

of Irreproducible Research!

Author's title

Author*The author of this computation has been verified*
R Software Modulerwasp_cross.wasp
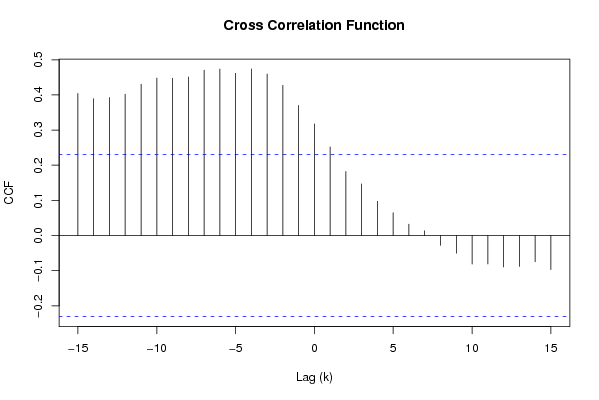
Title produced by softwareCross Correlation Function
Date of computationWed, 03 Dec 2008 04:43:31 -0700
Cite this page as followsStatistical Computations at FreeStatistics.org, Office for Research Development and Education, URL https://freestatistics.org/blog/index.php?v=date/2008/Dec/03/t1228304653etwfjej2duxnb3r.htm/, Retrieved Fri, 17 May 2024 00:32:36 +0000
Statistical Computations at FreeStatistics.org, Office for Research Development and Education, URL https://freestatistics.org/blog/index.php?pk=28635, Retrieved Fri, 17 May 2024 00:32:36 +0000
QR Codes:

Original text written by user:
IsPrivate?No (this computation is public)
User-defined keywords
Estimated Impact205
Family? (F = Feedback message, R = changed R code, M = changed R Module, P = changed Parameters, D = changed Data)
-     [Cross Correlation Function] [Q7 zonder aanpass...] [2008-12-03 11:21:09] [f77c9ab3b413812d7baee6b7ec69a15d]
F   PD  [Cross Correlation Function] [Q7 met seizoenali...] [2008-12-03 11:23:43] [f77c9ab3b413812d7baee6b7ec69a15d]
F   P       [Cross Correlation Function] [Q9 voor d=0 en D=1] [2008-12-03 11:43:31] [3fc0b50a130253095e963177b0139835] [Current]
Feedback Forum
2008-12-04 17:23:06 [Loïque Verhasselt] [reply
Q9:Door de foute interpretaties en berekeningen in Q8 krijgen we een foute cross correlatiefunctie. Omdat ik niet over de tijdreeksen beschik kan ik deze ook niet oplossen. Zie assessment Q8
2008-12-08 13:30:39 [Anouk Greeve] [reply
Aangezien Q8 niet helemaal correct is, kunnen we in Q9 niet verder. We hebben de juiste berekeningen nodig.

Post a new message
Dataseries X:
101.02
100.67
100.47
100.38
100.33
100.34
100.37
100.39
100.21
100.21
100.22
100.28
100.25
100.25
100.21
100.16
100.18
100.1
99.96
99.88
99.88
99.86
99.84
99.8
99.82
99.81
99.92
100.03
99.99
100.02
100.01
100.13
100.33
100.13
99.96
100.05
99.83
99.8
100.01
100.1
100.13
100.16
100.41
101.34
101.65
101.85
102.07
102.12
102.14
102.21
102.28
102.19
102.33
102.54
102.44
102.78
102.9
103.08
102.77
102.65
102.71
103.29
102.86
103.45
103.72
103.65
103.83
104.45
105.14
105.07
105.31
105.19
105.3
105.02
105.17
105.28
105.45
105.38
105.8
105.96
105.08
105.11
105.61
105.5
Dataseries Y:
103.68
103.64
103.37
104.3
104.15
104.09
104.21
104.27
104
103.36
104.2
104.12
103.79
104.65
103.84
103.98
103.83
104.34
103.76
103.57
103.06
103.06
102.6
103.41
103.15
103.33
103.96
104.91
104.23
103.68
104.16
104.49
104.23
104.21
103.74
103.96
104.02
104.15
103.74
103.23
103.69
103.46
102.14
102.39
102.19
102.02
102.64
103.52
103.32
103.65
104.25
101.74
102.08
101.35
102.79
102.21
101.78
101.25
101.8
103
104.17
104.08
105.24
104.72
104.77
104.39
104.14
105.15
105.07
104.54
106.03
107.24
108.2
109.15
110.1
109.48
109.96
110.13
110.53
110.82
110.06
110.05
109.49
109.95


Summary of computational transaction
Raw Inputview raw input (R code)
Raw Outputview raw output of R engine
Computing time5 seconds
R Server'George Udny Yule' @ 72.249.76.132

\begin{tabular}{lllllllll}
\hline
Summary of computational transaction \tabularnewline
Raw Input & view raw input (R code)  \tabularnewline
Raw Output & view raw output of R engine  \tabularnewline
Computing time & 5 seconds \tabularnewline
R Server & 'George Udny Yule' @ 72.249.76.132 \tabularnewline
\hline
\end{tabular}
%Source: https://freestatistics.org/blog/index.php?pk=28635&T=0

[TABLE]
[ROW][C]Summary of computational transaction[/C][/ROW]
[ROW][C]Raw Input[/C][C]view raw input (R code) [/C][/ROW]
[ROW][C]Raw Output[/C][C]view raw output of R engine [/C][/ROW]
[ROW][C]Computing time[/C][C]5 seconds[/C][/ROW]
[ROW][C]R Server[/C][C]'George Udny Yule' @ 72.249.76.132[/C][/ROW]
[/TABLE]
Source: https://freestatistics.org/blog/index.php?pk=28635&T=0

Globally Unique Identifier (entire table): ba.freestatistics.org/blog/index.php?pk=28635&T=0

As an alternative you can also use a QR Code:  

The GUIDs for individual cells are displayed in the table below:

Summary of computational transaction
Raw Inputview raw input (R code)
Raw Outputview raw output of R engine
Computing time5 seconds
R Server'George Udny Yule' @ 72.249.76.132


Cross Correlation Function
ParameterValue
Box-Cox transformation parameter (lambda) of X series1
Degree of non-seasonal differencing (d) of X series0
Degree of seasonal differencing (D) of X series1
Seasonal Period (s)12
Box-Cox transformation parameter (lambda) of Y series1
Degree of non-seasonal differencing (d) of Y series0
Degree of seasonal differencing (D) of Y series1
krho(Y[t],X[t+k])
-150.404160018235655
-140.389453997488092
-130.39266939973735
-120.402052604035221
-110.430434410446444
-100.447898181450575
-90.447557003239305
-80.450646522564459
-70.470455283380543
-60.473442098810454
-50.461672175041009
-40.47391149021813
-30.459485672397959
-20.427466661389071
-10.370105357306745
00.317264844386939
10.252048961442532
20.182079750688978
30.146791440667919
40.0975289604110334
50.0648464881370568
60.0320706540221601
70.0131856160819718
8-0.0281445124310549
9-0.0503266917522291
10-0.081446718019648
11-0.0808702609249813
12-0.0893525607758752
13-0.0879555123888619
14-0.0747639107671469
15-0.0969287058166762

\begin{tabular}{lllllllll}
\hline
Cross Correlation Function \tabularnewline
Parameter & Value \tabularnewline
Box-Cox transformation parameter (lambda) of X series & 1 \tabularnewline
Degree of non-seasonal differencing (d) of X series & 0 \tabularnewline
Degree of seasonal differencing (D) of X series & 1 \tabularnewline
Seasonal Period (s) & 12 \tabularnewline
Box-Cox transformation parameter (lambda) of Y series & 1 \tabularnewline
Degree of non-seasonal differencing (d) of Y series & 0 \tabularnewline
Degree of seasonal differencing (D) of Y series & 1 \tabularnewline
k & rho(Y[t],X[t+k]) \tabularnewline
-15 & 0.404160018235655 \tabularnewline
-14 & 0.389453997488092 \tabularnewline
-13 & 0.39266939973735 \tabularnewline
-12 & 0.402052604035221 \tabularnewline
-11 & 0.430434410446444 \tabularnewline
-10 & 0.447898181450575 \tabularnewline
-9 & 0.447557003239305 \tabularnewline
-8 & 0.450646522564459 \tabularnewline
-7 & 0.470455283380543 \tabularnewline
-6 & 0.473442098810454 \tabularnewline
-5 & 0.461672175041009 \tabularnewline
-4 & 0.47391149021813 \tabularnewline
-3 & 0.459485672397959 \tabularnewline
-2 & 0.427466661389071 \tabularnewline
-1 & 0.370105357306745 \tabularnewline
0 & 0.317264844386939 \tabularnewline
1 & 0.252048961442532 \tabularnewline
2 & 0.182079750688978 \tabularnewline
3 & 0.146791440667919 \tabularnewline
4 & 0.0975289604110334 \tabularnewline
5 & 0.0648464881370568 \tabularnewline
6 & 0.0320706540221601 \tabularnewline
7 & 0.0131856160819718 \tabularnewline
8 & -0.0281445124310549 \tabularnewline
9 & -0.0503266917522291 \tabularnewline
10 & -0.081446718019648 \tabularnewline
11 & -0.0808702609249813 \tabularnewline
12 & -0.0893525607758752 \tabularnewline
13 & -0.0879555123888619 \tabularnewline
14 & -0.0747639107671469 \tabularnewline
15 & -0.0969287058166762 \tabularnewline
\hline
\end{tabular}
%Source: https://freestatistics.org/blog/index.php?pk=28635&T=1

[TABLE]
[ROW][C]Cross Correlation Function[/C][/ROW]
[ROW][C]Parameter[/C][C]Value[/C][/ROW]
[ROW][C]Box-Cox transformation parameter (lambda) of X series[/C][C]1[/C][/ROW]
[ROW][C]Degree of non-seasonal differencing (d) of X series[/C][C]0[/C][/ROW]
[ROW][C]Degree of seasonal differencing (D) of X series[/C][C]1[/C][/ROW]
[ROW][C]Seasonal Period (s)[/C][C]12[/C][/ROW]
[ROW][C]Box-Cox transformation parameter (lambda) of Y series[/C][C]1[/C][/ROW]
[ROW][C]Degree of non-seasonal differencing (d) of Y series[/C][C]0[/C][/ROW]
[ROW][C]Degree of seasonal differencing (D) of Y series[/C][C]1[/C][/ROW]
[ROW][C]k[/C][C]rho(Y[t],X[t+k])[/C][/ROW]
[ROW][C]-15[/C][C]0.404160018235655[/C][/ROW]
[ROW][C]-14[/C][C]0.389453997488092[/C][/ROW]
[ROW][C]-13[/C][C]0.39266939973735[/C][/ROW]
[ROW][C]-12[/C][C]0.402052604035221[/C][/ROW]
[ROW][C]-11[/C][C]0.430434410446444[/C][/ROW]
[ROW][C]-10[/C][C]0.447898181450575[/C][/ROW]
[ROW][C]-9[/C][C]0.447557003239305[/C][/ROW]
[ROW][C]-8[/C][C]0.450646522564459[/C][/ROW]
[ROW][C]-7[/C][C]0.470455283380543[/C][/ROW]
[ROW][C]-6[/C][C]0.473442098810454[/C][/ROW]
[ROW][C]-5[/C][C]0.461672175041009[/C][/ROW]
[ROW][C]-4[/C][C]0.47391149021813[/C][/ROW]
[ROW][C]-3[/C][C]0.459485672397959[/C][/ROW]
[ROW][C]-2[/C][C]0.427466661389071[/C][/ROW]
[ROW][C]-1[/C][C]0.370105357306745[/C][/ROW]
[ROW][C]0[/C][C]0.317264844386939[/C][/ROW]
[ROW][C]1[/C][C]0.252048961442532[/C][/ROW]
[ROW][C]2[/C][C]0.182079750688978[/C][/ROW]
[ROW][C]3[/C][C]0.146791440667919[/C][/ROW]
[ROW][C]4[/C][C]0.0975289604110334[/C][/ROW]
[ROW][C]5[/C][C]0.0648464881370568[/C][/ROW]
[ROW][C]6[/C][C]0.0320706540221601[/C][/ROW]
[ROW][C]7[/C][C]0.0131856160819718[/C][/ROW]
[ROW][C]8[/C][C]-0.0281445124310549[/C][/ROW]
[ROW][C]9[/C][C]-0.0503266917522291[/C][/ROW]
[ROW][C]10[/C][C]-0.081446718019648[/C][/ROW]
[ROW][C]11[/C][C]-0.0808702609249813[/C][/ROW]
[ROW][C]12[/C][C]-0.0893525607758752[/C][/ROW]
[ROW][C]13[/C][C]-0.0879555123888619[/C][/ROW]
[ROW][C]14[/C][C]-0.0747639107671469[/C][/ROW]
[ROW][C]15[/C][C]-0.0969287058166762[/C][/ROW]
[/TABLE]
Source: https://freestatistics.org/blog/index.php?pk=28635&T=1

Globally Unique Identifier (entire table): ba.freestatistics.org/blog/index.php?pk=28635&T=1

As an alternative you can also use a QR Code:  

The GUIDs for individual cells are displayed in the table below:

Cross Correlation Function
ParameterValue
Box-Cox transformation parameter (lambda) of X series1
Degree of non-seasonal differencing (d) of X series0
Degree of seasonal differencing (D) of X series1
Seasonal Period (s)12
Box-Cox transformation parameter (lambda) of Y series1
Degree of non-seasonal differencing (d) of Y series0
Degree of seasonal differencing (D) of Y series1
krho(Y[t],X[t+k])
-150.404160018235655
-140.389453997488092
-130.39266939973735
-120.402052604035221
-110.430434410446444
-100.447898181450575
-90.447557003239305
-80.450646522564459
-70.470455283380543
-60.473442098810454
-50.461672175041009
-40.47391149021813
-30.459485672397959
-20.427466661389071
-10.370105357306745
00.317264844386939
10.252048961442532
20.182079750688978
30.146791440667919
40.0975289604110334
50.0648464881370568
60.0320706540221601
70.0131856160819718
8-0.0281445124310549
9-0.0503266917522291
10-0.081446718019648
11-0.0808702609249813
12-0.0893525607758752
13-0.0879555123888619
14-0.0747639107671469
15-0.0969287058166762


Parameters (Session):
par1 = 1 ; par2 = 0 ; par3 = 1 ; par4 = 12 ; par5 = 1 ; par6 = 0 ; par7 = 1 ;
Parameters (R input):
par1 = 1 ; par2 = 0 ; par3 = 1 ; par4 = 12 ; par5 = 1 ; par6 = 0 ; par7 = 1 ;
R code (references can be found in the software module):
par1 <- as.numeric(par1)
par2 <- as.numeric(par2)
par3 <- as.numeric(par3)
par4 <- as.numeric(par4)
par5 <- as.numeric(par5)
par6 <- as.numeric(par6)
par7 <- as.numeric(par7)
if (par1 == 0) {
x <- log(x)
} else {
x <- (x ^ par1 - 1) / par1
}
if (par5 == 0) {
y <- log(y)
} else {
y <- (y ^ par5 - 1) / par5
}
if (par2 > 0) x <- diff(x,lag=1,difference=par2)
if (par6 > 0) y <- diff(y,lag=1,difference=par6)
if (par3 > 0) x <- diff(x,lag=par4,difference=par3)
if (par7 > 0) y <- diff(y,lag=par4,difference=par7)
x
y
bitmap(file='test1.png')
(r <- ccf(x,y,main='Cross Correlation Function',ylab='CCF',xlab='Lag (k)'))
dev.off()
load(file='createtable')
a<-table.start()
a<-table.row.start(a)
a<-table.element(a,'Cross Correlation Function',2,TRUE)
a<-table.row.end(a)
a<-table.row.start(a)
a<-table.element(a,'Parameter',header=TRUE)
a<-table.element(a,'Value',header=TRUE)
a<-table.row.end(a)
a<-table.row.start(a)
a<-table.element(a,'Box-Cox transformation parameter (lambda) of X series',header=TRUE)
a<-table.element(a,par1)
a<-table.row.end(a)
a<-table.row.start(a)
a<-table.element(a,'Degree of non-seasonal differencing (d) of X series',header=TRUE)
a<-table.element(a,par2)
a<-table.row.end(a)
a<-table.row.start(a)
a<-table.element(a,'Degree of seasonal differencing (D) of X series',header=TRUE)
a<-table.element(a,par3)
a<-table.row.end(a)
a<-table.row.start(a)
a<-table.element(a,'Seasonal Period (s)',header=TRUE)
a<-table.element(a,par4)
a<-table.row.end(a)
a<-table.row.start(a)
a<-table.element(a,'Box-Cox transformation parameter (lambda) of Y series',header=TRUE)
a<-table.element(a,par5)
a<-table.row.end(a)
a<-table.row.start(a)
a<-table.element(a,'Degree of non-seasonal differencing (d) of Y series',header=TRUE)
a<-table.element(a,par6)
a<-table.row.end(a)
a<-table.row.start(a)
a<-table.element(a,'Degree of seasonal differencing (D) of Y series',header=TRUE)
a<-table.element(a,par7)
a<-table.row.end(a)
a<-table.row.start(a)
a<-table.element(a,'k',header=TRUE)
a<-table.element(a,'rho(Y[t],X[t+k])',header=TRUE)
a<-table.row.end(a)
mylength <- length(r$acf)
myhalf <- floor((mylength-1)/2)
for (i in 1:mylength) {
a<-table.row.start(a)
a<-table.element(a,i-myhalf-1,header=TRUE)
a<-table.element(a,r$acf[i])
a<-table.row.end(a)
}
a<-table.end(a)
table.save(a,file='mytable.tab')