Free Statistics

of Irreproducible Research!

Author's title

Author*Unverified author*
R Software Modulerwasp_cross.wasp
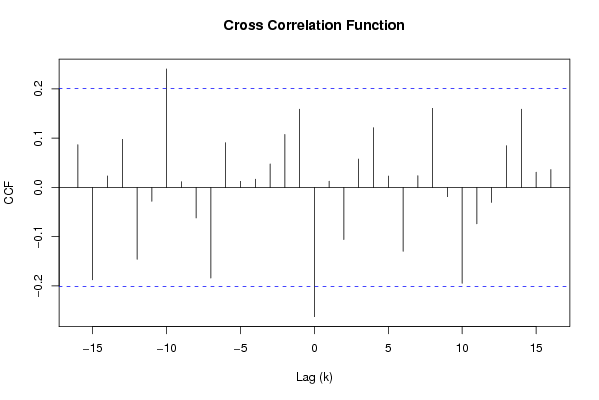
Title produced by softwareCross Correlation Function
Date of computationWed, 03 Dec 2008 01:56:23 -0700
Cite this page as followsStatistical Computations at FreeStatistics.org, Office for Research Development and Education, URL https://freestatistics.org/blog/index.php?v=date/2008/Dec/03/t12282946121i28d24s48kp30n.htm/, Retrieved Fri, 17 May 2024 14:36:09 +0000
Statistical Computations at FreeStatistics.org, Office for Research Development and Education, URL https://freestatistics.org/blog/index.php?pk=28581, Retrieved Fri, 17 May 2024 14:36:09 +0000
QR Codes:

Original text written by user:
IsPrivate?No (this computation is public)
User-defined keywords
Estimated Impact198
Family? (F = Feedback message, R = changed R code, M = changed R Module, P = changed Parameters, D = changed Data)
F       [Cross Correlation Function] [] [2008-12-03 08:56:23] [ee5aee65e0c44ac54c8097a6e28e37f4] [Current]
Feedback Forum
2008-12-04 11:50:50 [Loïque Verhasselt] [reply
Q8: De student past de juiste transformaties door met behulp van de SD Mean plot voor de correcte lambda's te vinden en Variantie reductiemodel voor de kleine en grote d te vinden.Zo bekomt de student een stationair model.Het had ook mogelijk geweest om stap voor stap de transformaties door te voeren en in kaart te brengen op de cross correlatie functie.
Q9: De student bekomt een volledig stationaire cross correlatie functie. Er is geen sprake meer van een trend, we zien ook geen seizoenaliteit meer. Door het invoeren van de juiste lambda's krijgen we ook een constante spreiding.

Post a new message
Dataseries X:
1.0137
0.9834
0.9643
0.947
0.906
0.9492
0.9397
0.9041
0.8721
0.8552
0.8564
0.8973
0.9383
0.9217
0.9095
0.892
0.8742
0.8532
0.8607
0.9005
0.9111
0.9059
0.8883
0.8924
0.8833
0.87
0.8758
0.8858
0.917
0.9554
0.9922
0.9778
0.9808
0.9811
1.0014
1.0183
1.0622
1.0773
1.0807
1.0848
1.1582
1.1663
1.1372
1.1139
1.1222
1.1692
1.1702
1.2286
1.2613
1.2646
1.2262
1.1985
1.2007
1.2138
1.2266
1.2176
1.2218
1.249
1.2991
1.3408
1.3119
1.3014
1.3201
1.2938
1.2694
1.2165
1.2037
1.2292
1.2256
1.2015
1.1786
1.1856
1.2103
1.1938
1.202
1.2271
1.277
1.265
1.2684
1.2811
1.2727
1.2611
1.2881
1.3213
1.2999
1.3074
1.3242
1.3516
1.3511
1.3419
1.3716
1.3622
1.3896
1.4227
1.4684
1.457
1.4718
Dataseries Y:
1.5421
1.5642
1.5827
1.5878
1.5703
1.5968
1.5978
1.5575
1.5749
1.6176
1.6387
1.6422
1.6891
1.7236
1.8072
1.7847
1.6813
1.6469
1.689
1.7169
1.8036
1.7955
1.7172
1.7348
1.7094
1.6963
1.6695
1.6537
1.6662
1.6793
1.7922
1.8045
1.7927
1.7831
1.7847
1.8076
1.8218
1.8112
1.795
1.7813
1.7866
1.7552
1.7184
1.7114
1.6967
1.6867
1.6337
1.6626
1.6374
1.626
1.637
1.6142
1.7033
1.7483
1.7135
1.7147
1.7396
1.7049
1.6867
1.7462
1.7147
1.667
1.6806
1.6738
1.6571
1.5875
1.6002
1.6144
1.6009
1.5937
1.603
1.5979
1.6152
1.6102
1.654
1.6662
1.6715
1.7104
1.6869
1.6788
1.6839
1.6733
1.6684
1.6814
1.6602
1.6708
1.6704
1.6336
1.6378
1.593
1.5809
1.6442
1.6445
1.5837
1.6373
1.6703
1.6694


Summary of computational transaction
Raw Inputview raw input (R code)
Raw Outputview raw output of R engine
Computing time1 seconds
R Server'Sir Ronald Aylmer Fisher' @ 193.190.124.24

\begin{tabular}{lllllllll}
\hline
Summary of computational transaction \tabularnewline
Raw Input & view raw input (R code)  \tabularnewline
Raw Output & view raw output of R engine  \tabularnewline
Computing time & 1 seconds \tabularnewline
R Server & 'Sir Ronald Aylmer Fisher' @ 193.190.124.24 \tabularnewline
\hline
\end{tabular}
%Source: https://freestatistics.org/blog/index.php?pk=28581&T=0

[TABLE]
[ROW][C]Summary of computational transaction[/C][/ROW]
[ROW][C]Raw Input[/C][C]view raw input (R code) [/C][/ROW]
[ROW][C]Raw Output[/C][C]view raw output of R engine [/C][/ROW]
[ROW][C]Computing time[/C][C]1 seconds[/C][/ROW]
[ROW][C]R Server[/C][C]'Sir Ronald Aylmer Fisher' @ 193.190.124.24[/C][/ROW]
[/TABLE]
Source: https://freestatistics.org/blog/index.php?pk=28581&T=0

Globally Unique Identifier (entire table): ba.freestatistics.org/blog/index.php?pk=28581&T=0

As an alternative you can also use a QR Code:  

The GUIDs for individual cells are displayed in the table below:

Summary of computational transaction
Raw Inputview raw input (R code)
Raw Outputview raw output of R engine
Computing time1 seconds
R Server'Sir Ronald Aylmer Fisher' @ 193.190.124.24


Cross Correlation Function
ParameterValue
Box-Cox transformation parameter (lambda) of X series0.4
Degree of non-seasonal differencing (d) of X series2
Degree of seasonal differencing (D) of X series0
Seasonal Period (s)1
Box-Cox transformation parameter (lambda) of Y series-0.3
Degree of non-seasonal differencing (d) of Y series1
Degree of seasonal differencing (D) of Y series0
krho(Y[t],X[t+k])
-160.0867120333748546
-15-0.18724183791401
-140.0232934850667761
-130.0975406130169013
-12-0.145692112144473
-11-0.0280995973618188
-100.240450464289303
-90.0117627521660333
-8-0.061768859286754
-7-0.183790716887783
-60.0909065074545321
-50.0123524895636575
-40.0165620796541775
-30.0477786616091368
-20.107522160769518
-10.158643477179124
0-0.262216229052452
10.0126768154295005
2-0.105891221142996
30.0574554401620942
40.121357690438012
50.0230235581452189
6-0.129488022175745
70.0236888983184351
80.160539056333304
9-0.0186597895973501
10-0.194559487172378
11-0.0738460364664491
12-0.030370304604375
130.0846124084157535
140.158553514625372
150.0310267476242623
160.0362110756144242

\begin{tabular}{lllllllll}
\hline
Cross Correlation Function \tabularnewline
Parameter & Value \tabularnewline
Box-Cox transformation parameter (lambda) of X series & 0.4 \tabularnewline
Degree of non-seasonal differencing (d) of X series & 2 \tabularnewline
Degree of seasonal differencing (D) of X series & 0 \tabularnewline
Seasonal Period (s) & 1 \tabularnewline
Box-Cox transformation parameter (lambda) of Y series & -0.3 \tabularnewline
Degree of non-seasonal differencing (d) of Y series & 1 \tabularnewline
Degree of seasonal differencing (D) of Y series & 0 \tabularnewline
k & rho(Y[t],X[t+k]) \tabularnewline
-16 & 0.0867120333748546 \tabularnewline
-15 & -0.18724183791401 \tabularnewline
-14 & 0.0232934850667761 \tabularnewline
-13 & 0.0975406130169013 \tabularnewline
-12 & -0.145692112144473 \tabularnewline
-11 & -0.0280995973618188 \tabularnewline
-10 & 0.240450464289303 \tabularnewline
-9 & 0.0117627521660333 \tabularnewline
-8 & -0.061768859286754 \tabularnewline
-7 & -0.183790716887783 \tabularnewline
-6 & 0.0909065074545321 \tabularnewline
-5 & 0.0123524895636575 \tabularnewline
-4 & 0.0165620796541775 \tabularnewline
-3 & 0.0477786616091368 \tabularnewline
-2 & 0.107522160769518 \tabularnewline
-1 & 0.158643477179124 \tabularnewline
0 & -0.262216229052452 \tabularnewline
1 & 0.0126768154295005 \tabularnewline
2 & -0.105891221142996 \tabularnewline
3 & 0.0574554401620942 \tabularnewline
4 & 0.121357690438012 \tabularnewline
5 & 0.0230235581452189 \tabularnewline
6 & -0.129488022175745 \tabularnewline
7 & 0.0236888983184351 \tabularnewline
8 & 0.160539056333304 \tabularnewline
9 & -0.0186597895973501 \tabularnewline
10 & -0.194559487172378 \tabularnewline
11 & -0.0738460364664491 \tabularnewline
12 & -0.030370304604375 \tabularnewline
13 & 0.0846124084157535 \tabularnewline
14 & 0.158553514625372 \tabularnewline
15 & 0.0310267476242623 \tabularnewline
16 & 0.0362110756144242 \tabularnewline
\hline
\end{tabular}
%Source: https://freestatistics.org/blog/index.php?pk=28581&T=1

[TABLE]
[ROW][C]Cross Correlation Function[/C][/ROW]
[ROW][C]Parameter[/C][C]Value[/C][/ROW]
[ROW][C]Box-Cox transformation parameter (lambda) of X series[/C][C]0.4[/C][/ROW]
[ROW][C]Degree of non-seasonal differencing (d) of X series[/C][C]2[/C][/ROW]
[ROW][C]Degree of seasonal differencing (D) of X series[/C][C]0[/C][/ROW]
[ROW][C]Seasonal Period (s)[/C][C]1[/C][/ROW]
[ROW][C]Box-Cox transformation parameter (lambda) of Y series[/C][C]-0.3[/C][/ROW]
[ROW][C]Degree of non-seasonal differencing (d) of Y series[/C][C]1[/C][/ROW]
[ROW][C]Degree of seasonal differencing (D) of Y series[/C][C]0[/C][/ROW]
[ROW][C]k[/C][C]rho(Y[t],X[t+k])[/C][/ROW]
[ROW][C]-16[/C][C]0.0867120333748546[/C][/ROW]
[ROW][C]-15[/C][C]-0.18724183791401[/C][/ROW]
[ROW][C]-14[/C][C]0.0232934850667761[/C][/ROW]
[ROW][C]-13[/C][C]0.0975406130169013[/C][/ROW]
[ROW][C]-12[/C][C]-0.145692112144473[/C][/ROW]
[ROW][C]-11[/C][C]-0.0280995973618188[/C][/ROW]
[ROW][C]-10[/C][C]0.240450464289303[/C][/ROW]
[ROW][C]-9[/C][C]0.0117627521660333[/C][/ROW]
[ROW][C]-8[/C][C]-0.061768859286754[/C][/ROW]
[ROW][C]-7[/C][C]-0.183790716887783[/C][/ROW]
[ROW][C]-6[/C][C]0.0909065074545321[/C][/ROW]
[ROW][C]-5[/C][C]0.0123524895636575[/C][/ROW]
[ROW][C]-4[/C][C]0.0165620796541775[/C][/ROW]
[ROW][C]-3[/C][C]0.0477786616091368[/C][/ROW]
[ROW][C]-2[/C][C]0.107522160769518[/C][/ROW]
[ROW][C]-1[/C][C]0.158643477179124[/C][/ROW]
[ROW][C]0[/C][C]-0.262216229052452[/C][/ROW]
[ROW][C]1[/C][C]0.0126768154295005[/C][/ROW]
[ROW][C]2[/C][C]-0.105891221142996[/C][/ROW]
[ROW][C]3[/C][C]0.0574554401620942[/C][/ROW]
[ROW][C]4[/C][C]0.121357690438012[/C][/ROW]
[ROW][C]5[/C][C]0.0230235581452189[/C][/ROW]
[ROW][C]6[/C][C]-0.129488022175745[/C][/ROW]
[ROW][C]7[/C][C]0.0236888983184351[/C][/ROW]
[ROW][C]8[/C][C]0.160539056333304[/C][/ROW]
[ROW][C]9[/C][C]-0.0186597895973501[/C][/ROW]
[ROW][C]10[/C][C]-0.194559487172378[/C][/ROW]
[ROW][C]11[/C][C]-0.0738460364664491[/C][/ROW]
[ROW][C]12[/C][C]-0.030370304604375[/C][/ROW]
[ROW][C]13[/C][C]0.0846124084157535[/C][/ROW]
[ROW][C]14[/C][C]0.158553514625372[/C][/ROW]
[ROW][C]15[/C][C]0.0310267476242623[/C][/ROW]
[ROW][C]16[/C][C]0.0362110756144242[/C][/ROW]
[/TABLE]
Source: https://freestatistics.org/blog/index.php?pk=28581&T=1

Globally Unique Identifier (entire table): ba.freestatistics.org/blog/index.php?pk=28581&T=1

As an alternative you can also use a QR Code:  

The GUIDs for individual cells are displayed in the table below:

Cross Correlation Function
ParameterValue
Box-Cox transformation parameter (lambda) of X series0.4
Degree of non-seasonal differencing (d) of X series2
Degree of seasonal differencing (D) of X series0
Seasonal Period (s)1
Box-Cox transformation parameter (lambda) of Y series-0.3
Degree of non-seasonal differencing (d) of Y series1
Degree of seasonal differencing (D) of Y series0
krho(Y[t],X[t+k])
-160.0867120333748546
-15-0.18724183791401
-140.0232934850667761
-130.0975406130169013
-12-0.145692112144473
-11-0.0280995973618188
-100.240450464289303
-90.0117627521660333
-8-0.061768859286754
-7-0.183790716887783
-60.0909065074545321
-50.0123524895636575
-40.0165620796541775
-30.0477786616091368
-20.107522160769518
-10.158643477179124
0-0.262216229052452
10.0126768154295005
2-0.105891221142996
30.0574554401620942
40.121357690438012
50.0230235581452189
6-0.129488022175745
70.0236888983184351
80.160539056333304
9-0.0186597895973501
10-0.194559487172378
11-0.0738460364664491
12-0.030370304604375
130.0846124084157535
140.158553514625372
150.0310267476242623
160.0362110756144242


Parameters (Session):
par1 = 0.4 ; par2 = 2 ; par3 = 0 ; par4 = 1 ; par5 = -0.3 ; par6 = 1 ; par7 = 0 ;
Parameters (R input):
par1 = 0.4 ; par2 = 2 ; par3 = 0 ; par4 = 1 ; par5 = -0.3 ; par6 = 1 ; par7 = 0 ;
R code (references can be found in the software module):
par1 <- as.numeric(par1)
par2 <- as.numeric(par2)
par3 <- as.numeric(par3)
par4 <- as.numeric(par4)
par5 <- as.numeric(par5)
par6 <- as.numeric(par6)
par7 <- as.numeric(par7)
if (par1 == 0) {
x <- log(x)
} else {
x <- (x ^ par1 - 1) / par1
}
if (par5 == 0) {
y <- log(y)
} else {
y <- (y ^ par5 - 1) / par5
}
if (par2 > 0) x <- diff(x,lag=1,difference=par2)
if (par6 > 0) y <- diff(y,lag=1,difference=par6)
if (par3 > 0) x <- diff(x,lag=par4,difference=par3)
if (par7 > 0) y <- diff(y,lag=par4,difference=par7)
x
y
bitmap(file='test1.png')
(r <- ccf(x,y,main='Cross Correlation Function',ylab='CCF',xlab='Lag (k)'))
dev.off()
load(file='createtable')
a<-table.start()
a<-table.row.start(a)
a<-table.element(a,'Cross Correlation Function',2,TRUE)
a<-table.row.end(a)
a<-table.row.start(a)
a<-table.element(a,'Parameter',header=TRUE)
a<-table.element(a,'Value',header=TRUE)
a<-table.row.end(a)
a<-table.row.start(a)
a<-table.element(a,'Box-Cox transformation parameter (lambda) of X series',header=TRUE)
a<-table.element(a,par1)
a<-table.row.end(a)
a<-table.row.start(a)
a<-table.element(a,'Degree of non-seasonal differencing (d) of X series',header=TRUE)
a<-table.element(a,par2)
a<-table.row.end(a)
a<-table.row.start(a)
a<-table.element(a,'Degree of seasonal differencing (D) of X series',header=TRUE)
a<-table.element(a,par3)
a<-table.row.end(a)
a<-table.row.start(a)
a<-table.element(a,'Seasonal Period (s)',header=TRUE)
a<-table.element(a,par4)
a<-table.row.end(a)
a<-table.row.start(a)
a<-table.element(a,'Box-Cox transformation parameter (lambda) of Y series',header=TRUE)
a<-table.element(a,par5)
a<-table.row.end(a)
a<-table.row.start(a)
a<-table.element(a,'Degree of non-seasonal differencing (d) of Y series',header=TRUE)
a<-table.element(a,par6)
a<-table.row.end(a)
a<-table.row.start(a)
a<-table.element(a,'Degree of seasonal differencing (D) of Y series',header=TRUE)
a<-table.element(a,par7)
a<-table.row.end(a)
a<-table.row.start(a)
a<-table.element(a,'k',header=TRUE)
a<-table.element(a,'rho(Y[t],X[t+k])',header=TRUE)
a<-table.row.end(a)
mylength <- length(r$acf)
myhalf <- floor((mylength-1)/2)
for (i in 1:mylength) {
a<-table.row.start(a)
a<-table.element(a,i-myhalf-1,header=TRUE)
a<-table.element(a,r$acf[i])
a<-table.row.end(a)
}
a<-table.end(a)
table.save(a,file='mytable.tab')