Free Statistics

of Irreproducible Research!

Author's title

Author*Unverified author*
R Software Modulerwasp_autocorrelation.wasp
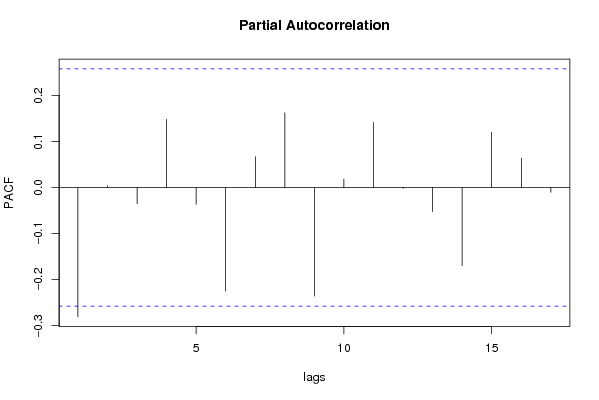
Title produced by software(Partial) Autocorrelation Function
Date of computationWed, 03 Dec 2008 01:00:29 -0700
Cite this page as followsStatistical Computations at FreeStatistics.org, Office for Research Development and Education, URL https://freestatistics.org/blog/index.php?v=date/2008/Dec/03/t12282912747pfnxdz8v65il2j.htm/, Retrieved Fri, 17 May 2024 14:14:11 +0000
Statistical Computations at FreeStatistics.org, Office for Research Development and Education, URL https://freestatistics.org/blog/index.php?pk=28564, Retrieved Fri, 17 May 2024 14:14:11 +0000
QR Codes:

Original text written by user:
IsPrivate?No (this computation is public)
User-defined keywords
Estimated Impact237
Family? (F = Feedback message, R = changed R code, M = changed R Module, P = changed Parameters, D = changed Data)
F       [(Partial) Autocorrelation Function] [] [2008-12-03 08:00:29] [e02910eed3830f1815f587e12f46cbdb] [Current]
- RMP     [Standard Deviation-Mean Plot] [] [2008-12-06 12:01:37] [996314793dac993597edc1ca2281ff39]
-   P     [(Partial) Autocorrelation Function] [] [2008-12-06 12:06:44] [996314793dac993597edc1ca2281ff39]
Feedback Forum
2008-12-06 12:11:05 [Angelique Van de Vijver] [reply
Student heeft foute berekening gemaakt. ik heb de juiste berekening gemaakt in volgende link: http://www.freestatistics.org/blog/date/2008/Dec/06/t1228565241yplk35uqp6gjosw.htm
Number of time lags= 36(student had hier default); lambda= -0.2(student had hier 1)Ik heb d=1 en D=1 genomen omdat deze mij de beste differentiatie lijkt(leid tot de meest stationaire ACF)
Ik heb de standard deviation plot gemaakt:
http://www.freestatistics.org/blog/date/2008/Dec/06/t1228564925nqihg0yignvvmkd.htm
Hier zien we dat lambda waarde gelijk is aan -0.16=> ongeveer -0.2 (dit moeten we dan ook invullen als lambda-parameter)
We hebben dus 1 keer niet-seizoenaal gedifferentieerd (d=1)en 1 keer seizoenaal gedifferentieerd(D=1)
Na deze differentiatie is de langetermijntrend en de seizoenaliteit geëlimineerd.

Post a new message
Dataseries X:
104.0
107.9
113.8
113.8
123.1
125.1
137.6
134.0
140.3
152.1
150.6
167.3
153.2
142.0
154.4
158.5
180.9
181.3
172.4
192.0
199.3
215.4
214.3
201.5
190.5
196.0
215.7
209.4
214.1
237.8
239.0
237.8
251.5
248.8
215.4
201.2
203.1
214.2
188.9
203.0
213.3
228.5
228.2
240.9
258.8
248.5
269.2
289.6
323.4
317.2
322.8
340.9
368.2
388.5
441.2
474.3
483.9
417.9
365.9
263.0


Summary of computational transaction
Raw Inputview raw input (R code)
Raw Outputview raw output of R engine
Computing time2 seconds
R Server'Sir Ronald Aylmer Fisher' @ 193.190.124.24

\begin{tabular}{lllllllll}
\hline
Summary of computational transaction \tabularnewline
Raw Input & view raw input (R code)  \tabularnewline
Raw Output & view raw output of R engine  \tabularnewline
Computing time & 2 seconds \tabularnewline
R Server & 'Sir Ronald Aylmer Fisher' @ 193.190.124.24 \tabularnewline
\hline
\end{tabular}
%Source: https://freestatistics.org/blog/index.php?pk=28564&T=0

[TABLE]
[ROW][C]Summary of computational transaction[/C][/ROW]
[ROW][C]Raw Input[/C][C]view raw input (R code) [/C][/ROW]
[ROW][C]Raw Output[/C][C]view raw output of R engine [/C][/ROW]
[ROW][C]Computing time[/C][C]2 seconds[/C][/ROW]
[ROW][C]R Server[/C][C]'Sir Ronald Aylmer Fisher' @ 193.190.124.24[/C][/ROW]
[/TABLE]
Source: https://freestatistics.org/blog/index.php?pk=28564&T=0

Globally Unique Identifier (entire table): ba.freestatistics.org/blog/index.php?pk=28564&T=0

As an alternative you can also use a QR Code:  

The GUIDs for individual cells are displayed in the table below:

Summary of computational transaction
Raw Inputview raw input (R code)
Raw Outputview raw output of R engine
Computing time2 seconds
R Server'Sir Ronald Aylmer Fisher' @ 193.190.124.24


Autocorrelation Function
Time lag kACF(k)T-STATP-value
1-0.280392-2.13540.018481
20.0822560.62640.266742
3-0.056434-0.42980.334472
40.1608631.22510.112745
5-0.117568-0.89540.187146
6-0.150167-1.14360.128736
70.144191.09810.138345
80.0873430.66520.254284
9-0.265103-2.0190.024061
100.1074280.81820.20831
110.0978050.74490.229683
120.0150840.11490.45447
13-0.148799-1.13320.130893
14-0.057763-0.43990.330819
150.2415881.83990.035453
16-0.15443-1.17610.122179
17-0.004959-0.03780.485002

\begin{tabular}{lllllllll}
\hline
Autocorrelation Function \tabularnewline
Time lag k & ACF(k) & T-STAT & P-value \tabularnewline
1 & -0.280392 & -2.1354 & 0.018481 \tabularnewline
2 & 0.082256 & 0.6264 & 0.266742 \tabularnewline
3 & -0.056434 & -0.4298 & 0.334472 \tabularnewline
4 & 0.160863 & 1.2251 & 0.112745 \tabularnewline
5 & -0.117568 & -0.8954 & 0.187146 \tabularnewline
6 & -0.150167 & -1.1436 & 0.128736 \tabularnewline
7 & 0.14419 & 1.0981 & 0.138345 \tabularnewline
8 & 0.087343 & 0.6652 & 0.254284 \tabularnewline
9 & -0.265103 & -2.019 & 0.024061 \tabularnewline
10 & 0.107428 & 0.8182 & 0.20831 \tabularnewline
11 & 0.097805 & 0.7449 & 0.229683 \tabularnewline
12 & 0.015084 & 0.1149 & 0.45447 \tabularnewline
13 & -0.148799 & -1.1332 & 0.130893 \tabularnewline
14 & -0.057763 & -0.4399 & 0.330819 \tabularnewline
15 & 0.241588 & 1.8399 & 0.035453 \tabularnewline
16 & -0.15443 & -1.1761 & 0.122179 \tabularnewline
17 & -0.004959 & -0.0378 & 0.485002 \tabularnewline
\hline
\end{tabular}
%Source: https://freestatistics.org/blog/index.php?pk=28564&T=1

[TABLE]
[ROW][C]Autocorrelation Function[/C][/ROW]
[ROW][C]Time lag k[/C][C]ACF(k)[/C][C]T-STAT[/C][C]P-value[/C][/ROW]
[ROW][C]1[/C][C]-0.280392[/C][C]-2.1354[/C][C]0.018481[/C][/ROW]
[ROW][C]2[/C][C]0.082256[/C][C]0.6264[/C][C]0.266742[/C][/ROW]
[ROW][C]3[/C][C]-0.056434[/C][C]-0.4298[/C][C]0.334472[/C][/ROW]
[ROW][C]4[/C][C]0.160863[/C][C]1.2251[/C][C]0.112745[/C][/ROW]
[ROW][C]5[/C][C]-0.117568[/C][C]-0.8954[/C][C]0.187146[/C][/ROW]
[ROW][C]6[/C][C]-0.150167[/C][C]-1.1436[/C][C]0.128736[/C][/ROW]
[ROW][C]7[/C][C]0.14419[/C][C]1.0981[/C][C]0.138345[/C][/ROW]
[ROW][C]8[/C][C]0.087343[/C][C]0.6652[/C][C]0.254284[/C][/ROW]
[ROW][C]9[/C][C]-0.265103[/C][C]-2.019[/C][C]0.024061[/C][/ROW]
[ROW][C]10[/C][C]0.107428[/C][C]0.8182[/C][C]0.20831[/C][/ROW]
[ROW][C]11[/C][C]0.097805[/C][C]0.7449[/C][C]0.229683[/C][/ROW]
[ROW][C]12[/C][C]0.015084[/C][C]0.1149[/C][C]0.45447[/C][/ROW]
[ROW][C]13[/C][C]-0.148799[/C][C]-1.1332[/C][C]0.130893[/C][/ROW]
[ROW][C]14[/C][C]-0.057763[/C][C]-0.4399[/C][C]0.330819[/C][/ROW]
[ROW][C]15[/C][C]0.241588[/C][C]1.8399[/C][C]0.035453[/C][/ROW]
[ROW][C]16[/C][C]-0.15443[/C][C]-1.1761[/C][C]0.122179[/C][/ROW]
[ROW][C]17[/C][C]-0.004959[/C][C]-0.0378[/C][C]0.485002[/C][/ROW]
[/TABLE]
Source: https://freestatistics.org/blog/index.php?pk=28564&T=1

Globally Unique Identifier (entire table): ba.freestatistics.org/blog/index.php?pk=28564&T=1

As an alternative you can also use a QR Code:  

The GUIDs for individual cells are displayed in the table below:

Autocorrelation Function
Time lag kACF(k)T-STATP-value
1-0.280392-2.13540.018481
20.0822560.62640.266742
3-0.056434-0.42980.334472
40.1608631.22510.112745
5-0.117568-0.89540.187146
6-0.150167-1.14360.128736
70.144191.09810.138345
80.0873430.66520.254284
9-0.265103-2.0190.024061
100.1074280.81820.20831
110.0978050.74490.229683
120.0150840.11490.45447
13-0.148799-1.13320.130893
14-0.057763-0.43990.330819
150.2415881.83990.035453
16-0.15443-1.17610.122179
17-0.004959-0.03780.485002


Partial Autocorrelation Function
Time lag kPACF(k)T-STATP-value
1-0.280392-2.13540.018481
20.0039460.03010.488063
3-0.035115-0.26740.395043
40.1475131.12340.132942
5-0.036564-0.27850.390822
6-0.224921-1.71290.046032
70.0669570.50990.306017
80.1624931.23750.110442
9-0.235585-1.79420.039
100.0180010.13710.445716
110.141091.07450.143523
12-0.001941-0.01480.494129
13-0.052245-0.39790.346087
14-0.169618-1.29180.10078
150.1201090.91470.182062
160.0636960.48510.31472
17-0.010143-0.07720.469348

\begin{tabular}{lllllllll}
\hline
Partial Autocorrelation Function \tabularnewline
Time lag k & PACF(k) & T-STAT & P-value \tabularnewline
1 & -0.280392 & -2.1354 & 0.018481 \tabularnewline
2 & 0.003946 & 0.0301 & 0.488063 \tabularnewline
3 & -0.035115 & -0.2674 & 0.395043 \tabularnewline
4 & 0.147513 & 1.1234 & 0.132942 \tabularnewline
5 & -0.036564 & -0.2785 & 0.390822 \tabularnewline
6 & -0.224921 & -1.7129 & 0.046032 \tabularnewline
7 & 0.066957 & 0.5099 & 0.306017 \tabularnewline
8 & 0.162493 & 1.2375 & 0.110442 \tabularnewline
9 & -0.235585 & -1.7942 & 0.039 \tabularnewline
10 & 0.018001 & 0.1371 & 0.445716 \tabularnewline
11 & 0.14109 & 1.0745 & 0.143523 \tabularnewline
12 & -0.001941 & -0.0148 & 0.494129 \tabularnewline
13 & -0.052245 & -0.3979 & 0.346087 \tabularnewline
14 & -0.169618 & -1.2918 & 0.10078 \tabularnewline
15 & 0.120109 & 0.9147 & 0.182062 \tabularnewline
16 & 0.063696 & 0.4851 & 0.31472 \tabularnewline
17 & -0.010143 & -0.0772 & 0.469348 \tabularnewline
\hline
\end{tabular}
%Source: https://freestatistics.org/blog/index.php?pk=28564&T=2

[TABLE]
[ROW][C]Partial Autocorrelation Function[/C][/ROW]
[ROW][C]Time lag k[/C][C]PACF(k)[/C][C]T-STAT[/C][C]P-value[/C][/ROW]
[ROW][C]1[/C][C]-0.280392[/C][C]-2.1354[/C][C]0.018481[/C][/ROW]
[ROW][C]2[/C][C]0.003946[/C][C]0.0301[/C][C]0.488063[/C][/ROW]
[ROW][C]3[/C][C]-0.035115[/C][C]-0.2674[/C][C]0.395043[/C][/ROW]
[ROW][C]4[/C][C]0.147513[/C][C]1.1234[/C][C]0.132942[/C][/ROW]
[ROW][C]5[/C][C]-0.036564[/C][C]-0.2785[/C][C]0.390822[/C][/ROW]
[ROW][C]6[/C][C]-0.224921[/C][C]-1.7129[/C][C]0.046032[/C][/ROW]
[ROW][C]7[/C][C]0.066957[/C][C]0.5099[/C][C]0.306017[/C][/ROW]
[ROW][C]8[/C][C]0.162493[/C][C]1.2375[/C][C]0.110442[/C][/ROW]
[ROW][C]9[/C][C]-0.235585[/C][C]-1.7942[/C][C]0.039[/C][/ROW]
[ROW][C]10[/C][C]0.018001[/C][C]0.1371[/C][C]0.445716[/C][/ROW]
[ROW][C]11[/C][C]0.14109[/C][C]1.0745[/C][C]0.143523[/C][/ROW]
[ROW][C]12[/C][C]-0.001941[/C][C]-0.0148[/C][C]0.494129[/C][/ROW]
[ROW][C]13[/C][C]-0.052245[/C][C]-0.3979[/C][C]0.346087[/C][/ROW]
[ROW][C]14[/C][C]-0.169618[/C][C]-1.2918[/C][C]0.10078[/C][/ROW]
[ROW][C]15[/C][C]0.120109[/C][C]0.9147[/C][C]0.182062[/C][/ROW]
[ROW][C]16[/C][C]0.063696[/C][C]0.4851[/C][C]0.31472[/C][/ROW]
[ROW][C]17[/C][C]-0.010143[/C][C]-0.0772[/C][C]0.469348[/C][/ROW]
[/TABLE]
Source: https://freestatistics.org/blog/index.php?pk=28564&T=2

Globally Unique Identifier (entire table): ba.freestatistics.org/blog/index.php?pk=28564&T=2

As an alternative you can also use a QR Code:  

The GUIDs for individual cells are displayed in the table below:

Partial Autocorrelation Function
Time lag kPACF(k)T-STATP-value
1-0.280392-2.13540.018481
20.0039460.03010.488063
3-0.035115-0.26740.395043
40.1475131.12340.132942
5-0.036564-0.27850.390822
6-0.224921-1.71290.046032
70.0669570.50990.306017
80.1624931.23750.110442
9-0.235585-1.79420.039
100.0180010.13710.445716
110.141091.07450.143523
12-0.001941-0.01480.494129
13-0.052245-0.39790.346087
14-0.169618-1.29180.10078
150.1201090.91470.182062
160.0636960.48510.31472
17-0.010143-0.07720.469348


Parameters (Session):
par1 = Default ; par2 = 1 ; par3 = 2 ; par4 = 0 ; par5 = 12 ;
Parameters (R input):
par1 = Default ; par2 = 1 ; par3 = 2 ; par4 = 0 ; par5 = 12 ;
R code (references can be found in the software module):
if (par1 == 'Default') {
par1 = 10*log10(length(x))
} else {
par1 <- as.numeric(par1)
}
par2 <- as.numeric(par2)
par3 <- as.numeric(par3)
par4 <- as.numeric(par4)
par5 <- as.numeric(par5)
if (par2 == 0) {
x <- log(x)
} else {
x <- (x ^ par2 - 1) / par2
}
if (par3 > 0) x <- diff(x,lag=1,difference=par3)
if (par4 > 0) x <- diff(x,lag=par5,difference=par4)
bitmap(file='pic1.png')
racf <- acf(x,par1,main='Autocorrelation',xlab='lags',ylab='ACF')
dev.off()
bitmap(file='pic2.png')
rpacf <- pacf(x,par1,main='Partial Autocorrelation',xlab='lags',ylab='PACF')
dev.off()
(myacf <- c(racf$acf))
(mypacf <- c(rpacf$acf))
lengthx <- length(x)
sqrtn <- sqrt(lengthx)
load(file='createtable')
a<-table.start()
a<-table.row.start(a)
a<-table.element(a,'Autocorrelation Function',4,TRUE)
a<-table.row.end(a)
a<-table.row.start(a)
a<-table.element(a,'Time lag k',header=TRUE)
a<-table.element(a,hyperlink('basics.htm','ACF(k)','click here for more information about the Autocorrelation Function'),header=TRUE)
a<-table.element(a,'T-STAT',header=TRUE)
a<-table.element(a,'P-value',header=TRUE)
a<-table.row.end(a)
for (i in 2:(par1+1)) {
a<-table.row.start(a)
a<-table.element(a,i-1,header=TRUE)
a<-table.element(a,round(myacf[i],6))
mytstat <- myacf[i]*sqrtn
a<-table.element(a,round(mytstat,4))
a<-table.element(a,round(1-pt(abs(mytstat),lengthx),6))
a<-table.row.end(a)
}
a<-table.end(a)
table.save(a,file='mytable.tab')
a<-table.start()
a<-table.row.start(a)
a<-table.element(a,'Partial Autocorrelation Function',4,TRUE)
a<-table.row.end(a)
a<-table.row.start(a)
a<-table.element(a,'Time lag k',header=TRUE)
a<-table.element(a,hyperlink('basics.htm','PACF(k)','click here for more information about the Partial Autocorrelation Function'),header=TRUE)
a<-table.element(a,'T-STAT',header=TRUE)
a<-table.element(a,'P-value',header=TRUE)
a<-table.row.end(a)
for (i in 1:par1) {
a<-table.row.start(a)
a<-table.element(a,i,header=TRUE)
a<-table.element(a,round(mypacf[i],6))
mytstat <- mypacf[i]*sqrtn
a<-table.element(a,round(mytstat,4))
a<-table.element(a,round(1-pt(abs(mytstat),lengthx),6))
a<-table.row.end(a)
}
a<-table.end(a)
table.save(a,file='mytable1.tab')