Free Statistics

of Irreproducible Research!

Author's title

Author*Unverified author*
R Software Modulerwasp_autocorrelation.wasp
Title produced by software(Partial) Autocorrelation Function
Date of computationWed, 03 Dec 2008 00:50:35 -0700
Cite this page as followsStatistical Computations at FreeStatistics.org, Office for Research Development and Education, URL https://freestatistics.org/blog/index.php?v=date/2008/Dec/03/t1228290669qnieyrfhxtkyd3l.htm/, Retrieved Fri, 17 May 2024 18:37:41 +0000
Statistical Computations at FreeStatistics.org, Office for Research Development and Education, URL https://freestatistics.org/blog/index.php?pk=28555, Retrieved Fri, 17 May 2024 18:37:41 +0000
QR Codes:

Original text written by user:
IsPrivate?No (this computation is public)
User-defined keywords
Estimated Impact251
Family? (F = Feedback message, R = changed R code, M = changed R Module, P = changed Parameters, D = changed Data)
F       [(Partial) Autocorrelation Function] [] [2008-12-03 07:50:35] [e02910eed3830f1815f587e12f46cbdb] [Current]
- RMP     [Standard Deviation-Mean Plot] [] [2008-12-06 11:15:17] [996314793dac993597edc1ca2281ff39]
-   P     [(Partial) Autocorrelation Function] [] [2008-12-06 11:22:40] [996314793dac993597edc1ca2281ff39]
-   P     [(Partial) Autocorrelation Function] [] [2008-12-06 11:30:49] [996314793dac993597edc1ca2281ff39]
Feedback Forum
2008-12-06 11:34:41 [Angelique Van de Vijver] [reply
Student heeft foute berekening gemaakt.
Daarom heb ik de berekening opnieuw gemaakt: http://www.freestatistics.org/blog/date/2008/Dec/06/t1228563097giswiravuu78jpy.htm
met number of time lags= 36(student had hier default); lambda = -1.0 (student had hier 1)en d=2 (ik heb zowel een berekning gemaakt met d=1 en d=2 en hier is de ACF met d=2 beter vind ik )D=0 ;seasonality =12.
De student heeft de verkeerd lambda-waarde gebruikt(nl.1)
Ik heb de standard deviation plot gemaakt:
http://www.freestatistics.org/blog/date/2008/Dec/06/t1228562355iuyo1k5avl81adu.htm
Hier zien we dat de lambda-waarde gelijk moet zijn aan -0.96, dus heb ik in mijn berekening -1.0 als lambda waarde genomen.
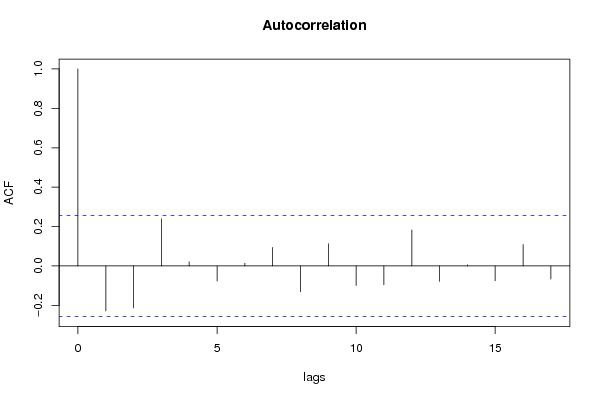
Op de ACF zien we dan dat de langetermijntrend verdwenen is, er is geen langzaam dalend verloop meer.
We moesten hier niet seizoenaal differntiëren omdat er hier geen sprake was van seizoenaliteit.

Post a new message
Dataseries X:
118.4
121.4
128.8
131.7
141.7
142.9
139.4
134.7
125.0
113.6
111.5
108.5
112.3
116.6
115.5
120.1
132.9
128.1
129.3
132.5
131.0
124.9
120.8
122.0
122.1
127.4
135.2
137.3
135.0
136.0
138.4
134.7
138.4
133.9
133.6
141.2
151.8
155.4
156.6
161.6
160.7
156.0
159.5
168.7
169.9
169.9
185.9
190.8
195.8
211.9
227.1
251.3
256.7
251.9
251.2
270.3
267.2
243.0
229.9
187.2


Summary of computational transaction
Raw Inputview raw input (R code)
Raw Outputview raw output of R engine
Computing time1 seconds
R Server'George Udny Yule' @ 72.249.76.132

\begin{tabular}{lllllllll}
\hline
Summary of computational transaction \tabularnewline
Raw Input & view raw input (R code)  \tabularnewline
Raw Output & view raw output of R engine  \tabularnewline
Computing time & 1 seconds \tabularnewline
R Server & 'George Udny Yule' @ 72.249.76.132 \tabularnewline
\hline
\end{tabular}
%Source: https://freestatistics.org/blog/index.php?pk=28555&T=0

[TABLE]
[ROW][C]Summary of computational transaction[/C][/ROW]
[ROW][C]Raw Input[/C][C]view raw input (R code) [/C][/ROW]
[ROW][C]Raw Output[/C][C]view raw output of R engine [/C][/ROW]
[ROW][C]Computing time[/C][C]1 seconds[/C][/ROW]
[ROW][C]R Server[/C][C]'George Udny Yule' @ 72.249.76.132[/C][/ROW]
[/TABLE]
Source: https://freestatistics.org/blog/index.php?pk=28555&T=0

Globally Unique Identifier (entire table): ba.freestatistics.org/blog/index.php?pk=28555&T=0

As an alternative you can also use a QR Code:  

The GUIDs for individual cells are displayed in the table below:

Summary of computational transaction
Raw Inputview raw input (R code)
Raw Outputview raw output of R engine
Computing time1 seconds
R Server'George Udny Yule' @ 72.249.76.132


Autocorrelation Function
Time lag kACF(k)T-STATP-value
1-0.228562-1.74070.043522
2-0.213432-1.62550.054744
30.2392811.82230.036783
40.0207460.1580.437505
5-0.076574-0.58320.281018
60.0143110.1090.456794
70.0938240.71450.23888
8-0.1315-1.00150.16038
90.1126450.85790.197245
10-0.09868-0.75150.227687
11-0.095612-0.72820.234724
120.1825791.39050.084847
13-0.078194-0.59550.27691
140.0060050.04570.48184
15-0.075301-0.57350.284269
160.1085370.82660.205927
17-0.06654-0.50680.307125

\begin{tabular}{lllllllll}
\hline
Autocorrelation Function \tabularnewline
Time lag k & ACF(k) & T-STAT & P-value \tabularnewline
1 & -0.228562 & -1.7407 & 0.043522 \tabularnewline
2 & -0.213432 & -1.6255 & 0.054744 \tabularnewline
3 & 0.239281 & 1.8223 & 0.036783 \tabularnewline
4 & 0.020746 & 0.158 & 0.437505 \tabularnewline
5 & -0.076574 & -0.5832 & 0.281018 \tabularnewline
6 & 0.014311 & 0.109 & 0.456794 \tabularnewline
7 & 0.093824 & 0.7145 & 0.23888 \tabularnewline
8 & -0.1315 & -1.0015 & 0.16038 \tabularnewline
9 & 0.112645 & 0.8579 & 0.197245 \tabularnewline
10 & -0.09868 & -0.7515 & 0.227687 \tabularnewline
11 & -0.095612 & -0.7282 & 0.234724 \tabularnewline
12 & 0.182579 & 1.3905 & 0.084847 \tabularnewline
13 & -0.078194 & -0.5955 & 0.27691 \tabularnewline
14 & 0.006005 & 0.0457 & 0.48184 \tabularnewline
15 & -0.075301 & -0.5735 & 0.284269 \tabularnewline
16 & 0.108537 & 0.8266 & 0.205927 \tabularnewline
17 & -0.06654 & -0.5068 & 0.307125 \tabularnewline
\hline
\end{tabular}
%Source: https://freestatistics.org/blog/index.php?pk=28555&T=1

[TABLE]
[ROW][C]Autocorrelation Function[/C][/ROW]
[ROW][C]Time lag k[/C][C]ACF(k)[/C][C]T-STAT[/C][C]P-value[/C][/ROW]
[ROW][C]1[/C][C]-0.228562[/C][C]-1.7407[/C][C]0.043522[/C][/ROW]
[ROW][C]2[/C][C]-0.213432[/C][C]-1.6255[/C][C]0.054744[/C][/ROW]
[ROW][C]3[/C][C]0.239281[/C][C]1.8223[/C][C]0.036783[/C][/ROW]
[ROW][C]4[/C][C]0.020746[/C][C]0.158[/C][C]0.437505[/C][/ROW]
[ROW][C]5[/C][C]-0.076574[/C][C]-0.5832[/C][C]0.281018[/C][/ROW]
[ROW][C]6[/C][C]0.014311[/C][C]0.109[/C][C]0.456794[/C][/ROW]
[ROW][C]7[/C][C]0.093824[/C][C]0.7145[/C][C]0.23888[/C][/ROW]
[ROW][C]8[/C][C]-0.1315[/C][C]-1.0015[/C][C]0.16038[/C][/ROW]
[ROW][C]9[/C][C]0.112645[/C][C]0.8579[/C][C]0.197245[/C][/ROW]
[ROW][C]10[/C][C]-0.09868[/C][C]-0.7515[/C][C]0.227687[/C][/ROW]
[ROW][C]11[/C][C]-0.095612[/C][C]-0.7282[/C][C]0.234724[/C][/ROW]
[ROW][C]12[/C][C]0.182579[/C][C]1.3905[/C][C]0.084847[/C][/ROW]
[ROW][C]13[/C][C]-0.078194[/C][C]-0.5955[/C][C]0.27691[/C][/ROW]
[ROW][C]14[/C][C]0.006005[/C][C]0.0457[/C][C]0.48184[/C][/ROW]
[ROW][C]15[/C][C]-0.075301[/C][C]-0.5735[/C][C]0.284269[/C][/ROW]
[ROW][C]16[/C][C]0.108537[/C][C]0.8266[/C][C]0.205927[/C][/ROW]
[ROW][C]17[/C][C]-0.06654[/C][C]-0.5068[/C][C]0.307125[/C][/ROW]
[/TABLE]
Source: https://freestatistics.org/blog/index.php?pk=28555&T=1

Globally Unique Identifier (entire table): ba.freestatistics.org/blog/index.php?pk=28555&T=1

As an alternative you can also use a QR Code:  

The GUIDs for individual cells are displayed in the table below:

Autocorrelation Function
Time lag kACF(k)T-STATP-value
1-0.228562-1.74070.043522
2-0.213432-1.62550.054744
30.2392811.82230.036783
40.0207460.1580.437505
5-0.076574-0.58320.281018
60.0143110.1090.456794
70.0938240.71450.23888
8-0.1315-1.00150.16038
90.1126450.85790.197245
10-0.09868-0.75150.227687
11-0.095612-0.72820.234724
120.1825791.39050.084847
13-0.078194-0.59550.27691
140.0060050.04570.48184
15-0.075301-0.57350.284269
160.1085370.82660.205927
17-0.06654-0.50680.307125


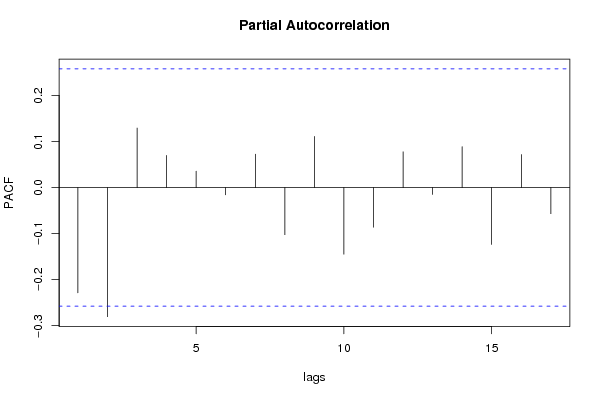
Partial Autocorrelation Function
Time lag kPACF(k)T-STATP-value
1-0.228562-1.74070.043522
2-0.280317-2.13480.018506
30.1291140.98330.164771
40.0696990.53080.298788
50.0353670.26930.394308
6-0.015855-0.12080.452153
70.0723960.55140.291754
8-0.10253-0.78080.219034
90.1109970.84530.200701
10-0.144708-1.10210.137493
11-0.086182-0.65630.2571
120.0776160.59110.278374
13-0.014998-0.11420.454729
140.0886660.67530.251096
15-0.123678-0.94190.175074
160.071410.54380.294316
17-0.056728-0.4320.33366

\begin{tabular}{lllllllll}
\hline
Partial Autocorrelation Function \tabularnewline
Time lag k & PACF(k) & T-STAT & P-value \tabularnewline
1 & -0.228562 & -1.7407 & 0.043522 \tabularnewline
2 & -0.280317 & -2.1348 & 0.018506 \tabularnewline
3 & 0.129114 & 0.9833 & 0.164771 \tabularnewline
4 & 0.069699 & 0.5308 & 0.298788 \tabularnewline
5 & 0.035367 & 0.2693 & 0.394308 \tabularnewline
6 & -0.015855 & -0.1208 & 0.452153 \tabularnewline
7 & 0.072396 & 0.5514 & 0.291754 \tabularnewline
8 & -0.10253 & -0.7808 & 0.219034 \tabularnewline
9 & 0.110997 & 0.8453 & 0.200701 \tabularnewline
10 & -0.144708 & -1.1021 & 0.137493 \tabularnewline
11 & -0.086182 & -0.6563 & 0.2571 \tabularnewline
12 & 0.077616 & 0.5911 & 0.278374 \tabularnewline
13 & -0.014998 & -0.1142 & 0.454729 \tabularnewline
14 & 0.088666 & 0.6753 & 0.251096 \tabularnewline
15 & -0.123678 & -0.9419 & 0.175074 \tabularnewline
16 & 0.07141 & 0.5438 & 0.294316 \tabularnewline
17 & -0.056728 & -0.432 & 0.33366 \tabularnewline
\hline
\end{tabular}
%Source: https://freestatistics.org/blog/index.php?pk=28555&T=2

[TABLE]
[ROW][C]Partial Autocorrelation Function[/C][/ROW]
[ROW][C]Time lag k[/C][C]PACF(k)[/C][C]T-STAT[/C][C]P-value[/C][/ROW]
[ROW][C]1[/C][C]-0.228562[/C][C]-1.7407[/C][C]0.043522[/C][/ROW]
[ROW][C]2[/C][C]-0.280317[/C][C]-2.1348[/C][C]0.018506[/C][/ROW]
[ROW][C]3[/C][C]0.129114[/C][C]0.9833[/C][C]0.164771[/C][/ROW]
[ROW][C]4[/C][C]0.069699[/C][C]0.5308[/C][C]0.298788[/C][/ROW]
[ROW][C]5[/C][C]0.035367[/C][C]0.2693[/C][C]0.394308[/C][/ROW]
[ROW][C]6[/C][C]-0.015855[/C][C]-0.1208[/C][C]0.452153[/C][/ROW]
[ROW][C]7[/C][C]0.072396[/C][C]0.5514[/C][C]0.291754[/C][/ROW]
[ROW][C]8[/C][C]-0.10253[/C][C]-0.7808[/C][C]0.219034[/C][/ROW]
[ROW][C]9[/C][C]0.110997[/C][C]0.8453[/C][C]0.200701[/C][/ROW]
[ROW][C]10[/C][C]-0.144708[/C][C]-1.1021[/C][C]0.137493[/C][/ROW]
[ROW][C]11[/C][C]-0.086182[/C][C]-0.6563[/C][C]0.2571[/C][/ROW]
[ROW][C]12[/C][C]0.077616[/C][C]0.5911[/C][C]0.278374[/C][/ROW]
[ROW][C]13[/C][C]-0.014998[/C][C]-0.1142[/C][C]0.454729[/C][/ROW]
[ROW][C]14[/C][C]0.088666[/C][C]0.6753[/C][C]0.251096[/C][/ROW]
[ROW][C]15[/C][C]-0.123678[/C][C]-0.9419[/C][C]0.175074[/C][/ROW]
[ROW][C]16[/C][C]0.07141[/C][C]0.5438[/C][C]0.294316[/C][/ROW]
[ROW][C]17[/C][C]-0.056728[/C][C]-0.432[/C][C]0.33366[/C][/ROW]
[/TABLE]
Source: https://freestatistics.org/blog/index.php?pk=28555&T=2

Globally Unique Identifier (entire table): ba.freestatistics.org/blog/index.php?pk=28555&T=2

As an alternative you can also use a QR Code:  

The GUIDs for individual cells are displayed in the table below:

Partial Autocorrelation Function
Time lag kPACF(k)T-STATP-value
1-0.228562-1.74070.043522
2-0.280317-2.13480.018506
30.1291140.98330.164771
40.0696990.53080.298788
50.0353670.26930.394308
6-0.015855-0.12080.452153
70.0723960.55140.291754
8-0.10253-0.78080.219034
90.1109970.84530.200701
10-0.144708-1.10210.137493
11-0.086182-0.65630.2571
120.0776160.59110.278374
13-0.014998-0.11420.454729
140.0886660.67530.251096
15-0.123678-0.94190.175074
160.071410.54380.294316
17-0.056728-0.4320.33366


Parameters (Session):
par1 = Default ; par2 = 1 ; par3 = 2 ; par4 = 0 ; par5 = 12 ;
Parameters (R input):
par1 = Default ; par2 = 1 ; par3 = 2 ; par4 = 0 ; par5 = 12 ;
R code (references can be found in the software module):
if (par1 == 'Default') {
par1 = 10*log10(length(x))
} else {
par1 <- as.numeric(par1)
}
par2 <- as.numeric(par2)
par3 <- as.numeric(par3)
par4 <- as.numeric(par4)
par5 <- as.numeric(par5)
if (par2 == 0) {
x <- log(x)
} else {
x <- (x ^ par2 - 1) / par2
}
if (par3 > 0) x <- diff(x,lag=1,difference=par3)
if (par4 > 0) x <- diff(x,lag=par5,difference=par4)
bitmap(file='pic1.png')
racf <- acf(x,par1,main='Autocorrelation',xlab='lags',ylab='ACF')
dev.off()
bitmap(file='pic2.png')
rpacf <- pacf(x,par1,main='Partial Autocorrelation',xlab='lags',ylab='PACF')
dev.off()
(myacf <- c(racf$acf))
(mypacf <- c(rpacf$acf))
lengthx <- length(x)
sqrtn <- sqrt(lengthx)
load(file='createtable')
a<-table.start()
a<-table.row.start(a)
a<-table.element(a,'Autocorrelation Function',4,TRUE)
a<-table.row.end(a)
a<-table.row.start(a)
a<-table.element(a,'Time lag k',header=TRUE)
a<-table.element(a,hyperlink('basics.htm','ACF(k)','click here for more information about the Autocorrelation Function'),header=TRUE)
a<-table.element(a,'T-STAT',header=TRUE)
a<-table.element(a,'P-value',header=TRUE)
a<-table.row.end(a)
for (i in 2:(par1+1)) {
a<-table.row.start(a)
a<-table.element(a,i-1,header=TRUE)
a<-table.element(a,round(myacf[i],6))
mytstat <- myacf[i]*sqrtn
a<-table.element(a,round(mytstat,4))
a<-table.element(a,round(1-pt(abs(mytstat),lengthx),6))
a<-table.row.end(a)
}
a<-table.end(a)
table.save(a,file='mytable.tab')
a<-table.start()
a<-table.row.start(a)
a<-table.element(a,'Partial Autocorrelation Function',4,TRUE)
a<-table.row.end(a)
a<-table.row.start(a)
a<-table.element(a,'Time lag k',header=TRUE)
a<-table.element(a,hyperlink('basics.htm','PACF(k)','click here for more information about the Partial Autocorrelation Function'),header=TRUE)
a<-table.element(a,'T-STAT',header=TRUE)
a<-table.element(a,'P-value',header=TRUE)
a<-table.row.end(a)
for (i in 1:par1) {
a<-table.row.start(a)
a<-table.element(a,i,header=TRUE)
a<-table.element(a,round(mypacf[i],6))
mytstat <- mypacf[i]*sqrtn
a<-table.element(a,round(mytstat,4))
a<-table.element(a,round(1-pt(abs(mytstat),lengthx),6))
a<-table.row.end(a)
}
a<-table.end(a)
table.save(a,file='mytable1.tab')