Free Statistics

of Irreproducible Research!

Author's title

Author*Unverified author*
R Software Modulerwasp_cross.wasp
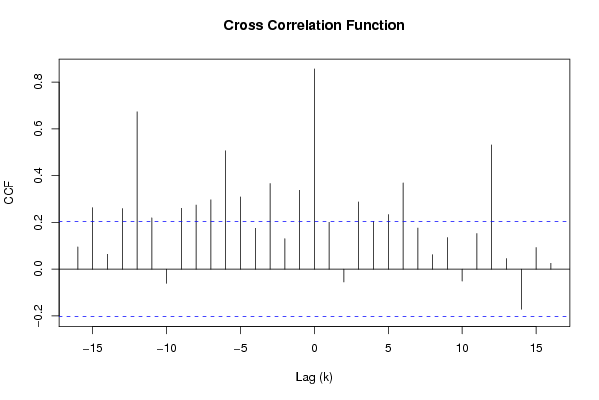
Title produced by softwareCross Correlation Function
Date of computationTue, 02 Dec 2008 16:55:34 -0700
Cite this page as followsStatistical Computations at FreeStatistics.org, Office for Research Development and Education, URL https://freestatistics.org/blog/index.php?v=date/2008/Dec/03/t1228262165pd94ebwpelk35as.htm/, Retrieved Fri, 17 May 2024 15:01:31 +0000
Statistical Computations at FreeStatistics.org, Office for Research Development and Education, URL https://freestatistics.org/blog/index.php?pk=28540, Retrieved Fri, 17 May 2024 15:01:31 +0000
QR Codes:

Original text written by user:
IsPrivate?No (this computation is public)
User-defined keywords
Estimated Impact216
Family? (F = Feedback message, R = changed R code, M = changed R Module, P = changed Parameters, D = changed Data)
F       [Cross Correlation Function] [Gilliam Schoorel] [2008-12-02 23:55:34] [4a7b7ae341cb1fe8993cedd56bcfa583] [Current]
Feedback Forum
2008-12-07 11:56:28 [006ad2c49b6a7c2ad6ab685cfc1dae56] [reply
Je had ook nog de tabel kunnen toevoegen. Daarin zien we de cijfers die grafsch worden voorgesteld. In de 2de kolom is de correlatie weergegeven, verschoven in de tijd. Boven k=0 staan de waarden die het verleden van x weergeven, zogenaamde leading indicators. Onder k=0 staan de toekomstige waarden van x gecorreleerd met y of anders gezegd het verleden van y gecorreleerd met het heden van x. Op de grafiek kunnen we zien dat de waarden links van 0 het verleden van x weergeven, deze gebruiken we om y te voorspellen. De waarden rechts van 0 geven de toekomstige waarden van x weer.

Post a new message
Dataseries X:
101.4
100.7
111.7
96.9
101.9
107.2
86.7
92.7
101.4
107.1
100.8
91
96.3
96.7
106.7
104.8
103
105.7
92.4
91
107.7
112
102.1
94.8
99.4
98.7
106.2
103.9
99.5
105.3
93.9
88.3
109.3
112.1
100.3
101.5
96.5
98.8
115.9
106.5
100.7
114.6
97.2
96.8
117.2
112.6
107
106.6
98.9
98.8
110.3
104.4
100.7
117.7
89.1
94.9
112.4
104.9
109.3
104.3
102.3
103.2
118.8
102.6
112.2
116.6
93.6
100
116.4
118.9
114.5
106.2
109.8
107.3
121.9
108.8
111.8
119.8
102.5
103.4
114.4
124.1
115.6
105.2
114.1
115.3
115.8
119.9
112.1
119.7
106.2
101.5
119.3
Dataseries Y:
119.5
125
145
105.3
116.9
120.1
88.9
78.4
114.6
113.3
117
99.6
99.4
101.9
115.2
108.5
113.8
121
92.2
90.2
101.5
126.6
93.9
89.8
93.4
101.5
110.4
105.9
108.4
113.9
86.1
69.4
101.2
100.5
98
106.6
90.1
96.9
125.9
112
100
123.9
79.8
83.4
113.6
112.9
104
109.9
99
106.3
128.9
111.1
102.9
130
87
87.5
117.6
103.4
110.8
112.6
102.5
112.4
135.6
105.1
127.7
137
91
90.5
122.4
123.3
124.3
120
118.1
119
142.7
123.6
129.6
151.6
110.4
99.2
130.5
136.2
129.7
128
121.6
135.8
143.8
147.5
136.2
156.6
123.3
104.5
143.6


Summary of computational transaction
Raw Inputview raw input (R code)
Raw Outputview raw output of R engine
Computing time2 seconds
R Server'Herman Ole Andreas Wold' @ 193.190.124.10:1001

\begin{tabular}{lllllllll}
\hline
Summary of computational transaction \tabularnewline
Raw Input & view raw input (R code)  \tabularnewline
Raw Output & view raw output of R engine  \tabularnewline
Computing time & 2 seconds \tabularnewline
R Server & 'Herman Ole Andreas Wold' @ 193.190.124.10:1001 \tabularnewline
\hline
\end{tabular}
%Source: https://freestatistics.org/blog/index.php?pk=28540&T=0

[TABLE]
[ROW][C]Summary of computational transaction[/C][/ROW]
[ROW][C]Raw Input[/C][C]view raw input (R code) [/C][/ROW]
[ROW][C]Raw Output[/C][C]view raw output of R engine [/C][/ROW]
[ROW][C]Computing time[/C][C]2 seconds[/C][/ROW]
[ROW][C]R Server[/C][C]'Herman Ole Andreas Wold' @ 193.190.124.10:1001[/C][/ROW]
[/TABLE]
Source: https://freestatistics.org/blog/index.php?pk=28540&T=0

Globally Unique Identifier (entire table): ba.freestatistics.org/blog/index.php?pk=28540&T=0

As an alternative you can also use a QR Code:  

The GUIDs for individual cells are displayed in the table below:

Summary of computational transaction
Raw Inputview raw input (R code)
Raw Outputview raw output of R engine
Computing time2 seconds
R Server'Herman Ole Andreas Wold' @ 193.190.124.10:1001


Cross Correlation Function
ParameterValue
Box-Cox transformation parameter (lambda) of X series1
Degree of non-seasonal differencing (d) of X series0
Degree of seasonal differencing (D) of X series0
Seasonal Period (s)12
Box-Cox transformation parameter (lambda) of Y series1
Degree of non-seasonal differencing (d) of Y series0
Degree of seasonal differencing (D) of Y series0
krho(Y[t],X[t+k])
-160.0949493573225683
-150.262795009850208
-140.0635453940715749
-130.259402402172198
-120.673017809838268
-110.219375883328129
-10-0.0605953218236244
-90.260408701547895
-80.273966935183089
-70.296422297280555
-60.506500325759265
-50.309060424800886
-40.174885363271443
-30.366081869436164
-20.130255491789208
-10.337116744701247
00.856485227327449
10.200368654935246
2-0.0545093758166253
30.287313753320569
40.204609916576248
50.233766217267528
60.368768639119318
70.175564414453324
80.0621021811843758
90.135216867561437
10-0.0511352028949913
110.152435117208367
120.531460668786499
130.0454251973722285
14-0.171168984716635
150.0921671780023091
160.0249480754822844

\begin{tabular}{lllllllll}
\hline
Cross Correlation Function \tabularnewline
Parameter & Value \tabularnewline
Box-Cox transformation parameter (lambda) of X series & 1 \tabularnewline
Degree of non-seasonal differencing (d) of X series & 0 \tabularnewline
Degree of seasonal differencing (D) of X series & 0 \tabularnewline
Seasonal Period (s) & 12 \tabularnewline
Box-Cox transformation parameter (lambda) of Y series & 1 \tabularnewline
Degree of non-seasonal differencing (d) of Y series & 0 \tabularnewline
Degree of seasonal differencing (D) of Y series & 0 \tabularnewline
k & rho(Y[t],X[t+k]) \tabularnewline
-16 & 0.0949493573225683 \tabularnewline
-15 & 0.262795009850208 \tabularnewline
-14 & 0.0635453940715749 \tabularnewline
-13 & 0.259402402172198 \tabularnewline
-12 & 0.673017809838268 \tabularnewline
-11 & 0.219375883328129 \tabularnewline
-10 & -0.0605953218236244 \tabularnewline
-9 & 0.260408701547895 \tabularnewline
-8 & 0.273966935183089 \tabularnewline
-7 & 0.296422297280555 \tabularnewline
-6 & 0.506500325759265 \tabularnewline
-5 & 0.309060424800886 \tabularnewline
-4 & 0.174885363271443 \tabularnewline
-3 & 0.366081869436164 \tabularnewline
-2 & 0.130255491789208 \tabularnewline
-1 & 0.337116744701247 \tabularnewline
0 & 0.856485227327449 \tabularnewline
1 & 0.200368654935246 \tabularnewline
2 & -0.0545093758166253 \tabularnewline
3 & 0.287313753320569 \tabularnewline
4 & 0.204609916576248 \tabularnewline
5 & 0.233766217267528 \tabularnewline
6 & 0.368768639119318 \tabularnewline
7 & 0.175564414453324 \tabularnewline
8 & 0.0621021811843758 \tabularnewline
9 & 0.135216867561437 \tabularnewline
10 & -0.0511352028949913 \tabularnewline
11 & 0.152435117208367 \tabularnewline
12 & 0.531460668786499 \tabularnewline
13 & 0.0454251973722285 \tabularnewline
14 & -0.171168984716635 \tabularnewline
15 & 0.0921671780023091 \tabularnewline
16 & 0.0249480754822844 \tabularnewline
\hline
\end{tabular}
%Source: https://freestatistics.org/blog/index.php?pk=28540&T=1

[TABLE]
[ROW][C]Cross Correlation Function[/C][/ROW]
[ROW][C]Parameter[/C][C]Value[/C][/ROW]
[ROW][C]Box-Cox transformation parameter (lambda) of X series[/C][C]1[/C][/ROW]
[ROW][C]Degree of non-seasonal differencing (d) of X series[/C][C]0[/C][/ROW]
[ROW][C]Degree of seasonal differencing (D) of X series[/C][C]0[/C][/ROW]
[ROW][C]Seasonal Period (s)[/C][C]12[/C][/ROW]
[ROW][C]Box-Cox transformation parameter (lambda) of Y series[/C][C]1[/C][/ROW]
[ROW][C]Degree of non-seasonal differencing (d) of Y series[/C][C]0[/C][/ROW]
[ROW][C]Degree of seasonal differencing (D) of Y series[/C][C]0[/C][/ROW]
[ROW][C]k[/C][C]rho(Y[t],X[t+k])[/C][/ROW]
[ROW][C]-16[/C][C]0.0949493573225683[/C][/ROW]
[ROW][C]-15[/C][C]0.262795009850208[/C][/ROW]
[ROW][C]-14[/C][C]0.0635453940715749[/C][/ROW]
[ROW][C]-13[/C][C]0.259402402172198[/C][/ROW]
[ROW][C]-12[/C][C]0.673017809838268[/C][/ROW]
[ROW][C]-11[/C][C]0.219375883328129[/C][/ROW]
[ROW][C]-10[/C][C]-0.0605953218236244[/C][/ROW]
[ROW][C]-9[/C][C]0.260408701547895[/C][/ROW]
[ROW][C]-8[/C][C]0.273966935183089[/C][/ROW]
[ROW][C]-7[/C][C]0.296422297280555[/C][/ROW]
[ROW][C]-6[/C][C]0.506500325759265[/C][/ROW]
[ROW][C]-5[/C][C]0.309060424800886[/C][/ROW]
[ROW][C]-4[/C][C]0.174885363271443[/C][/ROW]
[ROW][C]-3[/C][C]0.366081869436164[/C][/ROW]
[ROW][C]-2[/C][C]0.130255491789208[/C][/ROW]
[ROW][C]-1[/C][C]0.337116744701247[/C][/ROW]
[ROW][C]0[/C][C]0.856485227327449[/C][/ROW]
[ROW][C]1[/C][C]0.200368654935246[/C][/ROW]
[ROW][C]2[/C][C]-0.0545093758166253[/C][/ROW]
[ROW][C]3[/C][C]0.287313753320569[/C][/ROW]
[ROW][C]4[/C][C]0.204609916576248[/C][/ROW]
[ROW][C]5[/C][C]0.233766217267528[/C][/ROW]
[ROW][C]6[/C][C]0.368768639119318[/C][/ROW]
[ROW][C]7[/C][C]0.175564414453324[/C][/ROW]
[ROW][C]8[/C][C]0.0621021811843758[/C][/ROW]
[ROW][C]9[/C][C]0.135216867561437[/C][/ROW]
[ROW][C]10[/C][C]-0.0511352028949913[/C][/ROW]
[ROW][C]11[/C][C]0.152435117208367[/C][/ROW]
[ROW][C]12[/C][C]0.531460668786499[/C][/ROW]
[ROW][C]13[/C][C]0.0454251973722285[/C][/ROW]
[ROW][C]14[/C][C]-0.171168984716635[/C][/ROW]
[ROW][C]15[/C][C]0.0921671780023091[/C][/ROW]
[ROW][C]16[/C][C]0.0249480754822844[/C][/ROW]
[/TABLE]
Source: https://freestatistics.org/blog/index.php?pk=28540&T=1

Globally Unique Identifier (entire table): ba.freestatistics.org/blog/index.php?pk=28540&T=1

As an alternative you can also use a QR Code:  

The GUIDs for individual cells are displayed in the table below:

Cross Correlation Function
ParameterValue
Box-Cox transformation parameter (lambda) of X series1
Degree of non-seasonal differencing (d) of X series0
Degree of seasonal differencing (D) of X series0
Seasonal Period (s)12
Box-Cox transformation parameter (lambda) of Y series1
Degree of non-seasonal differencing (d) of Y series0
Degree of seasonal differencing (D) of Y series0
krho(Y[t],X[t+k])
-160.0949493573225683
-150.262795009850208
-140.0635453940715749
-130.259402402172198
-120.673017809838268
-110.219375883328129
-10-0.0605953218236244
-90.260408701547895
-80.273966935183089
-70.296422297280555
-60.506500325759265
-50.309060424800886
-40.174885363271443
-30.366081869436164
-20.130255491789208
-10.337116744701247
00.856485227327449
10.200368654935246
2-0.0545093758166253
30.287313753320569
40.204609916576248
50.233766217267528
60.368768639119318
70.175564414453324
80.0621021811843758
90.135216867561437
10-0.0511352028949913
110.152435117208367
120.531460668786499
130.0454251973722285
14-0.171168984716635
150.0921671780023091
160.0249480754822844


Parameters (Session):
par1 = 1 ;
Parameters (R input):
par1 = 1 ; par2 = 0 ; par3 = 0 ; par4 = 12 ; par5 = 1 ; par6 = 0 ; par7 = 0 ;
R code (references can be found in the software module):
par1 <- as.numeric(par1)
par2 <- as.numeric(par2)
par3 <- as.numeric(par3)
par4 <- as.numeric(par4)
par5 <- as.numeric(par5)
par6 <- as.numeric(par6)
par7 <- as.numeric(par7)
if (par1 == 0) {
x <- log(x)
} else {
x <- (x ^ par1 - 1) / par1
}
if (par5 == 0) {
y <- log(y)
} else {
y <- (y ^ par5 - 1) / par5
}
if (par2 > 0) x <- diff(x,lag=1,difference=par2)
if (par6 > 0) y <- diff(y,lag=1,difference=par6)
if (par3 > 0) x <- diff(x,lag=par4,difference=par3)
if (par7 > 0) y <- diff(y,lag=par4,difference=par7)
x
y
bitmap(file='test1.png')
(r <- ccf(x,y,main='Cross Correlation Function',ylab='CCF',xlab='Lag (k)'))
dev.off()
load(file='createtable')
a<-table.start()
a<-table.row.start(a)
a<-table.element(a,'Cross Correlation Function',2,TRUE)
a<-table.row.end(a)
a<-table.row.start(a)
a<-table.element(a,'Parameter',header=TRUE)
a<-table.element(a,'Value',header=TRUE)
a<-table.row.end(a)
a<-table.row.start(a)
a<-table.element(a,'Box-Cox transformation parameter (lambda) of X series',header=TRUE)
a<-table.element(a,par1)
a<-table.row.end(a)
a<-table.row.start(a)
a<-table.element(a,'Degree of non-seasonal differencing (d) of X series',header=TRUE)
a<-table.element(a,par2)
a<-table.row.end(a)
a<-table.row.start(a)
a<-table.element(a,'Degree of seasonal differencing (D) of X series',header=TRUE)
a<-table.element(a,par3)
a<-table.row.end(a)
a<-table.row.start(a)
a<-table.element(a,'Seasonal Period (s)',header=TRUE)
a<-table.element(a,par4)
a<-table.row.end(a)
a<-table.row.start(a)
a<-table.element(a,'Box-Cox transformation parameter (lambda) of Y series',header=TRUE)
a<-table.element(a,par5)
a<-table.row.end(a)
a<-table.row.start(a)
a<-table.element(a,'Degree of non-seasonal differencing (d) of Y series',header=TRUE)
a<-table.element(a,par6)
a<-table.row.end(a)
a<-table.row.start(a)
a<-table.element(a,'Degree of seasonal differencing (D) of Y series',header=TRUE)
a<-table.element(a,par7)
a<-table.row.end(a)
a<-table.row.start(a)
a<-table.element(a,'k',header=TRUE)
a<-table.element(a,'rho(Y[t],X[t+k])',header=TRUE)
a<-table.row.end(a)
mylength <- length(r$acf)
myhalf <- floor((mylength-1)/2)
for (i in 1:mylength) {
a<-table.row.start(a)
a<-table.element(a,i-myhalf-1,header=TRUE)
a<-table.element(a,r$acf[i])
a<-table.row.end(a)
}
a<-table.end(a)
table.save(a,file='mytable.tab')