Free Statistics

of Irreproducible Research!

Author's title

Author*The author of this computation has been verified*
R Software Modulerwasp_autocorrelation.wasp
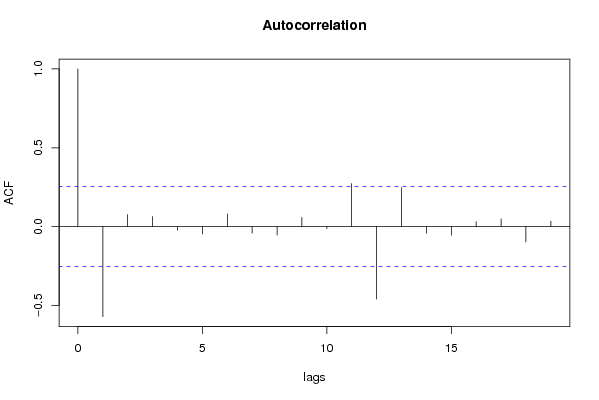
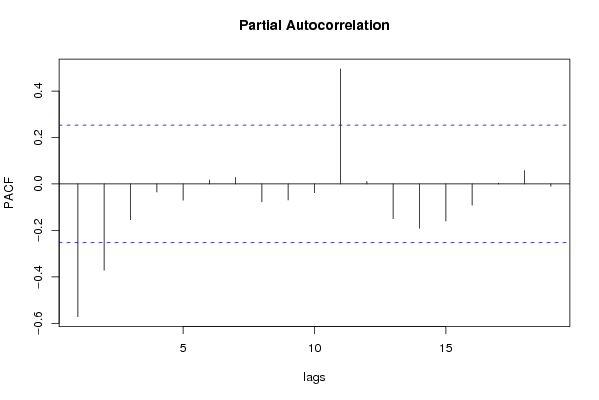
Title produced by software(Partial) Autocorrelation Function
Date of computationTue, 02 Dec 2008 13:39:05 -0700
Cite this page as followsStatistical Computations at FreeStatistics.org, Office for Research Development and Education, URL https://freestatistics.org/blog/index.php?v=date/2008/Dec/02/t1228250384i5itvhjkyltv9ad.htm/, Retrieved Fri, 17 May 2024 03:19:32 +0000
Statistical Computations at FreeStatistics.org, Office for Research Development and Education, URL https://freestatistics.org/blog/index.php?pk=28408, Retrieved Fri, 17 May 2024 03:19:32 +0000
QR Codes:

Original text written by user:
IsPrivate?No (this computation is public)
User-defined keywords
Estimated Impact164
Family? (F = Feedback message, R = changed R code, M = changed R Module, P = changed Parameters, D = changed Data)
F     [Univariate Data Series] [Airline data] [2007-10-18 09:58:47] [42daae401fd3def69a25014f2252b4c2]
F RMPD  [(Partial) Autocorrelation Function] [17.7.2] [2008-12-02 20:23:41] [1eab65e90adf64584b8e6f0da23ff414]
F    D      [(Partial) Autocorrelation Function] [17.8.2] [2008-12-02 20:39:05] [0458bd763b171003ec052ce63099d477] [Current]
Feedback Forum
2008-12-08 18:39:48 [5faab2fc6fb120339944528a32d48a04] [reply
Door differentiatie werd de lange termijn trend en de seizonaliteit uit de reeks verwijderd. De reeks is stationair gemaakt. Dit had op verschillende wijzen gekunt.

Post a new message
Dataseries X:
78.4
114.6
113.3
117
99.6
99.4
101.9
115.2
108.5
113.8
121
92.2
90.2
101.5
126.6
93.9
89.8
93.4
101.5
110.4
105.9
108.4
113.9
86.1
69.4
101.2
100.5
98
106.6
90.1
96.9
125.9
112
100
123.9
79.8
83.4
113.6
112.9
104
109.9
99
106.3
128.9
111.1
102.9
130
87
87.5
117.6
103.4
110.8
112.6
102.5
112.4
135.6
105.1
127.7
137
91
90.5
122.4
123.3
124.3
120
118.1
119
142.7
123.6
129.6
151.6
110.4
99.2
130.5
136.2
129.7
128
121.6
135.8
143.8
147.5
136.2
156.6
123.3
100.4


Summary of computational transaction
Raw Inputview raw input (R code)
Raw Outputview raw output of R engine
Computing time1 seconds
R Server'Gwilym Jenkins' @ 72.249.127.135

\begin{tabular}{lllllllll}
\hline
Summary of computational transaction \tabularnewline
Raw Input & view raw input (R code)  \tabularnewline
Raw Output & view raw output of R engine  \tabularnewline
Computing time & 1 seconds \tabularnewline
R Server & 'Gwilym Jenkins' @ 72.249.127.135 \tabularnewline
\hline
\end{tabular}
%Source: https://freestatistics.org/blog/index.php?pk=28408&T=0

[TABLE]
[ROW][C]Summary of computational transaction[/C][/ROW]
[ROW][C]Raw Input[/C][C]view raw input (R code) [/C][/ROW]
[ROW][C]Raw Output[/C][C]view raw output of R engine [/C][/ROW]
[ROW][C]Computing time[/C][C]1 seconds[/C][/ROW]
[ROW][C]R Server[/C][C]'Gwilym Jenkins' @ 72.249.127.135[/C][/ROW]
[/TABLE]
Source: https://freestatistics.org/blog/index.php?pk=28408&T=0

Globally Unique Identifier (entire table): ba.freestatistics.org/blog/index.php?pk=28408&T=0

As an alternative you can also use a QR Code:  

The GUIDs for individual cells are displayed in the table below:

Summary of computational transaction
Raw Inputview raw input (R code)
Raw Outputview raw output of R engine
Computing time1 seconds
R Server'Gwilym Jenkins' @ 72.249.127.135


Autocorrelation Function
Time lag kACF(k)T-STATP-value
1-0.5716-4.42762e-05
20.0763950.59180.27812
30.0634240.49130.312512
4-0.022641-0.17540.430687
5-0.04694-0.36360.358719
60.0800560.62010.268767
7-0.041974-0.32510.373107
8-0.05321-0.41220.340845
90.057580.4460.328596
10-0.012965-0.10040.46017
110.2729732.11440.019321
12-0.460093-3.56390.000362
130.2477191.91880.029884
14-0.042284-0.32750.372202
15-0.055034-0.42630.33571
160.0302630.23440.40773
170.0493070.38190.351931
18-0.09777-0.75730.22591
190.0337680.26160.397277

\begin{tabular}{lllllllll}
\hline
Autocorrelation Function \tabularnewline
Time lag k & ACF(k) & T-STAT & P-value \tabularnewline
1 & -0.5716 & -4.4276 & 2e-05 \tabularnewline
2 & 0.076395 & 0.5918 & 0.27812 \tabularnewline
3 & 0.063424 & 0.4913 & 0.312512 \tabularnewline
4 & -0.022641 & -0.1754 & 0.430687 \tabularnewline
5 & -0.04694 & -0.3636 & 0.358719 \tabularnewline
6 & 0.080056 & 0.6201 & 0.268767 \tabularnewline
7 & -0.041974 & -0.3251 & 0.373107 \tabularnewline
8 & -0.05321 & -0.4122 & 0.340845 \tabularnewline
9 & 0.05758 & 0.446 & 0.328596 \tabularnewline
10 & -0.012965 & -0.1004 & 0.46017 \tabularnewline
11 & 0.272973 & 2.1144 & 0.019321 \tabularnewline
12 & -0.460093 & -3.5639 & 0.000362 \tabularnewline
13 & 0.247719 & 1.9188 & 0.029884 \tabularnewline
14 & -0.042284 & -0.3275 & 0.372202 \tabularnewline
15 & -0.055034 & -0.4263 & 0.33571 \tabularnewline
16 & 0.030263 & 0.2344 & 0.40773 \tabularnewline
17 & 0.049307 & 0.3819 & 0.351931 \tabularnewline
18 & -0.09777 & -0.7573 & 0.22591 \tabularnewline
19 & 0.033768 & 0.2616 & 0.397277 \tabularnewline
\hline
\end{tabular}
%Source: https://freestatistics.org/blog/index.php?pk=28408&T=1

[TABLE]
[ROW][C]Autocorrelation Function[/C][/ROW]
[ROW][C]Time lag k[/C][C]ACF(k)[/C][C]T-STAT[/C][C]P-value[/C][/ROW]
[ROW][C]1[/C][C]-0.5716[/C][C]-4.4276[/C][C]2e-05[/C][/ROW]
[ROW][C]2[/C][C]0.076395[/C][C]0.5918[/C][C]0.27812[/C][/ROW]
[ROW][C]3[/C][C]0.063424[/C][C]0.4913[/C][C]0.312512[/C][/ROW]
[ROW][C]4[/C][C]-0.022641[/C][C]-0.1754[/C][C]0.430687[/C][/ROW]
[ROW][C]5[/C][C]-0.04694[/C][C]-0.3636[/C][C]0.358719[/C][/ROW]
[ROW][C]6[/C][C]0.080056[/C][C]0.6201[/C][C]0.268767[/C][/ROW]
[ROW][C]7[/C][C]-0.041974[/C][C]-0.3251[/C][C]0.373107[/C][/ROW]
[ROW][C]8[/C][C]-0.05321[/C][C]-0.4122[/C][C]0.340845[/C][/ROW]
[ROW][C]9[/C][C]0.05758[/C][C]0.446[/C][C]0.328596[/C][/ROW]
[ROW][C]10[/C][C]-0.012965[/C][C]-0.1004[/C][C]0.46017[/C][/ROW]
[ROW][C]11[/C][C]0.272973[/C][C]2.1144[/C][C]0.019321[/C][/ROW]
[ROW][C]12[/C][C]-0.460093[/C][C]-3.5639[/C][C]0.000362[/C][/ROW]
[ROW][C]13[/C][C]0.247719[/C][C]1.9188[/C][C]0.029884[/C][/ROW]
[ROW][C]14[/C][C]-0.042284[/C][C]-0.3275[/C][C]0.372202[/C][/ROW]
[ROW][C]15[/C][C]-0.055034[/C][C]-0.4263[/C][C]0.33571[/C][/ROW]
[ROW][C]16[/C][C]0.030263[/C][C]0.2344[/C][C]0.40773[/C][/ROW]
[ROW][C]17[/C][C]0.049307[/C][C]0.3819[/C][C]0.351931[/C][/ROW]
[ROW][C]18[/C][C]-0.09777[/C][C]-0.7573[/C][C]0.22591[/C][/ROW]
[ROW][C]19[/C][C]0.033768[/C][C]0.2616[/C][C]0.397277[/C][/ROW]
[/TABLE]
Source: https://freestatistics.org/blog/index.php?pk=28408&T=1

Globally Unique Identifier (entire table): ba.freestatistics.org/blog/index.php?pk=28408&T=1

As an alternative you can also use a QR Code:  

The GUIDs for individual cells are displayed in the table below:

Autocorrelation Function
Time lag kACF(k)T-STATP-value
1-0.5716-4.42762e-05
20.0763950.59180.27812
30.0634240.49130.312512
4-0.022641-0.17540.430687
5-0.04694-0.36360.358719
60.0800560.62010.268767
7-0.041974-0.32510.373107
8-0.05321-0.41220.340845
90.057580.4460.328596
10-0.012965-0.10040.46017
110.2729732.11440.019321
12-0.460093-3.56390.000362
130.2477191.91880.029884
14-0.042284-0.32750.372202
15-0.055034-0.42630.33571
160.0302630.23440.40773
170.0493070.38190.351931
18-0.09777-0.75730.22591
190.0337680.26160.397277


Partial Autocorrelation Function
Time lag kPACF(k)T-STATP-value
1-0.5716-4.42762e-05
2-0.371812-2.880.002753
3-0.153742-1.19090.119195
4-0.034508-0.26730.395078
5-0.069925-0.54160.295037
60.0167340.12960.448649
70.0280940.21760.414234
8-0.077263-0.59850.275888
9-0.068803-0.53290.298021
10-0.037913-0.29370.385012
110.4952183.83590.000151
120.0108390.0840.466683
13-0.149873-1.16090.125138
14-0.191134-1.48050.071984
15-0.15914-1.23270.11125
16-0.091743-0.71060.24003
170.0026890.02080.491726
180.0573770.44440.329161
19-0.010371-0.08030.468119

\begin{tabular}{lllllllll}
\hline
Partial Autocorrelation Function \tabularnewline
Time lag k & PACF(k) & T-STAT & P-value \tabularnewline
1 & -0.5716 & -4.4276 & 2e-05 \tabularnewline
2 & -0.371812 & -2.88 & 0.002753 \tabularnewline
3 & -0.153742 & -1.1909 & 0.119195 \tabularnewline
4 & -0.034508 & -0.2673 & 0.395078 \tabularnewline
5 & -0.069925 & -0.5416 & 0.295037 \tabularnewline
6 & 0.016734 & 0.1296 & 0.448649 \tabularnewline
7 & 0.028094 & 0.2176 & 0.414234 \tabularnewline
8 & -0.077263 & -0.5985 & 0.275888 \tabularnewline
9 & -0.068803 & -0.5329 & 0.298021 \tabularnewline
10 & -0.037913 & -0.2937 & 0.385012 \tabularnewline
11 & 0.495218 & 3.8359 & 0.000151 \tabularnewline
12 & 0.010839 & 0.084 & 0.466683 \tabularnewline
13 & -0.149873 & -1.1609 & 0.125138 \tabularnewline
14 & -0.191134 & -1.4805 & 0.071984 \tabularnewline
15 & -0.15914 & -1.2327 & 0.11125 \tabularnewline
16 & -0.091743 & -0.7106 & 0.24003 \tabularnewline
17 & 0.002689 & 0.0208 & 0.491726 \tabularnewline
18 & 0.057377 & 0.4444 & 0.329161 \tabularnewline
19 & -0.010371 & -0.0803 & 0.468119 \tabularnewline
\hline
\end{tabular}
%Source: https://freestatistics.org/blog/index.php?pk=28408&T=2

[TABLE]
[ROW][C]Partial Autocorrelation Function[/C][/ROW]
[ROW][C]Time lag k[/C][C]PACF(k)[/C][C]T-STAT[/C][C]P-value[/C][/ROW]
[ROW][C]1[/C][C]-0.5716[/C][C]-4.4276[/C][C]2e-05[/C][/ROW]
[ROW][C]2[/C][C]-0.371812[/C][C]-2.88[/C][C]0.002753[/C][/ROW]
[ROW][C]3[/C][C]-0.153742[/C][C]-1.1909[/C][C]0.119195[/C][/ROW]
[ROW][C]4[/C][C]-0.034508[/C][C]-0.2673[/C][C]0.395078[/C][/ROW]
[ROW][C]5[/C][C]-0.069925[/C][C]-0.5416[/C][C]0.295037[/C][/ROW]
[ROW][C]6[/C][C]0.016734[/C][C]0.1296[/C][C]0.448649[/C][/ROW]
[ROW][C]7[/C][C]0.028094[/C][C]0.2176[/C][C]0.414234[/C][/ROW]
[ROW][C]8[/C][C]-0.077263[/C][C]-0.5985[/C][C]0.275888[/C][/ROW]
[ROW][C]9[/C][C]-0.068803[/C][C]-0.5329[/C][C]0.298021[/C][/ROW]
[ROW][C]10[/C][C]-0.037913[/C][C]-0.2937[/C][C]0.385012[/C][/ROW]
[ROW][C]11[/C][C]0.495218[/C][C]3.8359[/C][C]0.000151[/C][/ROW]
[ROW][C]12[/C][C]0.010839[/C][C]0.084[/C][C]0.466683[/C][/ROW]
[ROW][C]13[/C][C]-0.149873[/C][C]-1.1609[/C][C]0.125138[/C][/ROW]
[ROW][C]14[/C][C]-0.191134[/C][C]-1.4805[/C][C]0.071984[/C][/ROW]
[ROW][C]15[/C][C]-0.15914[/C][C]-1.2327[/C][C]0.11125[/C][/ROW]
[ROW][C]16[/C][C]-0.091743[/C][C]-0.7106[/C][C]0.24003[/C][/ROW]
[ROW][C]17[/C][C]0.002689[/C][C]0.0208[/C][C]0.491726[/C][/ROW]
[ROW][C]18[/C][C]0.057377[/C][C]0.4444[/C][C]0.329161[/C][/ROW]
[ROW][C]19[/C][C]-0.010371[/C][C]-0.0803[/C][C]0.468119[/C][/ROW]
[/TABLE]
Source: https://freestatistics.org/blog/index.php?pk=28408&T=2

Globally Unique Identifier (entire table): ba.freestatistics.org/blog/index.php?pk=28408&T=2

As an alternative you can also use a QR Code:  

The GUIDs for individual cells are displayed in the table below:

Partial Autocorrelation Function
Time lag kPACF(k)T-STATP-value
1-0.5716-4.42762e-05
2-0.371812-2.880.002753
3-0.153742-1.19090.119195
4-0.034508-0.26730.395078
5-0.069925-0.54160.295037
60.0167340.12960.448649
70.0280940.21760.414234
8-0.077263-0.59850.275888
9-0.068803-0.53290.298021
10-0.037913-0.29370.385012
110.4952183.83590.000151
120.0108390.0840.466683
13-0.149873-1.16090.125138
14-0.191134-1.48050.071984
15-0.15914-1.23270.11125
16-0.091743-0.71060.24003
170.0026890.02080.491726
180.0573770.44440.329161
19-0.010371-0.08030.468119


Parameters (Session):
par1 = Default ; par2 = 1 ; par3 = 0 ; par4 = 0 ; par5 = 12 ;
Parameters (R input):
par1 = Default ; par2 = 1 ; par3 = 1 ; par4 = 2 ; par5 = 12 ;
R code (references can be found in the software module):
if (par1 == 'Default') {
par1 = 10*log10(length(x))
} else {
par1 <- as.numeric(par1)
}
par2 <- as.numeric(par2)
par3 <- as.numeric(par3)
par4 <- as.numeric(par4)
par5 <- as.numeric(par5)
if (par2 == 0) {
x <- log(x)
} else {
x <- (x ^ par2 - 1) / par2
}
if (par3 > 0) x <- diff(x,lag=1,difference=par3)
if (par4 > 0) x <- diff(x,lag=par5,difference=par4)
bitmap(file='pic1.png')
racf <- acf(x,par1,main='Autocorrelation',xlab='lags',ylab='ACF')
dev.off()
bitmap(file='pic2.png')
rpacf <- pacf(x,par1,main='Partial Autocorrelation',xlab='lags',ylab='PACF')
dev.off()
(myacf <- c(racf$acf))
(mypacf <- c(rpacf$acf))
lengthx <- length(x)
sqrtn <- sqrt(lengthx)
load(file='createtable')
a<-table.start()
a<-table.row.start(a)
a<-table.element(a,'Autocorrelation Function',4,TRUE)
a<-table.row.end(a)
a<-table.row.start(a)
a<-table.element(a,'Time lag k',header=TRUE)
a<-table.element(a,hyperlink('basics.htm','ACF(k)','click here for more information about the Autocorrelation Function'),header=TRUE)
a<-table.element(a,'T-STAT',header=TRUE)
a<-table.element(a,'P-value',header=TRUE)
a<-table.row.end(a)
for (i in 2:(par1+1)) {
a<-table.row.start(a)
a<-table.element(a,i-1,header=TRUE)
a<-table.element(a,round(myacf[i],6))
mytstat <- myacf[i]*sqrtn
a<-table.element(a,round(mytstat,4))
a<-table.element(a,round(1-pt(abs(mytstat),lengthx),6))
a<-table.row.end(a)
}
a<-table.end(a)
table.save(a,file='mytable.tab')
a<-table.start()
a<-table.row.start(a)
a<-table.element(a,'Partial Autocorrelation Function',4,TRUE)
a<-table.row.end(a)
a<-table.row.start(a)
a<-table.element(a,'Time lag k',header=TRUE)
a<-table.element(a,hyperlink('basics.htm','PACF(k)','click here for more information about the Partial Autocorrelation Function'),header=TRUE)
a<-table.element(a,'T-STAT',header=TRUE)
a<-table.element(a,'P-value',header=TRUE)
a<-table.row.end(a)
for (i in 1:par1) {
a<-table.row.start(a)
a<-table.element(a,i,header=TRUE)
a<-table.element(a,round(mypacf[i],6))
mytstat <- mypacf[i]*sqrtn
a<-table.element(a,round(mytstat,4))
a<-table.element(a,round(1-pt(abs(mytstat),lengthx),6))
a<-table.row.end(a)
}
a<-table.end(a)
table.save(a,file='mytable1.tab')