Free Statistics

of Irreproducible Research!

Author's title

Author*Unverified author*
R Software Modulerwasp_cross.wasp
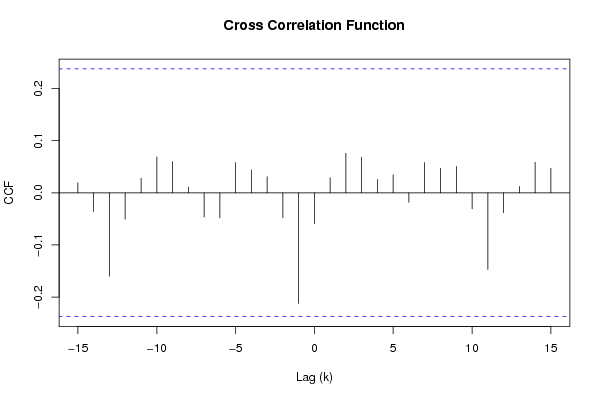
Title produced by softwareCross Correlation Function
Date of computationTue, 02 Dec 2008 13:37:24 -0700
Cite this page as followsStatistical Computations at FreeStatistics.org, Office for Research Development and Education, URL https://freestatistics.org/blog/index.php?v=date/2008/Dec/02/t1228250280da3n7czh8pj62e7.htm/, Retrieved Fri, 17 May 2024 02:01:59 +0000
Statistical Computations at FreeStatistics.org, Office for Research Development and Education, URL https://freestatistics.org/blog/index.php?pk=28403, Retrieved Fri, 17 May 2024 02:01:59 +0000
QR Codes:

Original text written by user:
IsPrivate?No (this computation is public)
User-defined keywordsVan Dooren Leen
Estimated Impact154
Family? (F = Feedback message, R = changed R code, M = changed R Module, P = changed Parameters, D = changed Data)
F     [Univariate Data Series] [Airline data] [2007-10-18 09:58:47] [42daae401fd3def69a25014f2252b4c2]
F RMPD    [Cross Correlation Function] [NST Q9] [2008-12-02 20:37:24] [006ad2c49b6a7c2ad6ab685cfc1dae56] [Current]
Feedback Forum
2008-12-06 19:42:39 [Stefan Temmerman] [reply
De student heeft de nonsenscorrelatie uit vraag 7 omgevormd door middel van differentiatie tot een goede stationaire reeks.
2008-12-07 11:25:44 [006ad2c49b6a7c2ad6ab685cfc1dae56] [reply
Goede oplossing, dit is een stationaire tijdreeks.
2008-12-07 11:59:38 [Lana Van Wesemael] [reply
Aangezien je in de vorige vraag de lambda waarde vergeten bent zou het kunnen dat de grafiek er met de juiste lambda er anders uitziet. De lambda moet je invullen in het Box-Cox transformation parameter vakje.
2008-12-08 19:48:33 [Birgit Van Dyck] [reply
Door een andere lambda waarde zou de tijdreeks er anders kunnen uitzien.

Post a new message
Dataseries X:
127
123
118
114
108
111
151
159
158
148
138
137
136
133
126
120
114
116
153
162
161
149
139
135
130
127
122
117
112
113
149
157
157
147
137
132
125
123
117
114
111
112
144
150
149
134
123
116
117
111
105
102
95
93
124
130
124
115
106
105
105
101
95
93
84
87
116
120
117
109
Dataseries Y:
392
394
392
396
392
396
419
421
420
418
410
418
426
428
430
424
423
427
441
449
452
462
455
461
461
463
462
456
455
456
472
472
471
465
459
465
468
467
463
460
462
461
476
476
471
453
443
442
444
438
427
424
416
406
431
434
418
412
404
409
412
406
398
397
385
390
413
413
401
397


Summary of computational transaction
Raw Inputview raw input (R code)
Raw Outputview raw output of R engine
Computing time1 seconds
R Server'Gwilym Jenkins' @ 72.249.127.135

\begin{tabular}{lllllllll}
\hline
Summary of computational transaction \tabularnewline
Raw Input & view raw input (R code)  \tabularnewline
Raw Output & view raw output of R engine  \tabularnewline
Computing time & 1 seconds \tabularnewline
R Server & 'Gwilym Jenkins' @ 72.249.127.135 \tabularnewline
\hline
\end{tabular}
%Source: https://freestatistics.org/blog/index.php?pk=28403&T=0

[TABLE]
[ROW][C]Summary of computational transaction[/C][/ROW]
[ROW][C]Raw Input[/C][C]view raw input (R code) [/C][/ROW]
[ROW][C]Raw Output[/C][C]view raw output of R engine [/C][/ROW]
[ROW][C]Computing time[/C][C]1 seconds[/C][/ROW]
[ROW][C]R Server[/C][C]'Gwilym Jenkins' @ 72.249.127.135[/C][/ROW]
[/TABLE]
Source: https://freestatistics.org/blog/index.php?pk=28403&T=0

Globally Unique Identifier (entire table): ba.freestatistics.org/blog/index.php?pk=28403&T=0

As an alternative you can also use a QR Code:  

The GUIDs for individual cells are displayed in the table below:

Summary of computational transaction
Raw Inputview raw input (R code)
Raw Outputview raw output of R engine
Computing time1 seconds
R Server'Gwilym Jenkins' @ 72.249.127.135


Cross Correlation Function
ParameterValue
Box-Cox transformation parameter (lambda) of X series1
Degree of non-seasonal differencing (d) of X series1
Degree of seasonal differencing (D) of X series1
Seasonal Period (s)1
Box-Cox transformation parameter (lambda) of Y series1
Degree of non-seasonal differencing (d) of Y series0
Degree of seasonal differencing (D) of Y series0
krho(Y[t],X[t+k])
-150.0194458417518121
-14-0.0361202057314756
-13-0.160100682491066
-12-0.0508083347830494
-110.0279266850608449
-100.0689030432064834
-90.059615380281362
-80.0109155028443214
-7-0.0465197273021791
-6-0.0478536957224569
-50.0579252917195332
-40.0438504117541457
-30.0309380579341545
-2-0.0477074148590478
-1-0.212438417479391
0-0.0592255507419754
10.0290740454239839
20.075787550062187
30.0683088202834926
40.0256835969296155
50.0348329754946998
6-0.0179842739544513
70.0580525464197467
80.0470944415143571
90.0506198654708155
10-0.0306195075713772
11-0.147192878405752
12-0.0383908680122636
130.0121887392001961
140.058501453574563
150.0470921666470185

\begin{tabular}{lllllllll}
\hline
Cross Correlation Function \tabularnewline
Parameter & Value \tabularnewline
Box-Cox transformation parameter (lambda) of X series & 1 \tabularnewline
Degree of non-seasonal differencing (d) of X series & 1 \tabularnewline
Degree of seasonal differencing (D) of X series & 1 \tabularnewline
Seasonal Period (s) & 1 \tabularnewline
Box-Cox transformation parameter (lambda) of Y series & 1 \tabularnewline
Degree of non-seasonal differencing (d) of Y series & 0 \tabularnewline
Degree of seasonal differencing (D) of Y series & 0 \tabularnewline
k & rho(Y[t],X[t+k]) \tabularnewline
-15 & 0.0194458417518121 \tabularnewline
-14 & -0.0361202057314756 \tabularnewline
-13 & -0.160100682491066 \tabularnewline
-12 & -0.0508083347830494 \tabularnewline
-11 & 0.0279266850608449 \tabularnewline
-10 & 0.0689030432064834 \tabularnewline
-9 & 0.059615380281362 \tabularnewline
-8 & 0.0109155028443214 \tabularnewline
-7 & -0.0465197273021791 \tabularnewline
-6 & -0.0478536957224569 \tabularnewline
-5 & 0.0579252917195332 \tabularnewline
-4 & 0.0438504117541457 \tabularnewline
-3 & 0.0309380579341545 \tabularnewline
-2 & -0.0477074148590478 \tabularnewline
-1 & -0.212438417479391 \tabularnewline
0 & -0.0592255507419754 \tabularnewline
1 & 0.0290740454239839 \tabularnewline
2 & 0.075787550062187 \tabularnewline
3 & 0.0683088202834926 \tabularnewline
4 & 0.0256835969296155 \tabularnewline
5 & 0.0348329754946998 \tabularnewline
6 & -0.0179842739544513 \tabularnewline
7 & 0.0580525464197467 \tabularnewline
8 & 0.0470944415143571 \tabularnewline
9 & 0.0506198654708155 \tabularnewline
10 & -0.0306195075713772 \tabularnewline
11 & -0.147192878405752 \tabularnewline
12 & -0.0383908680122636 \tabularnewline
13 & 0.0121887392001961 \tabularnewline
14 & 0.058501453574563 \tabularnewline
15 & 0.0470921666470185 \tabularnewline
\hline
\end{tabular}
%Source: https://freestatistics.org/blog/index.php?pk=28403&T=1

[TABLE]
[ROW][C]Cross Correlation Function[/C][/ROW]
[ROW][C]Parameter[/C][C]Value[/C][/ROW]
[ROW][C]Box-Cox transformation parameter (lambda) of X series[/C][C]1[/C][/ROW]
[ROW][C]Degree of non-seasonal differencing (d) of X series[/C][C]1[/C][/ROW]
[ROW][C]Degree of seasonal differencing (D) of X series[/C][C]1[/C][/ROW]
[ROW][C]Seasonal Period (s)[/C][C]1[/C][/ROW]
[ROW][C]Box-Cox transformation parameter (lambda) of Y series[/C][C]1[/C][/ROW]
[ROW][C]Degree of non-seasonal differencing (d) of Y series[/C][C]0[/C][/ROW]
[ROW][C]Degree of seasonal differencing (D) of Y series[/C][C]0[/C][/ROW]
[ROW][C]k[/C][C]rho(Y[t],X[t+k])[/C][/ROW]
[ROW][C]-15[/C][C]0.0194458417518121[/C][/ROW]
[ROW][C]-14[/C][C]-0.0361202057314756[/C][/ROW]
[ROW][C]-13[/C][C]-0.160100682491066[/C][/ROW]
[ROW][C]-12[/C][C]-0.0508083347830494[/C][/ROW]
[ROW][C]-11[/C][C]0.0279266850608449[/C][/ROW]
[ROW][C]-10[/C][C]0.0689030432064834[/C][/ROW]
[ROW][C]-9[/C][C]0.059615380281362[/C][/ROW]
[ROW][C]-8[/C][C]0.0109155028443214[/C][/ROW]
[ROW][C]-7[/C][C]-0.0465197273021791[/C][/ROW]
[ROW][C]-6[/C][C]-0.0478536957224569[/C][/ROW]
[ROW][C]-5[/C][C]0.0579252917195332[/C][/ROW]
[ROW][C]-4[/C][C]0.0438504117541457[/C][/ROW]
[ROW][C]-3[/C][C]0.0309380579341545[/C][/ROW]
[ROW][C]-2[/C][C]-0.0477074148590478[/C][/ROW]
[ROW][C]-1[/C][C]-0.212438417479391[/C][/ROW]
[ROW][C]0[/C][C]-0.0592255507419754[/C][/ROW]
[ROW][C]1[/C][C]0.0290740454239839[/C][/ROW]
[ROW][C]2[/C][C]0.075787550062187[/C][/ROW]
[ROW][C]3[/C][C]0.0683088202834926[/C][/ROW]
[ROW][C]4[/C][C]0.0256835969296155[/C][/ROW]
[ROW][C]5[/C][C]0.0348329754946998[/C][/ROW]
[ROW][C]6[/C][C]-0.0179842739544513[/C][/ROW]
[ROW][C]7[/C][C]0.0580525464197467[/C][/ROW]
[ROW][C]8[/C][C]0.0470944415143571[/C][/ROW]
[ROW][C]9[/C][C]0.0506198654708155[/C][/ROW]
[ROW][C]10[/C][C]-0.0306195075713772[/C][/ROW]
[ROW][C]11[/C][C]-0.147192878405752[/C][/ROW]
[ROW][C]12[/C][C]-0.0383908680122636[/C][/ROW]
[ROW][C]13[/C][C]0.0121887392001961[/C][/ROW]
[ROW][C]14[/C][C]0.058501453574563[/C][/ROW]
[ROW][C]15[/C][C]0.0470921666470185[/C][/ROW]
[/TABLE]
Source: https://freestatistics.org/blog/index.php?pk=28403&T=1

Globally Unique Identifier (entire table): ba.freestatistics.org/blog/index.php?pk=28403&T=1

As an alternative you can also use a QR Code:  

The GUIDs for individual cells are displayed in the table below:

Cross Correlation Function
ParameterValue
Box-Cox transformation parameter (lambda) of X series1
Degree of non-seasonal differencing (d) of X series1
Degree of seasonal differencing (D) of X series1
Seasonal Period (s)1
Box-Cox transformation parameter (lambda) of Y series1
Degree of non-seasonal differencing (d) of Y series0
Degree of seasonal differencing (D) of Y series0
krho(Y[t],X[t+k])
-150.0194458417518121
-14-0.0361202057314756
-13-0.160100682491066
-12-0.0508083347830494
-110.0279266850608449
-100.0689030432064834
-90.059615380281362
-80.0109155028443214
-7-0.0465197273021791
-6-0.0478536957224569
-50.0579252917195332
-40.0438504117541457
-30.0309380579341545
-2-0.0477074148590478
-1-0.212438417479391
0-0.0592255507419754
10.0290740454239839
20.075787550062187
30.0683088202834926
40.0256835969296155
50.0348329754946998
6-0.0179842739544513
70.0580525464197467
80.0470944415143571
90.0506198654708155
10-0.0306195075713772
11-0.147192878405752
12-0.0383908680122636
130.0121887392001961
140.058501453574563
150.0470921666470185


Parameters (Session):
par1 = Default ; par2 = 1 ; par3 = 1 ; par4 = 1 ; par5 = 12 ;
Parameters (R input):
par1 = 1 ; par2 = 1 ; par3 = 1 ; par4 = 1 ; par5 = 1 ; par6 = 0 ; par7 = 0 ;
R code (references can be found in the software module):
par1 <- as.numeric(par1)
par2 <- as.numeric(par2)
par3 <- as.numeric(par3)
par4 <- as.numeric(par4)
par5 <- as.numeric(par5)
par6 <- as.numeric(par6)
par7 <- as.numeric(par7)
if (par1 == 0) {
x <- log(x)
} else {
x <- (x ^ par1 - 1) / par1
}
if (par5 == 0) {
y <- log(y)
} else {
y <- (y ^ par5 - 1) / par5
}
if (par2 > 0) x <- diff(x,lag=1,difference=par2)
if (par6 > 0) y <- diff(y,lag=1,difference=par6)
if (par3 > 0) x <- diff(x,lag=par4,difference=par3)
if (par7 > 0) y <- diff(y,lag=par4,difference=par7)
x
y
bitmap(file='test1.png')
(r <- ccf(x,y,main='Cross Correlation Function',ylab='CCF',xlab='Lag (k)'))
dev.off()
load(file='createtable')
a<-table.start()
a<-table.row.start(a)
a<-table.element(a,'Cross Correlation Function',2,TRUE)
a<-table.row.end(a)
a<-table.row.start(a)
a<-table.element(a,'Parameter',header=TRUE)
a<-table.element(a,'Value',header=TRUE)
a<-table.row.end(a)
a<-table.row.start(a)
a<-table.element(a,'Box-Cox transformation parameter (lambda) of X series',header=TRUE)
a<-table.element(a,par1)
a<-table.row.end(a)
a<-table.row.start(a)
a<-table.element(a,'Degree of non-seasonal differencing (d) of X series',header=TRUE)
a<-table.element(a,par2)
a<-table.row.end(a)
a<-table.row.start(a)
a<-table.element(a,'Degree of seasonal differencing (D) of X series',header=TRUE)
a<-table.element(a,par3)
a<-table.row.end(a)
a<-table.row.start(a)
a<-table.element(a,'Seasonal Period (s)',header=TRUE)
a<-table.element(a,par4)
a<-table.row.end(a)
a<-table.row.start(a)
a<-table.element(a,'Box-Cox transformation parameter (lambda) of Y series',header=TRUE)
a<-table.element(a,par5)
a<-table.row.end(a)
a<-table.row.start(a)
a<-table.element(a,'Degree of non-seasonal differencing (d) of Y series',header=TRUE)
a<-table.element(a,par6)
a<-table.row.end(a)
a<-table.row.start(a)
a<-table.element(a,'Degree of seasonal differencing (D) of Y series',header=TRUE)
a<-table.element(a,par7)
a<-table.row.end(a)
a<-table.row.start(a)
a<-table.element(a,'k',header=TRUE)
a<-table.element(a,'rho(Y[t],X[t+k])',header=TRUE)
a<-table.row.end(a)
mylength <- length(r$acf)
myhalf <- floor((mylength-1)/2)
for (i in 1:mylength) {
a<-table.row.start(a)
a<-table.element(a,i-myhalf-1,header=TRUE)
a<-table.element(a,r$acf[i])
a<-table.row.end(a)
}
a<-table.end(a)
table.save(a,file='mytable.tab')