Free Statistics

of Irreproducible Research!

Author's title

Author*The author of this computation has been verified*
R Software Modulerwasp_cross.wasp
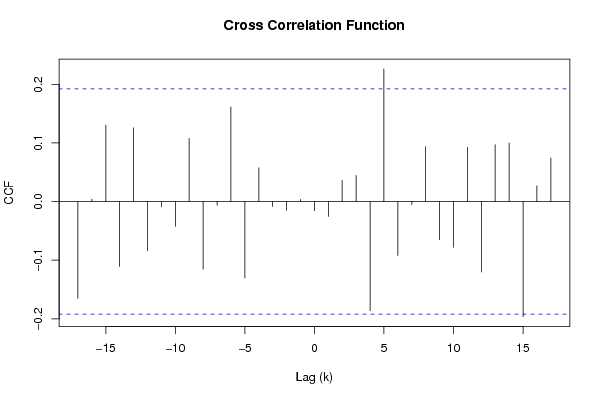
Title produced by softwareCross Correlation Function
Date of computationTue, 02 Dec 2008 13:15:42 -0700
Cite this page as followsStatistical Computations at FreeStatistics.org, Office for Research Development and Education, URL https://freestatistics.org/blog/index.php?v=date/2008/Dec/02/t122824898888h2l1fadcmo2ul.htm/, Retrieved Fri, 17 May 2024 03:04:06 +0000
Statistical Computations at FreeStatistics.org, Office for Research Development and Education, URL https://freestatistics.org/blog/index.php?pk=28349, Retrieved Fri, 17 May 2024 03:04:06 +0000
QR Codes:

Original text written by user:
IsPrivate?No (this computation is public)
User-defined keywords
Estimated Impact176
Family? (F = Feedback message, R = changed R code, M = changed R Module, P = changed Parameters, D = changed Data)
F     [Law of Averages] [Random Walk Simul...] [2008-11-25 18:40:39] [b98453cac15ba1066b407e146608df68]
F RMPD    [Cross Correlation Function] [workshop 7, Q9] [2008-12-02 20:15:42] [a16dfd7e948381d8b6391003c5d09447] [Current]
Feedback Forum
2008-12-04 09:39:13 [Julie Govaerts] [reply
De Rho waarde is de correlatiecoefficient.
Natuurlijk zoeken we hier de hoogste coëfficiënt
5 0.226297961239635
dus bij k=5 (toekomst van Xt voorspelt de Yt)
De hoogste correlatie ligt op lag 5 = versnelling van de gegevens --> in Q7 was het nog nonsens owv de eventuele trend en saisonaliteit die erin zat nu zijn deze eruit gehaald!
2008-12-07 14:52:54 [Stephanie Vanderlinden] [reply
Goede verklaring.
2008-12-09 15:26:29 [Jonas Janssens] [reply
De correlatiecoëfficiënten die buiten het 95%betrouwbaarheidsinterval liggen zijn significant verschillend van nul en dus niet toe te schrijven aan toeval. Aangezien de lange termijn trend en de seizonaliteit er al uitgehaald zijn, is er misschien een andere verklaring voor deze waarden.

Post a new message
Dataseries X:
-3
-2
0
1
11
14
14
16
14
10
15
18
18
12
8
2
-2
-1
1
-6
-16
-21
-38
-32
-22
-31
-22
-26
-19
-20
-24
-29
-28
-31
-30
-32
-38
-43
-51
-43
-43
-42
-47
-45
-38
-46
-38
-32
-27
-26
-21
-23
-24
-17
-23
-16
-22
-26
-25
-21
-21
-18
-12
-19
-31
-38
-38
-32
-43
-33
-28
-25
-19
-20
-21
-19
-17
-16
-10
-16
-10
-8
-7
-15
-7
-6
-6
2
-4
-4
-8
-10
-16
-14
-30
-33
-40
-38
-39
-46
-50
-55
-66
-63
-56
-66
-63
Dataseries Y:
7.5
7.2
6.9
6.7
6.4
6.3
6.8
7.3
7.1
7.1
6.8
6.5
6.3
6.1
6.1
6.3
6.3
6
6.2
6.4
6.8
7.5
7.5
7.6
7.6
7.4
7.3
7.1
6.9
6.8
7.5
7.6
7.8
8
8.1
8.2
8.3
8.2
8
7.9
7.6
7.6
8.2
8.3
8.4
8.4
8.4
8.6
8.9
8.8
8.3
7.5
7.2
7.5
8.8
9.3
9.3
8.7
8.2
8.3
8.5
8.6
8.6
8.2
8.1
8
8.6
8.7
8.8
8.5
8.4
8.5
8.7
8.7
8.6
8.5
8.3
8.1
8.2
8.1
8.1
7.9
7.9
7.9
8
8
7.9
8
7.7
7.2
7.5
7.3
7
7
7
7.2
7.3
7.1
6.8
6.6
6.2
6.2
6.8
6.9
6.8
6.7


Summary of computational transaction
Raw Inputview raw input (R code)
Raw Outputview raw output of R engine
Computing time3 seconds
R Server'Herman Ole Andreas Wold' @ 193.190.124.10:1001

\begin{tabular}{lllllllll}
\hline
Summary of computational transaction \tabularnewline
Raw Input & view raw input (R code)  \tabularnewline
Raw Output & view raw output of R engine  \tabularnewline
Computing time & 3 seconds \tabularnewline
R Server & 'Herman Ole Andreas Wold' @ 193.190.124.10:1001 \tabularnewline
\hline
\end{tabular}
%Source: https://freestatistics.org/blog/index.php?pk=28349&T=0

[TABLE]
[ROW][C]Summary of computational transaction[/C][/ROW]
[ROW][C]Raw Input[/C][C]view raw input (R code) [/C][/ROW]
[ROW][C]Raw Output[/C][C]view raw output of R engine [/C][/ROW]
[ROW][C]Computing time[/C][C]3 seconds[/C][/ROW]
[ROW][C]R Server[/C][C]'Herman Ole Andreas Wold' @ 193.190.124.10:1001[/C][/ROW]
[/TABLE]
Source: https://freestatistics.org/blog/index.php?pk=28349&T=0

Globally Unique Identifier (entire table): ba.freestatistics.org/blog/index.php?pk=28349&T=0

As an alternative you can also use a QR Code:  

The GUIDs for individual cells are displayed in the table below:

Summary of computational transaction
Raw Inputview raw input (R code)
Raw Outputview raw output of R engine
Computing time3 seconds
R Server'Herman Ole Andreas Wold' @ 193.190.124.10:1001


Cross Correlation Function
ParameterValue
Box-Cox transformation parameter (lambda) of X series1
Degree of non-seasonal differencing (d) of X series1
Degree of seasonal differencing (D) of X series1
Seasonal Period (s)1
Box-Cox transformation parameter (lambda) of Y series1
Degree of non-seasonal differencing (d) of Y series1
Degree of seasonal differencing (D) of Y series1
krho(Y[t],X[t+k])
-17-0.165075247764858
-160.00413297990134462
-150.130592995419918
-14-0.110919932457885
-130.125803695063513
-12-0.0840536607210104
-11-0.0088328050730069
-10-0.0421476947844029
-90.107740741538621
-8-0.115336113050273
-7-0.00619103597563874
-60.161289325047140
-5-0.130226216916337
-40.0575829568100946
-3-0.0084921525624198
-2-0.0147942874208852
-10.0037334170813138
0-0.0157024827404370
1-0.0252973804925629
20.03615469637216
30.0446265569011871
4-0.186089106833341
50.226297961239635
6-0.0918596254917207
7-0.00481599706283682
80.0936302322304799
9-0.0649799736953284
10-0.0779877378137613
110.0923595070518393
12-0.120299290767814
130.097026801557467
140.099794064198851
15-0.196306843185429
160.0270305103821497
170.074435427130482

\begin{tabular}{lllllllll}
\hline
Cross Correlation Function \tabularnewline
Parameter & Value \tabularnewline
Box-Cox transformation parameter (lambda) of X series & 1 \tabularnewline
Degree of non-seasonal differencing (d) of X series & 1 \tabularnewline
Degree of seasonal differencing (D) of X series & 1 \tabularnewline
Seasonal Period (s) & 1 \tabularnewline
Box-Cox transformation parameter (lambda) of Y series & 1 \tabularnewline
Degree of non-seasonal differencing (d) of Y series & 1 \tabularnewline
Degree of seasonal differencing (D) of Y series & 1 \tabularnewline
k & rho(Y[t],X[t+k]) \tabularnewline
-17 & -0.165075247764858 \tabularnewline
-16 & 0.00413297990134462 \tabularnewline
-15 & 0.130592995419918 \tabularnewline
-14 & -0.110919932457885 \tabularnewline
-13 & 0.125803695063513 \tabularnewline
-12 & -0.0840536607210104 \tabularnewline
-11 & -0.0088328050730069 \tabularnewline
-10 & -0.0421476947844029 \tabularnewline
-9 & 0.107740741538621 \tabularnewline
-8 & -0.115336113050273 \tabularnewline
-7 & -0.00619103597563874 \tabularnewline
-6 & 0.161289325047140 \tabularnewline
-5 & -0.130226216916337 \tabularnewline
-4 & 0.0575829568100946 \tabularnewline
-3 & -0.0084921525624198 \tabularnewline
-2 & -0.0147942874208852 \tabularnewline
-1 & 0.0037334170813138 \tabularnewline
0 & -0.0157024827404370 \tabularnewline
1 & -0.0252973804925629 \tabularnewline
2 & 0.03615469637216 \tabularnewline
3 & 0.0446265569011871 \tabularnewline
4 & -0.186089106833341 \tabularnewline
5 & 0.226297961239635 \tabularnewline
6 & -0.0918596254917207 \tabularnewline
7 & -0.00481599706283682 \tabularnewline
8 & 0.0936302322304799 \tabularnewline
9 & -0.0649799736953284 \tabularnewline
10 & -0.0779877378137613 \tabularnewline
11 & 0.0923595070518393 \tabularnewline
12 & -0.120299290767814 \tabularnewline
13 & 0.097026801557467 \tabularnewline
14 & 0.099794064198851 \tabularnewline
15 & -0.196306843185429 \tabularnewline
16 & 0.0270305103821497 \tabularnewline
17 & 0.074435427130482 \tabularnewline
\hline
\end{tabular}
%Source: https://freestatistics.org/blog/index.php?pk=28349&T=1

[TABLE]
[ROW][C]Cross Correlation Function[/C][/ROW]
[ROW][C]Parameter[/C][C]Value[/C][/ROW]
[ROW][C]Box-Cox transformation parameter (lambda) of X series[/C][C]1[/C][/ROW]
[ROW][C]Degree of non-seasonal differencing (d) of X series[/C][C]1[/C][/ROW]
[ROW][C]Degree of seasonal differencing (D) of X series[/C][C]1[/C][/ROW]
[ROW][C]Seasonal Period (s)[/C][C]1[/C][/ROW]
[ROW][C]Box-Cox transformation parameter (lambda) of Y series[/C][C]1[/C][/ROW]
[ROW][C]Degree of non-seasonal differencing (d) of Y series[/C][C]1[/C][/ROW]
[ROW][C]Degree of seasonal differencing (D) of Y series[/C][C]1[/C][/ROW]
[ROW][C]k[/C][C]rho(Y[t],X[t+k])[/C][/ROW]
[ROW][C]-17[/C][C]-0.165075247764858[/C][/ROW]
[ROW][C]-16[/C][C]0.00413297990134462[/C][/ROW]
[ROW][C]-15[/C][C]0.130592995419918[/C][/ROW]
[ROW][C]-14[/C][C]-0.110919932457885[/C][/ROW]
[ROW][C]-13[/C][C]0.125803695063513[/C][/ROW]
[ROW][C]-12[/C][C]-0.0840536607210104[/C][/ROW]
[ROW][C]-11[/C][C]-0.0088328050730069[/C][/ROW]
[ROW][C]-10[/C][C]-0.0421476947844029[/C][/ROW]
[ROW][C]-9[/C][C]0.107740741538621[/C][/ROW]
[ROW][C]-8[/C][C]-0.115336113050273[/C][/ROW]
[ROW][C]-7[/C][C]-0.00619103597563874[/C][/ROW]
[ROW][C]-6[/C][C]0.161289325047140[/C][/ROW]
[ROW][C]-5[/C][C]-0.130226216916337[/C][/ROW]
[ROW][C]-4[/C][C]0.0575829568100946[/C][/ROW]
[ROW][C]-3[/C][C]-0.0084921525624198[/C][/ROW]
[ROW][C]-2[/C][C]-0.0147942874208852[/C][/ROW]
[ROW][C]-1[/C][C]0.0037334170813138[/C][/ROW]
[ROW][C]0[/C][C]-0.0157024827404370[/C][/ROW]
[ROW][C]1[/C][C]-0.0252973804925629[/C][/ROW]
[ROW][C]2[/C][C]0.03615469637216[/C][/ROW]
[ROW][C]3[/C][C]0.0446265569011871[/C][/ROW]
[ROW][C]4[/C][C]-0.186089106833341[/C][/ROW]
[ROW][C]5[/C][C]0.226297961239635[/C][/ROW]
[ROW][C]6[/C][C]-0.0918596254917207[/C][/ROW]
[ROW][C]7[/C][C]-0.00481599706283682[/C][/ROW]
[ROW][C]8[/C][C]0.0936302322304799[/C][/ROW]
[ROW][C]9[/C][C]-0.0649799736953284[/C][/ROW]
[ROW][C]10[/C][C]-0.0779877378137613[/C][/ROW]
[ROW][C]11[/C][C]0.0923595070518393[/C][/ROW]
[ROW][C]12[/C][C]-0.120299290767814[/C][/ROW]
[ROW][C]13[/C][C]0.097026801557467[/C][/ROW]
[ROW][C]14[/C][C]0.099794064198851[/C][/ROW]
[ROW][C]15[/C][C]-0.196306843185429[/C][/ROW]
[ROW][C]16[/C][C]0.0270305103821497[/C][/ROW]
[ROW][C]17[/C][C]0.074435427130482[/C][/ROW]
[/TABLE]
Source: https://freestatistics.org/blog/index.php?pk=28349&T=1

Globally Unique Identifier (entire table): ba.freestatistics.org/blog/index.php?pk=28349&T=1

As an alternative you can also use a QR Code:  

The GUIDs for individual cells are displayed in the table below:

Cross Correlation Function
ParameterValue
Box-Cox transformation parameter (lambda) of X series1
Degree of non-seasonal differencing (d) of X series1
Degree of seasonal differencing (D) of X series1
Seasonal Period (s)1
Box-Cox transformation parameter (lambda) of Y series1
Degree of non-seasonal differencing (d) of Y series1
Degree of seasonal differencing (D) of Y series1
krho(Y[t],X[t+k])
-17-0.165075247764858
-160.00413297990134462
-150.130592995419918
-14-0.110919932457885
-130.125803695063513
-12-0.0840536607210104
-11-0.0088328050730069
-10-0.0421476947844029
-90.107740741538621
-8-0.115336113050273
-7-0.00619103597563874
-60.161289325047140
-5-0.130226216916337
-40.0575829568100946
-3-0.0084921525624198
-2-0.0147942874208852
-10.0037334170813138
0-0.0157024827404370
1-0.0252973804925629
20.03615469637216
30.0446265569011871
4-0.186089106833341
50.226297961239635
6-0.0918596254917207
7-0.00481599706283682
80.0936302322304799
9-0.0649799736953284
10-0.0779877378137613
110.0923595070518393
12-0.120299290767814
130.097026801557467
140.099794064198851
15-0.196306843185429
160.0270305103821497
170.074435427130482


Parameters (Session):
par1 = 1 ; par2 = 1 ; par3 = 1 ; par4 = 1 ; par5 = 1 ; par6 = 1 ; par7 = 1 ;
Parameters (R input):
par1 = 1 ; par2 = 1 ; par3 = 1 ; par4 = 1 ; par5 = 1 ; par6 = 1 ; par7 = 1 ;
R code (references can be found in the software module):
par1 <- as.numeric(par1)
par2 <- as.numeric(par2)
par3 <- as.numeric(par3)
par4 <- as.numeric(par4)
par5 <- as.numeric(par5)
par6 <- as.numeric(par6)
par7 <- as.numeric(par7)
if (par1 == 0) {
x <- log(x)
} else {
x <- (x ^ par1 - 1) / par1
}
if (par5 == 0) {
y <- log(y)
} else {
y <- (y ^ par5 - 1) / par5
}
if (par2 > 0) x <- diff(x,lag=1,difference=par2)
if (par6 > 0) y <- diff(y,lag=1,difference=par6)
if (par3 > 0) x <- diff(x,lag=par4,difference=par3)
if (par7 > 0) y <- diff(y,lag=par4,difference=par7)
x
y
bitmap(file='test1.png')
(r <- ccf(x,y,main='Cross Correlation Function',ylab='CCF',xlab='Lag (k)'))
dev.off()
load(file='createtable')
a<-table.start()
a<-table.row.start(a)
a<-table.element(a,'Cross Correlation Function',2,TRUE)
a<-table.row.end(a)
a<-table.row.start(a)
a<-table.element(a,'Parameter',header=TRUE)
a<-table.element(a,'Value',header=TRUE)
a<-table.row.end(a)
a<-table.row.start(a)
a<-table.element(a,'Box-Cox transformation parameter (lambda) of X series',header=TRUE)
a<-table.element(a,par1)
a<-table.row.end(a)
a<-table.row.start(a)
a<-table.element(a,'Degree of non-seasonal differencing (d) of X series',header=TRUE)
a<-table.element(a,par2)
a<-table.row.end(a)
a<-table.row.start(a)
a<-table.element(a,'Degree of seasonal differencing (D) of X series',header=TRUE)
a<-table.element(a,par3)
a<-table.row.end(a)
a<-table.row.start(a)
a<-table.element(a,'Seasonal Period (s)',header=TRUE)
a<-table.element(a,par4)
a<-table.row.end(a)
a<-table.row.start(a)
a<-table.element(a,'Box-Cox transformation parameter (lambda) of Y series',header=TRUE)
a<-table.element(a,par5)
a<-table.row.end(a)
a<-table.row.start(a)
a<-table.element(a,'Degree of non-seasonal differencing (d) of Y series',header=TRUE)
a<-table.element(a,par6)
a<-table.row.end(a)
a<-table.row.start(a)
a<-table.element(a,'Degree of seasonal differencing (D) of Y series',header=TRUE)
a<-table.element(a,par7)
a<-table.row.end(a)
a<-table.row.start(a)
a<-table.element(a,'k',header=TRUE)
a<-table.element(a,'rho(Y[t],X[t+k])',header=TRUE)
a<-table.row.end(a)
mylength <- length(r$acf)
myhalf <- floor((mylength-1)/2)
for (i in 1:mylength) {
a<-table.row.start(a)
a<-table.element(a,i-myhalf-1,header=TRUE)
a<-table.element(a,r$acf[i])
a<-table.row.end(a)
}
a<-table.end(a)
table.save(a,file='mytable.tab')