Free Statistics

of Irreproducible Research!

Author's title

Author*The author of this computation has been verified*
R Software Modulerwasp_autocorrelation.wasp
Title produced by software(Partial) Autocorrelation Function
Date of computationTue, 02 Dec 2008 13:02:32 -0700
Cite this page as followsStatistical Computations at FreeStatistics.org, Office for Research Development and Education, URL https://freestatistics.org/blog/index.php?v=date/2008/Dec/02/t1228248211gx3nlyrmpm2aex7.htm/, Retrieved Fri, 17 May 2024 02:40:12 +0000
Statistical Computations at FreeStatistics.org, Office for Research Development and Education, URL https://freestatistics.org/blog/index.php?pk=28318, Retrieved Fri, 17 May 2024 02:40:12 +0000
QR Codes:

Original text written by user:
IsPrivate?No (this computation is public)
User-defined keywords
Estimated Impact158
Family? (F = Feedback message, R = changed R code, M = changed R Module, P = changed Parameters, D = changed Data)
-     [Standard Deviation-Mean Plot] [nsts Q8] [2008-12-02 19:40:41] [3a9fc6d5b5e0e816787b7dbace57e7cd]
F RMPD  [(Partial) Autocorrelation Function] [nsts Q8] [2008-12-02 19:45:13] [3a9fc6d5b5e0e816787b7dbace57e7cd]
F RMPD    [Standard Deviation-Mean Plot] [nsts Q8] [2008-12-02 19:54:11] [3a9fc6d5b5e0e816787b7dbace57e7cd]
F RMPD      [(Partial) Autocorrelation Function] [nsts Q8] [2008-12-02 19:58:11] [3a9fc6d5b5e0e816787b7dbace57e7cd]
F   P           [(Partial) Autocorrelation Function] [nsts Q8] [2008-12-02 20:02:32] [821c4b3d195be8e737cf8c9dc649d3cf] [Current]
Feedback Forum
2008-12-09 23:35:16 [Gert-Jan Geudens] [reply
Correct. We bekomen inderdaad een stationaire reeks. Meer kunnen we hier niet aan toevoegen.

Post a new message
Dataseries X:
377.2
332.2
364.8
352.4
341.6
298.2
355.3
330.9
314.5
418.9
433.2
367
422.9
352.1
419.8
432.7
414.2
387.7
297.2
357.4
384.2
425.2
385.3
355.4
409.8
421.2
421.8
464.2
494
404.2
411.4
403.4
403.3
520.9
439.8
434.8
476.5
454.3
522
498.4
439.9
450.7
447.1
451.3
466.8
498
533.6
451.9
477.1
410.4
469.5
485.4
406.7
439.7
412.2
440.2
411.1
477.7
463.2
320.5


Summary of computational transaction
Raw Inputview raw input (R code)
Raw Outputview raw output of R engine
Computing time1 seconds
R Server'Sir Ronald Aylmer Fisher' @ 193.190.124.24

\begin{tabular}{lllllllll}
\hline
Summary of computational transaction \tabularnewline
Raw Input & view raw input (R code)  \tabularnewline
Raw Output & view raw output of R engine  \tabularnewline
Computing time & 1 seconds \tabularnewline
R Server & 'Sir Ronald Aylmer Fisher' @ 193.190.124.24 \tabularnewline
\hline
\end{tabular}
%Source: https://freestatistics.org/blog/index.php?pk=28318&T=0

[TABLE]
[ROW][C]Summary of computational transaction[/C][/ROW]
[ROW][C]Raw Input[/C][C]view raw input (R code) [/C][/ROW]
[ROW][C]Raw Output[/C][C]view raw output of R engine [/C][/ROW]
[ROW][C]Computing time[/C][C]1 seconds[/C][/ROW]
[ROW][C]R Server[/C][C]'Sir Ronald Aylmer Fisher' @ 193.190.124.24[/C][/ROW]
[/TABLE]
Source: https://freestatistics.org/blog/index.php?pk=28318&T=0

Globally Unique Identifier (entire table): ba.freestatistics.org/blog/index.php?pk=28318&T=0

As an alternative you can also use a QR Code:  

The GUIDs for individual cells are displayed in the table below:

Summary of computational transaction
Raw Inputview raw input (R code)
Raw Outputview raw output of R engine
Computing time1 seconds
R Server'Sir Ronald Aylmer Fisher' @ 193.190.124.24


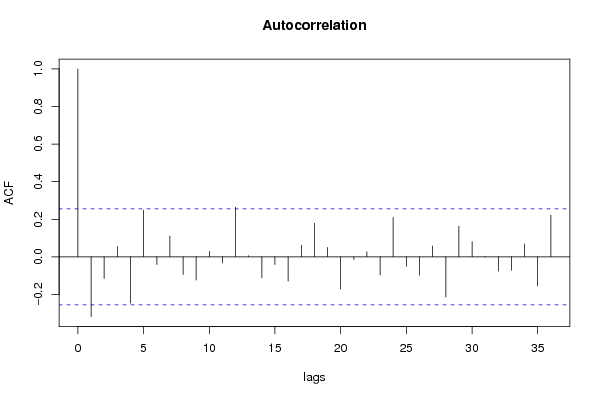
Autocorrelation Function
Time lag kACF(k)T-STATP-value
1-0.318258-2.44460.008754
2-0.114751-0.88140.190834
30.0545680.41910.338317
4-0.246432-1.89290.031641
50.2484361.90830.030612
6-0.04016-0.30850.379404
70.1105970.84950.199514
8-0.094399-0.72510.235631
9-0.123204-0.94640.173915
100.0285480.21930.413594
11-0.03251-0.24970.401838
120.2640372.02810.023536
130.0059160.04540.481954
14-0.111762-0.85850.197057
15-0.040861-0.31390.377367
16-0.128744-0.98890.163374
170.061810.47480.318351
180.1783721.37010.087923
190.0497520.38220.35186
20-0.171121-1.31440.096899
21-0.014434-0.11090.456047
220.0267860.20580.418847
23-0.09711-0.74590.229339
240.2098921.61220.056127
25-0.050276-0.38620.350377
26-0.097334-0.74760.228823
270.0582360.44730.32814
28-0.213375-1.6390.053271
290.1624391.24770.108531
300.0802930.61670.269889
310.0007510.00580.497707
32-0.075532-0.58020.282004
33-0.071067-0.54590.293605
340.0686520.52730.299972
35-0.154758-1.18870.119657
360.22171.70290.046924

\begin{tabular}{lllllllll}
\hline
Autocorrelation Function \tabularnewline
Time lag k & ACF(k) & T-STAT & P-value \tabularnewline
1 & -0.318258 & -2.4446 & 0.008754 \tabularnewline
2 & -0.114751 & -0.8814 & 0.190834 \tabularnewline
3 & 0.054568 & 0.4191 & 0.338317 \tabularnewline
4 & -0.246432 & -1.8929 & 0.031641 \tabularnewline
5 & 0.248436 & 1.9083 & 0.030612 \tabularnewline
6 & -0.04016 & -0.3085 & 0.379404 \tabularnewline
7 & 0.110597 & 0.8495 & 0.199514 \tabularnewline
8 & -0.094399 & -0.7251 & 0.235631 \tabularnewline
9 & -0.123204 & -0.9464 & 0.173915 \tabularnewline
10 & 0.028548 & 0.2193 & 0.413594 \tabularnewline
11 & -0.03251 & -0.2497 & 0.401838 \tabularnewline
12 & 0.264037 & 2.0281 & 0.023536 \tabularnewline
13 & 0.005916 & 0.0454 & 0.481954 \tabularnewline
14 & -0.111762 & -0.8585 & 0.197057 \tabularnewline
15 & -0.040861 & -0.3139 & 0.377367 \tabularnewline
16 & -0.128744 & -0.9889 & 0.163374 \tabularnewline
17 & 0.06181 & 0.4748 & 0.318351 \tabularnewline
18 & 0.178372 & 1.3701 & 0.087923 \tabularnewline
19 & 0.049752 & 0.3822 & 0.35186 \tabularnewline
20 & -0.171121 & -1.3144 & 0.096899 \tabularnewline
21 & -0.014434 & -0.1109 & 0.456047 \tabularnewline
22 & 0.026786 & 0.2058 & 0.418847 \tabularnewline
23 & -0.09711 & -0.7459 & 0.229339 \tabularnewline
24 & 0.209892 & 1.6122 & 0.056127 \tabularnewline
25 & -0.050276 & -0.3862 & 0.350377 \tabularnewline
26 & -0.097334 & -0.7476 & 0.228823 \tabularnewline
27 & 0.058236 & 0.4473 & 0.32814 \tabularnewline
28 & -0.213375 & -1.639 & 0.053271 \tabularnewline
29 & 0.162439 & 1.2477 & 0.108531 \tabularnewline
30 & 0.080293 & 0.6167 & 0.269889 \tabularnewline
31 & 0.000751 & 0.0058 & 0.497707 \tabularnewline
32 & -0.075532 & -0.5802 & 0.282004 \tabularnewline
33 & -0.071067 & -0.5459 & 0.293605 \tabularnewline
34 & 0.068652 & 0.5273 & 0.299972 \tabularnewline
35 & -0.154758 & -1.1887 & 0.119657 \tabularnewline
36 & 0.2217 & 1.7029 & 0.046924 \tabularnewline
\hline
\end{tabular}
%Source: https://freestatistics.org/blog/index.php?pk=28318&T=1

[TABLE]
[ROW][C]Autocorrelation Function[/C][/ROW]
[ROW][C]Time lag k[/C][C]ACF(k)[/C][C]T-STAT[/C][C]P-value[/C][/ROW]
[ROW][C]1[/C][C]-0.318258[/C][C]-2.4446[/C][C]0.008754[/C][/ROW]
[ROW][C]2[/C][C]-0.114751[/C][C]-0.8814[/C][C]0.190834[/C][/ROW]
[ROW][C]3[/C][C]0.054568[/C][C]0.4191[/C][C]0.338317[/C][/ROW]
[ROW][C]4[/C][C]-0.246432[/C][C]-1.8929[/C][C]0.031641[/C][/ROW]
[ROW][C]5[/C][C]0.248436[/C][C]1.9083[/C][C]0.030612[/C][/ROW]
[ROW][C]6[/C][C]-0.04016[/C][C]-0.3085[/C][C]0.379404[/C][/ROW]
[ROW][C]7[/C][C]0.110597[/C][C]0.8495[/C][C]0.199514[/C][/ROW]
[ROW][C]8[/C][C]-0.094399[/C][C]-0.7251[/C][C]0.235631[/C][/ROW]
[ROW][C]9[/C][C]-0.123204[/C][C]-0.9464[/C][C]0.173915[/C][/ROW]
[ROW][C]10[/C][C]0.028548[/C][C]0.2193[/C][C]0.413594[/C][/ROW]
[ROW][C]11[/C][C]-0.03251[/C][C]-0.2497[/C][C]0.401838[/C][/ROW]
[ROW][C]12[/C][C]0.264037[/C][C]2.0281[/C][C]0.023536[/C][/ROW]
[ROW][C]13[/C][C]0.005916[/C][C]0.0454[/C][C]0.481954[/C][/ROW]
[ROW][C]14[/C][C]-0.111762[/C][C]-0.8585[/C][C]0.197057[/C][/ROW]
[ROW][C]15[/C][C]-0.040861[/C][C]-0.3139[/C][C]0.377367[/C][/ROW]
[ROW][C]16[/C][C]-0.128744[/C][C]-0.9889[/C][C]0.163374[/C][/ROW]
[ROW][C]17[/C][C]0.06181[/C][C]0.4748[/C][C]0.318351[/C][/ROW]
[ROW][C]18[/C][C]0.178372[/C][C]1.3701[/C][C]0.087923[/C][/ROW]
[ROW][C]19[/C][C]0.049752[/C][C]0.3822[/C][C]0.35186[/C][/ROW]
[ROW][C]20[/C][C]-0.171121[/C][C]-1.3144[/C][C]0.096899[/C][/ROW]
[ROW][C]21[/C][C]-0.014434[/C][C]-0.1109[/C][C]0.456047[/C][/ROW]
[ROW][C]22[/C][C]0.026786[/C][C]0.2058[/C][C]0.418847[/C][/ROW]
[ROW][C]23[/C][C]-0.09711[/C][C]-0.7459[/C][C]0.229339[/C][/ROW]
[ROW][C]24[/C][C]0.209892[/C][C]1.6122[/C][C]0.056127[/C][/ROW]
[ROW][C]25[/C][C]-0.050276[/C][C]-0.3862[/C][C]0.350377[/C][/ROW]
[ROW][C]26[/C][C]-0.097334[/C][C]-0.7476[/C][C]0.228823[/C][/ROW]
[ROW][C]27[/C][C]0.058236[/C][C]0.4473[/C][C]0.32814[/C][/ROW]
[ROW][C]28[/C][C]-0.213375[/C][C]-1.639[/C][C]0.053271[/C][/ROW]
[ROW][C]29[/C][C]0.162439[/C][C]1.2477[/C][C]0.108531[/C][/ROW]
[ROW][C]30[/C][C]0.080293[/C][C]0.6167[/C][C]0.269889[/C][/ROW]
[ROW][C]31[/C][C]0.000751[/C][C]0.0058[/C][C]0.497707[/C][/ROW]
[ROW][C]32[/C][C]-0.075532[/C][C]-0.5802[/C][C]0.282004[/C][/ROW]
[ROW][C]33[/C][C]-0.071067[/C][C]-0.5459[/C][C]0.293605[/C][/ROW]
[ROW][C]34[/C][C]0.068652[/C][C]0.5273[/C][C]0.299972[/C][/ROW]
[ROW][C]35[/C][C]-0.154758[/C][C]-1.1887[/C][C]0.119657[/C][/ROW]
[ROW][C]36[/C][C]0.2217[/C][C]1.7029[/C][C]0.046924[/C][/ROW]
[/TABLE]
Source: https://freestatistics.org/blog/index.php?pk=28318&T=1

Globally Unique Identifier (entire table): ba.freestatistics.org/blog/index.php?pk=28318&T=1

As an alternative you can also use a QR Code:  

The GUIDs for individual cells are displayed in the table below:

Autocorrelation Function
Time lag kACF(k)T-STATP-value
1-0.318258-2.44460.008754
2-0.114751-0.88140.190834
30.0545680.41910.338317
4-0.246432-1.89290.031641
50.2484361.90830.030612
6-0.04016-0.30850.379404
70.1105970.84950.199514
8-0.094399-0.72510.235631
9-0.123204-0.94640.173915
100.0285480.21930.413594
11-0.03251-0.24970.401838
120.2640372.02810.023536
130.0059160.04540.481954
14-0.111762-0.85850.197057
15-0.040861-0.31390.377367
16-0.128744-0.98890.163374
170.061810.47480.318351
180.1783721.37010.087923
190.0497520.38220.35186
20-0.171121-1.31440.096899
21-0.014434-0.11090.456047
220.0267860.20580.418847
23-0.09711-0.74590.229339
240.2098921.61220.056127
25-0.050276-0.38620.350377
26-0.097334-0.74760.228823
270.0582360.44730.32814
28-0.213375-1.6390.053271
290.1624391.24770.108531
300.0802930.61670.269889
310.0007510.00580.497707
32-0.075532-0.58020.282004
33-0.071067-0.54590.293605
340.0686520.52730.299972
35-0.154758-1.18870.119657
360.22171.70290.046924


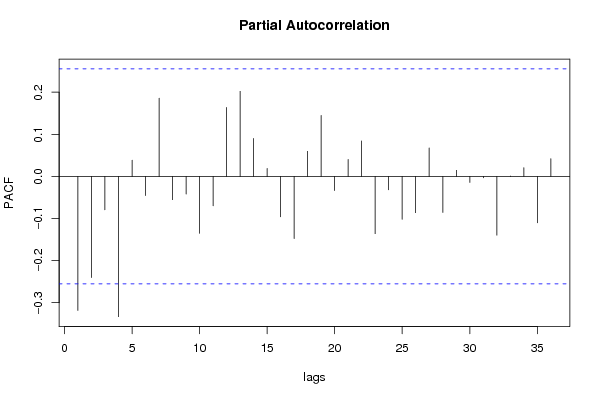
Partial Autocorrelation Function
Time lag kPACF(k)T-STATP-value
1-0.318258-2.44460.008754
2-0.240388-1.84650.034922
3-0.079403-0.60990.272132
4-0.333121-2.55870.006545
50.0384320.29520.384437
6-0.045683-0.35090.363458
70.1856421.42590.079577
8-0.055187-0.42390.336589
9-0.041724-0.32050.374866
10-0.134995-1.03690.152004
11-0.070001-0.53770.296406
120.1637791.2580.106672
130.2021.55160.063054
140.0902780.69340.245378
150.0189250.14540.44246
16-0.095943-0.7370.232035
17-0.147587-1.13360.130766
180.0594180.45640.32489
190.1448221.11240.13524
20-0.0337-0.25890.398324
210.0403750.31010.378779
220.0841990.64670.260152
23-0.136034-1.04490.150167
24-0.03186-0.24470.403759
25-0.101957-0.78310.218336
26-0.086119-0.66150.255435
270.0672690.51670.303648
28-0.085526-0.65690.256887
290.0143270.110.456374
30-0.014222-0.10920.456692
31-0.003528-0.02710.489236
32-0.139523-1.07170.144111
330.0007450.00570.497726
340.0203750.15650.438084
35-0.110401-0.8480.19993
360.0418640.32160.374459

\begin{tabular}{lllllllll}
\hline
Partial Autocorrelation Function \tabularnewline
Time lag k & PACF(k) & T-STAT & P-value \tabularnewline
1 & -0.318258 & -2.4446 & 0.008754 \tabularnewline
2 & -0.240388 & -1.8465 & 0.034922 \tabularnewline
3 & -0.079403 & -0.6099 & 0.272132 \tabularnewline
4 & -0.333121 & -2.5587 & 0.006545 \tabularnewline
5 & 0.038432 & 0.2952 & 0.384437 \tabularnewline
6 & -0.045683 & -0.3509 & 0.363458 \tabularnewline
7 & 0.185642 & 1.4259 & 0.079577 \tabularnewline
8 & -0.055187 & -0.4239 & 0.336589 \tabularnewline
9 & -0.041724 & -0.3205 & 0.374866 \tabularnewline
10 & -0.134995 & -1.0369 & 0.152004 \tabularnewline
11 & -0.070001 & -0.5377 & 0.296406 \tabularnewline
12 & 0.163779 & 1.258 & 0.106672 \tabularnewline
13 & 0.202 & 1.5516 & 0.063054 \tabularnewline
14 & 0.090278 & 0.6934 & 0.245378 \tabularnewline
15 & 0.018925 & 0.1454 & 0.44246 \tabularnewline
16 & -0.095943 & -0.737 & 0.232035 \tabularnewline
17 & -0.147587 & -1.1336 & 0.130766 \tabularnewline
18 & 0.059418 & 0.4564 & 0.32489 \tabularnewline
19 & 0.144822 & 1.1124 & 0.13524 \tabularnewline
20 & -0.0337 & -0.2589 & 0.398324 \tabularnewline
21 & 0.040375 & 0.3101 & 0.378779 \tabularnewline
22 & 0.084199 & 0.6467 & 0.260152 \tabularnewline
23 & -0.136034 & -1.0449 & 0.150167 \tabularnewline
24 & -0.03186 & -0.2447 & 0.403759 \tabularnewline
25 & -0.101957 & -0.7831 & 0.218336 \tabularnewline
26 & -0.086119 & -0.6615 & 0.255435 \tabularnewline
27 & 0.067269 & 0.5167 & 0.303648 \tabularnewline
28 & -0.085526 & -0.6569 & 0.256887 \tabularnewline
29 & 0.014327 & 0.11 & 0.456374 \tabularnewline
30 & -0.014222 & -0.1092 & 0.456692 \tabularnewline
31 & -0.003528 & -0.0271 & 0.489236 \tabularnewline
32 & -0.139523 & -1.0717 & 0.144111 \tabularnewline
33 & 0.000745 & 0.0057 & 0.497726 \tabularnewline
34 & 0.020375 & 0.1565 & 0.438084 \tabularnewline
35 & -0.110401 & -0.848 & 0.19993 \tabularnewline
36 & 0.041864 & 0.3216 & 0.374459 \tabularnewline
\hline
\end{tabular}
%Source: https://freestatistics.org/blog/index.php?pk=28318&T=2

[TABLE]
[ROW][C]Partial Autocorrelation Function[/C][/ROW]
[ROW][C]Time lag k[/C][C]PACF(k)[/C][C]T-STAT[/C][C]P-value[/C][/ROW]
[ROW][C]1[/C][C]-0.318258[/C][C]-2.4446[/C][C]0.008754[/C][/ROW]
[ROW][C]2[/C][C]-0.240388[/C][C]-1.8465[/C][C]0.034922[/C][/ROW]
[ROW][C]3[/C][C]-0.079403[/C][C]-0.6099[/C][C]0.272132[/C][/ROW]
[ROW][C]4[/C][C]-0.333121[/C][C]-2.5587[/C][C]0.006545[/C][/ROW]
[ROW][C]5[/C][C]0.038432[/C][C]0.2952[/C][C]0.384437[/C][/ROW]
[ROW][C]6[/C][C]-0.045683[/C][C]-0.3509[/C][C]0.363458[/C][/ROW]
[ROW][C]7[/C][C]0.185642[/C][C]1.4259[/C][C]0.079577[/C][/ROW]
[ROW][C]8[/C][C]-0.055187[/C][C]-0.4239[/C][C]0.336589[/C][/ROW]
[ROW][C]9[/C][C]-0.041724[/C][C]-0.3205[/C][C]0.374866[/C][/ROW]
[ROW][C]10[/C][C]-0.134995[/C][C]-1.0369[/C][C]0.152004[/C][/ROW]
[ROW][C]11[/C][C]-0.070001[/C][C]-0.5377[/C][C]0.296406[/C][/ROW]
[ROW][C]12[/C][C]0.163779[/C][C]1.258[/C][C]0.106672[/C][/ROW]
[ROW][C]13[/C][C]0.202[/C][C]1.5516[/C][C]0.063054[/C][/ROW]
[ROW][C]14[/C][C]0.090278[/C][C]0.6934[/C][C]0.245378[/C][/ROW]
[ROW][C]15[/C][C]0.018925[/C][C]0.1454[/C][C]0.44246[/C][/ROW]
[ROW][C]16[/C][C]-0.095943[/C][C]-0.737[/C][C]0.232035[/C][/ROW]
[ROW][C]17[/C][C]-0.147587[/C][C]-1.1336[/C][C]0.130766[/C][/ROW]
[ROW][C]18[/C][C]0.059418[/C][C]0.4564[/C][C]0.32489[/C][/ROW]
[ROW][C]19[/C][C]0.144822[/C][C]1.1124[/C][C]0.13524[/C][/ROW]
[ROW][C]20[/C][C]-0.0337[/C][C]-0.2589[/C][C]0.398324[/C][/ROW]
[ROW][C]21[/C][C]0.040375[/C][C]0.3101[/C][C]0.378779[/C][/ROW]
[ROW][C]22[/C][C]0.084199[/C][C]0.6467[/C][C]0.260152[/C][/ROW]
[ROW][C]23[/C][C]-0.136034[/C][C]-1.0449[/C][C]0.150167[/C][/ROW]
[ROW][C]24[/C][C]-0.03186[/C][C]-0.2447[/C][C]0.403759[/C][/ROW]
[ROW][C]25[/C][C]-0.101957[/C][C]-0.7831[/C][C]0.218336[/C][/ROW]
[ROW][C]26[/C][C]-0.086119[/C][C]-0.6615[/C][C]0.255435[/C][/ROW]
[ROW][C]27[/C][C]0.067269[/C][C]0.5167[/C][C]0.303648[/C][/ROW]
[ROW][C]28[/C][C]-0.085526[/C][C]-0.6569[/C][C]0.256887[/C][/ROW]
[ROW][C]29[/C][C]0.014327[/C][C]0.11[/C][C]0.456374[/C][/ROW]
[ROW][C]30[/C][C]-0.014222[/C][C]-0.1092[/C][C]0.456692[/C][/ROW]
[ROW][C]31[/C][C]-0.003528[/C][C]-0.0271[/C][C]0.489236[/C][/ROW]
[ROW][C]32[/C][C]-0.139523[/C][C]-1.0717[/C][C]0.144111[/C][/ROW]
[ROW][C]33[/C][C]0.000745[/C][C]0.0057[/C][C]0.497726[/C][/ROW]
[ROW][C]34[/C][C]0.020375[/C][C]0.1565[/C][C]0.438084[/C][/ROW]
[ROW][C]35[/C][C]-0.110401[/C][C]-0.848[/C][C]0.19993[/C][/ROW]
[ROW][C]36[/C][C]0.041864[/C][C]0.3216[/C][C]0.374459[/C][/ROW]
[/TABLE]
Source: https://freestatistics.org/blog/index.php?pk=28318&T=2

Globally Unique Identifier (entire table): ba.freestatistics.org/blog/index.php?pk=28318&T=2

As an alternative you can also use a QR Code:  

The GUIDs for individual cells are displayed in the table below:

Partial Autocorrelation Function
Time lag kPACF(k)T-STATP-value
1-0.318258-2.44460.008754
2-0.240388-1.84650.034922
3-0.079403-0.60990.272132
4-0.333121-2.55870.006545
50.0384320.29520.384437
6-0.045683-0.35090.363458
70.1856421.42590.079577
8-0.055187-0.42390.336589
9-0.041724-0.32050.374866
10-0.134995-1.03690.152004
11-0.070001-0.53770.296406
120.1637791.2580.106672
130.2021.55160.063054
140.0902780.69340.245378
150.0189250.14540.44246
16-0.095943-0.7370.232035
17-0.147587-1.13360.130766
180.0594180.45640.32489
190.1448221.11240.13524
20-0.0337-0.25890.398324
210.0403750.31010.378779
220.0841990.64670.260152
23-0.136034-1.04490.150167
24-0.03186-0.24470.403759
25-0.101957-0.78310.218336
26-0.086119-0.66150.255435
270.0672690.51670.303648
28-0.085526-0.65690.256887
290.0143270.110.456374
30-0.014222-0.10920.456692
31-0.003528-0.02710.489236
32-0.139523-1.07170.144111
330.0007450.00570.497726
340.0203750.15650.438084
35-0.110401-0.8480.19993
360.0418640.32160.374459


Parameters (Session):
par1 = 36 ; par2 = 1 ; par3 = 1 ; par4 = 0 ; par5 = 12 ;
Parameters (R input):
par1 = 36 ; par2 = 1 ; par3 = 1 ; par4 = 0 ; par5 = 12 ;
R code (references can be found in the software module):
if (par1 == 'Default') {
par1 = 10*log10(length(x))
} else {
par1 <- as.numeric(par1)
}
par2 <- as.numeric(par2)
par3 <- as.numeric(par3)
par4 <- as.numeric(par4)
par5 <- as.numeric(par5)
if (par2 == 0) {
x <- log(x)
} else {
x <- (x ^ par2 - 1) / par2
}
if (par3 > 0) x <- diff(x,lag=1,difference=par3)
if (par4 > 0) x <- diff(x,lag=par5,difference=par4)
bitmap(file='pic1.png')
racf <- acf(x,par1,main='Autocorrelation',xlab='lags',ylab='ACF')
dev.off()
bitmap(file='pic2.png')
rpacf <- pacf(x,par1,main='Partial Autocorrelation',xlab='lags',ylab='PACF')
dev.off()
(myacf <- c(racf$acf))
(mypacf <- c(rpacf$acf))
lengthx <- length(x)
sqrtn <- sqrt(lengthx)
load(file='createtable')
a<-table.start()
a<-table.row.start(a)
a<-table.element(a,'Autocorrelation Function',4,TRUE)
a<-table.row.end(a)
a<-table.row.start(a)
a<-table.element(a,'Time lag k',header=TRUE)
a<-table.element(a,hyperlink('basics.htm','ACF(k)','click here for more information about the Autocorrelation Function'),header=TRUE)
a<-table.element(a,'T-STAT',header=TRUE)
a<-table.element(a,'P-value',header=TRUE)
a<-table.row.end(a)
for (i in 2:(par1+1)) {
a<-table.row.start(a)
a<-table.element(a,i-1,header=TRUE)
a<-table.element(a,round(myacf[i],6))
mytstat <- myacf[i]*sqrtn
a<-table.element(a,round(mytstat,4))
a<-table.element(a,round(1-pt(abs(mytstat),lengthx),6))
a<-table.row.end(a)
}
a<-table.end(a)
table.save(a,file='mytable.tab')
a<-table.start()
a<-table.row.start(a)
a<-table.element(a,'Partial Autocorrelation Function',4,TRUE)
a<-table.row.end(a)
a<-table.row.start(a)
a<-table.element(a,'Time lag k',header=TRUE)
a<-table.element(a,hyperlink('basics.htm','PACF(k)','click here for more information about the Partial Autocorrelation Function'),header=TRUE)
a<-table.element(a,'T-STAT',header=TRUE)
a<-table.element(a,'P-value',header=TRUE)
a<-table.row.end(a)
for (i in 1:par1) {
a<-table.row.start(a)
a<-table.element(a,i,header=TRUE)
a<-table.element(a,round(mypacf[i],6))
mytstat <- mypacf[i]*sqrtn
a<-table.element(a,round(mytstat,4))
a<-table.element(a,round(1-pt(abs(mytstat),lengthx),6))
a<-table.row.end(a)
}
a<-table.end(a)
table.save(a,file='mytable1.tab')