Free Statistics

of Irreproducible Research!

Author's title

Author*The author of this computation has been verified*
R Software Modulerwasp_cross.wasp
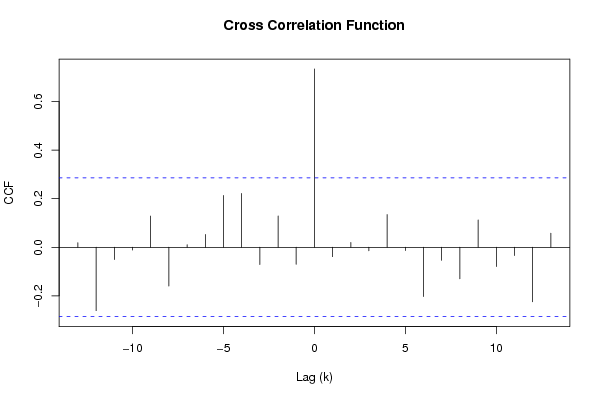
Title produced by softwareCross Correlation Function
Date of computationTue, 02 Dec 2008 11:26:13 -0700
Cite this page as followsStatistical Computations at FreeStatistics.org, Office for Research Development and Education, URL https://freestatistics.org/blog/index.php?v=date/2008/Dec/02/t1228242501iwe5ijspkbldio7.htm/, Retrieved Fri, 17 May 2024 03:40:41 +0000
Statistical Computations at FreeStatistics.org, Office for Research Development and Education, URL https://freestatistics.org/blog/index.php?pk=28221, Retrieved Fri, 17 May 2024 03:40:41 +0000
QR Codes:

Original text written by user:
IsPrivate?No (this computation is public)
User-defined keywordsnon stationary time series vraag 9
Estimated Impact166
Family? (F = Feedback message, R = changed R code, M = changed R Module, P = changed Parameters, D = changed Data)
F     [Univariate Data Series] [Airline data] [2007-10-18 09:58:47] [42daae401fd3def69a25014f2252b4c2]
F RMPD  [Spectral Analysis] [spectral analysis] [2008-12-02 17:36:41] [415d0222c17b651a9576eaac006f530d]
F RMPD      [Cross Correlation Function] [cross correlation] [2008-12-02 18:26:13] [bb7e3816cefc365f4d7adcd50784b783] [Current]
Feedback Forum
2008-12-06 13:48:18 [Ken Wright] [reply
goed, je bent er dus in geslaagd om jou tijdreeks genoeg stationair te maken, adhv de crosscorrelation kan je dus besluiten dat y niet meer verklaard kan worden adhv het verleden van x.
2008-12-09 17:41:39 [Julian De Ruyter] [reply
Je hebt de juiste berekeningen gemaakt om je tijdsreeks stationair te maken.

Post a new message
Dataseries X:
3.253
3.233
3.196
3.138
3.091
3.17
3.378
3.468
3.33
3.413
3.356
3.525
3.633
3.597
3.6
3.522
3.503
3.532
3.686
3.748
3.672
3.843
3.905
3.999
4.07
4.084
4.042
3.951
3.933
3.958
4.147
4.221
4.058
4.057
4.089
4.268
4.309
4.303
4.177
4.117
4.065
3.983
4.091
4.067
4.024
3.868
3.8
3.804
3.862
3.792
3.674
3.56
3.489
3.412
3.674
3.672
3.463
3.429
3.4
3.533
Dataseries Y:
11.836
11.85
11.897
12.082
11.936
11.928
12.646
12.747
12.447
12.445
12.257
12.878
13.69
13.665
13.78
13.608
13.375
13.376
13.918
14.304
13.877
14.543
14.291
14.788
15.241
15.265
15.322
15.175
14.817
14.579
15.247
15.385
14.891
14.766
14.42
14.85
15.117
15.352
15.099
15.291
15.208
14.995
15.454
15.251
14.975
14.005
13.55
13.422
13.848
13.376
13.038
12.974
12.554
11.971
12.916
12.757
11.924
11.693
11.382
11.821


Summary of computational transaction
Raw Inputview raw input (R code)
Raw Outputview raw output of R engine
Computing time2 seconds
R Server'Sir Ronald Aylmer Fisher' @ 193.190.124.24

\begin{tabular}{lllllllll}
\hline
Summary of computational transaction \tabularnewline
Raw Input & view raw input (R code)  \tabularnewline
Raw Output & view raw output of R engine  \tabularnewline
Computing time & 2 seconds \tabularnewline
R Server & 'Sir Ronald Aylmer Fisher' @ 193.190.124.24 \tabularnewline
\hline
\end{tabular}
%Source: https://freestatistics.org/blog/index.php?pk=28221&T=0

[TABLE]
[ROW][C]Summary of computational transaction[/C][/ROW]
[ROW][C]Raw Input[/C][C]view raw input (R code) [/C][/ROW]
[ROW][C]Raw Output[/C][C]view raw output of R engine [/C][/ROW]
[ROW][C]Computing time[/C][C]2 seconds[/C][/ROW]
[ROW][C]R Server[/C][C]'Sir Ronald Aylmer Fisher' @ 193.190.124.24[/C][/ROW]
[/TABLE]
Source: https://freestatistics.org/blog/index.php?pk=28221&T=0

Globally Unique Identifier (entire table): ba.freestatistics.org/blog/index.php?pk=28221&T=0

As an alternative you can also use a QR Code:  

The GUIDs for individual cells are displayed in the table below:

Summary of computational transaction
Raw Inputview raw input (R code)
Raw Outputview raw output of R engine
Computing time2 seconds
R Server'Sir Ronald Aylmer Fisher' @ 193.190.124.24


Cross Correlation Function
ParameterValue
Box-Cox transformation parameter (lambda) of X series1
Degree of non-seasonal differencing (d) of X series1
Degree of seasonal differencing (D) of X series1
Seasonal Period (s)12
Box-Cox transformation parameter (lambda) of Y series1
Degree of non-seasonal differencing (d) of Y series1
Degree of seasonal differencing (D) of Y series1
krho(Y[t],X[t+k])
-130.0189101238967055
-12-0.261084007947697
-11-0.0502617856139425
-10-0.0112934012505849
-90.12857523889734
-8-0.159389187497181
-70.0102358219761476
-60.0525221473773168
-50.213576446526555
-40.222097305469736
-3-0.0711036397387453
-20.128791451580165
-1-0.070300112631788
00.734874209001173
1-0.0385256697138638
20.0198611288058817
3-0.0144052818922642
40.134754099906046
5-0.0135498980994487
6-0.203196971433377
7-0.0536665542177785
8-0.129904511079031
90.112251894961616
10-0.0790639349460913
11-0.0339310829737729
12-0.224383866308515
130.05769398831114

\begin{tabular}{lllllllll}
\hline
Cross Correlation Function \tabularnewline
Parameter & Value \tabularnewline
Box-Cox transformation parameter (lambda) of X series & 1 \tabularnewline
Degree of non-seasonal differencing (d) of X series & 1 \tabularnewline
Degree of seasonal differencing (D) of X series & 1 \tabularnewline
Seasonal Period (s) & 12 \tabularnewline
Box-Cox transformation parameter (lambda) of Y series & 1 \tabularnewline
Degree of non-seasonal differencing (d) of Y series & 1 \tabularnewline
Degree of seasonal differencing (D) of Y series & 1 \tabularnewline
k & rho(Y[t],X[t+k]) \tabularnewline
-13 & 0.0189101238967055 \tabularnewline
-12 & -0.261084007947697 \tabularnewline
-11 & -0.0502617856139425 \tabularnewline
-10 & -0.0112934012505849 \tabularnewline
-9 & 0.12857523889734 \tabularnewline
-8 & -0.159389187497181 \tabularnewline
-7 & 0.0102358219761476 \tabularnewline
-6 & 0.0525221473773168 \tabularnewline
-5 & 0.213576446526555 \tabularnewline
-4 & 0.222097305469736 \tabularnewline
-3 & -0.0711036397387453 \tabularnewline
-2 & 0.128791451580165 \tabularnewline
-1 & -0.070300112631788 \tabularnewline
0 & 0.734874209001173 \tabularnewline
1 & -0.0385256697138638 \tabularnewline
2 & 0.0198611288058817 \tabularnewline
3 & -0.0144052818922642 \tabularnewline
4 & 0.134754099906046 \tabularnewline
5 & -0.0135498980994487 \tabularnewline
6 & -0.203196971433377 \tabularnewline
7 & -0.0536665542177785 \tabularnewline
8 & -0.129904511079031 \tabularnewline
9 & 0.112251894961616 \tabularnewline
10 & -0.0790639349460913 \tabularnewline
11 & -0.0339310829737729 \tabularnewline
12 & -0.224383866308515 \tabularnewline
13 & 0.05769398831114 \tabularnewline
\hline
\end{tabular}
%Source: https://freestatistics.org/blog/index.php?pk=28221&T=1

[TABLE]
[ROW][C]Cross Correlation Function[/C][/ROW]
[ROW][C]Parameter[/C][C]Value[/C][/ROW]
[ROW][C]Box-Cox transformation parameter (lambda) of X series[/C][C]1[/C][/ROW]
[ROW][C]Degree of non-seasonal differencing (d) of X series[/C][C]1[/C][/ROW]
[ROW][C]Degree of seasonal differencing (D) of X series[/C][C]1[/C][/ROW]
[ROW][C]Seasonal Period (s)[/C][C]12[/C][/ROW]
[ROW][C]Box-Cox transformation parameter (lambda) of Y series[/C][C]1[/C][/ROW]
[ROW][C]Degree of non-seasonal differencing (d) of Y series[/C][C]1[/C][/ROW]
[ROW][C]Degree of seasonal differencing (D) of Y series[/C][C]1[/C][/ROW]
[ROW][C]k[/C][C]rho(Y[t],X[t+k])[/C][/ROW]
[ROW][C]-13[/C][C]0.0189101238967055[/C][/ROW]
[ROW][C]-12[/C][C]-0.261084007947697[/C][/ROW]
[ROW][C]-11[/C][C]-0.0502617856139425[/C][/ROW]
[ROW][C]-10[/C][C]-0.0112934012505849[/C][/ROW]
[ROW][C]-9[/C][C]0.12857523889734[/C][/ROW]
[ROW][C]-8[/C][C]-0.159389187497181[/C][/ROW]
[ROW][C]-7[/C][C]0.0102358219761476[/C][/ROW]
[ROW][C]-6[/C][C]0.0525221473773168[/C][/ROW]
[ROW][C]-5[/C][C]0.213576446526555[/C][/ROW]
[ROW][C]-4[/C][C]0.222097305469736[/C][/ROW]
[ROW][C]-3[/C][C]-0.0711036397387453[/C][/ROW]
[ROW][C]-2[/C][C]0.128791451580165[/C][/ROW]
[ROW][C]-1[/C][C]-0.070300112631788[/C][/ROW]
[ROW][C]0[/C][C]0.734874209001173[/C][/ROW]
[ROW][C]1[/C][C]-0.0385256697138638[/C][/ROW]
[ROW][C]2[/C][C]0.0198611288058817[/C][/ROW]
[ROW][C]3[/C][C]-0.0144052818922642[/C][/ROW]
[ROW][C]4[/C][C]0.134754099906046[/C][/ROW]
[ROW][C]5[/C][C]-0.0135498980994487[/C][/ROW]
[ROW][C]6[/C][C]-0.203196971433377[/C][/ROW]
[ROW][C]7[/C][C]-0.0536665542177785[/C][/ROW]
[ROW][C]8[/C][C]-0.129904511079031[/C][/ROW]
[ROW][C]9[/C][C]0.112251894961616[/C][/ROW]
[ROW][C]10[/C][C]-0.0790639349460913[/C][/ROW]
[ROW][C]11[/C][C]-0.0339310829737729[/C][/ROW]
[ROW][C]12[/C][C]-0.224383866308515[/C][/ROW]
[ROW][C]13[/C][C]0.05769398831114[/C][/ROW]
[/TABLE]
Source: https://freestatistics.org/blog/index.php?pk=28221&T=1

Globally Unique Identifier (entire table): ba.freestatistics.org/blog/index.php?pk=28221&T=1

As an alternative you can also use a QR Code:  

The GUIDs for individual cells are displayed in the table below:

Cross Correlation Function
ParameterValue
Box-Cox transformation parameter (lambda) of X series1
Degree of non-seasonal differencing (d) of X series1
Degree of seasonal differencing (D) of X series1
Seasonal Period (s)12
Box-Cox transformation parameter (lambda) of Y series1
Degree of non-seasonal differencing (d) of Y series1
Degree of seasonal differencing (D) of Y series1
krho(Y[t],X[t+k])
-130.0189101238967055
-12-0.261084007947697
-11-0.0502617856139425
-10-0.0112934012505849
-90.12857523889734
-8-0.159389187497181
-70.0102358219761476
-60.0525221473773168
-50.213576446526555
-40.222097305469736
-3-0.0711036397387453
-20.128791451580165
-1-0.070300112631788
00.734874209001173
1-0.0385256697138638
20.0198611288058817
3-0.0144052818922642
40.134754099906046
5-0.0135498980994487
6-0.203196971433377
7-0.0536665542177785
8-0.129904511079031
90.112251894961616
10-0.0790639349460913
11-0.0339310829737729
12-0.224383866308515
130.05769398831114


Parameters (Session):
par1 = 36 ; par2 = 1 ; par3 = 0 ; par4 = 0 ; par5 = 12 ;
Parameters (R input):
par1 = 1 ; par2 = 1 ; par3 = 1 ; par4 = 12 ; par5 = 1 ; par6 = 1 ; par7 = 1 ;
R code (references can be found in the software module):
par1 <- as.numeric(par1)
par2 <- as.numeric(par2)
par3 <- as.numeric(par3)
par4 <- as.numeric(par4)
par5 <- as.numeric(par5)
par6 <- as.numeric(par6)
par7 <- as.numeric(par7)
if (par1 == 0) {
x <- log(x)
} else {
x <- (x ^ par1 - 1) / par1
}
if (par5 == 0) {
y <- log(y)
} else {
y <- (y ^ par5 - 1) / par5
}
if (par2 > 0) x <- diff(x,lag=1,difference=par2)
if (par6 > 0) y <- diff(y,lag=1,difference=par6)
if (par3 > 0) x <- diff(x,lag=par4,difference=par3)
if (par7 > 0) y <- diff(y,lag=par4,difference=par7)
x
y
bitmap(file='test1.png')
(r <- ccf(x,y,main='Cross Correlation Function',ylab='CCF',xlab='Lag (k)'))
dev.off()
load(file='createtable')
a<-table.start()
a<-table.row.start(a)
a<-table.element(a,'Cross Correlation Function',2,TRUE)
a<-table.row.end(a)
a<-table.row.start(a)
a<-table.element(a,'Parameter',header=TRUE)
a<-table.element(a,'Value',header=TRUE)
a<-table.row.end(a)
a<-table.row.start(a)
a<-table.element(a,'Box-Cox transformation parameter (lambda) of X series',header=TRUE)
a<-table.element(a,par1)
a<-table.row.end(a)
a<-table.row.start(a)
a<-table.element(a,'Degree of non-seasonal differencing (d) of X series',header=TRUE)
a<-table.element(a,par2)
a<-table.row.end(a)
a<-table.row.start(a)
a<-table.element(a,'Degree of seasonal differencing (D) of X series',header=TRUE)
a<-table.element(a,par3)
a<-table.row.end(a)
a<-table.row.start(a)
a<-table.element(a,'Seasonal Period (s)',header=TRUE)
a<-table.element(a,par4)
a<-table.row.end(a)
a<-table.row.start(a)
a<-table.element(a,'Box-Cox transformation parameter (lambda) of Y series',header=TRUE)
a<-table.element(a,par5)
a<-table.row.end(a)
a<-table.row.start(a)
a<-table.element(a,'Degree of non-seasonal differencing (d) of Y series',header=TRUE)
a<-table.element(a,par6)
a<-table.row.end(a)
a<-table.row.start(a)
a<-table.element(a,'Degree of seasonal differencing (D) of Y series',header=TRUE)
a<-table.element(a,par7)
a<-table.row.end(a)
a<-table.row.start(a)
a<-table.element(a,'k',header=TRUE)
a<-table.element(a,'rho(Y[t],X[t+k])',header=TRUE)
a<-table.row.end(a)
mylength <- length(r$acf)
myhalf <- floor((mylength-1)/2)
for (i in 1:mylength) {
a<-table.row.start(a)
a<-table.element(a,i-myhalf-1,header=TRUE)
a<-table.element(a,r$acf[i])
a<-table.row.end(a)
}
a<-table.end(a)
table.save(a,file='mytable.tab')