Free Statistics

of Irreproducible Research!

Author's title

Author*The author of this computation has been verified*
R Software Modulerwasp_autocorrelation.wasp
Title produced by software(Partial) Autocorrelation Function
Date of computationTue, 02 Dec 2008 10:59:47 -0700
Cite this page as followsStatistical Computations at FreeStatistics.org, Office for Research Development and Education, URL https://freestatistics.org/blog/index.php?v=date/2008/Dec/02/t122824091007wexe4b4l6nb99.htm/, Retrieved Fri, 17 May 2024 04:17:46 +0000
Statistical Computations at FreeStatistics.org, Office for Research Development and Education, URL https://freestatistics.org/blog/index.php?pk=28162, Retrieved Fri, 17 May 2024 04:17:46 +0000
QR Codes:

Original text written by user:
IsPrivate?No (this computation is public)
User-defined keywords
Estimated Impact188
Family? (F = Feedback message, R = changed R code, M = changed R Module, P = changed Parameters, D = changed Data)
F     [(Partial) Autocorrelation Function] [nsts Q8 (1)] [2008-12-02 16:54:05] [b1bd16d1f47bfe13feacf1c27a0abba5]
F   PD  [(Partial) Autocorrelation Function] [nsts Q8 (2)] [2008-12-02 16:58:46] [b1bd16d1f47bfe13feacf1c27a0abba5]
-   P     [(Partial) Autocorrelation Function] [nsts Q8 (3)] [2008-12-02 17:02:13] [b1bd16d1f47bfe13feacf1c27a0abba5]
F   P         [(Partial) Autocorrelation Function] [nsts Q8 (9)] [2008-12-02 17:59:47] [e7b1048c2c3a353441b9143db4404b91] [Current]
Feedback Forum
2008-12-08 18:51:16 [Jasmine Hendrikx] [reply
Eigen evaluatie:
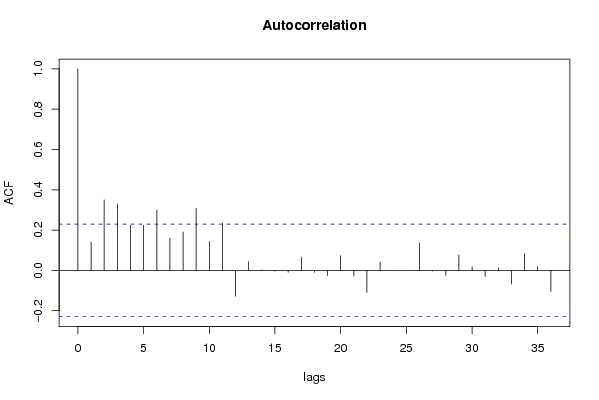
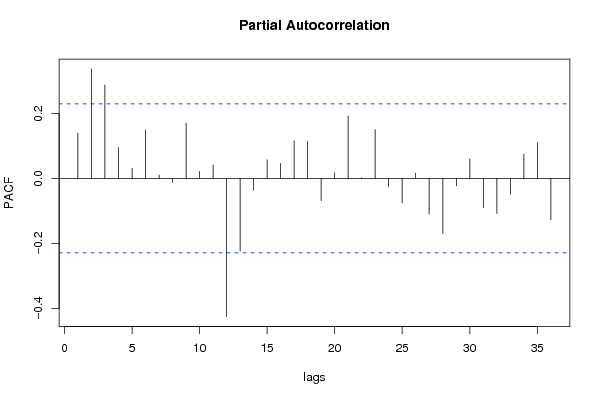
De berekening is goed gemaakt en de conclusie is juist. De seizoenale trend is verdwenen. We kunnen niet meer van seizoenaliteit spreken. We zien zelfs bij lag 12 een negatieve autocorrelatiecoëfficiënt.

Post a new message
Dataseries X:
78.4
114.6
113.3
117.0
99.6
99.4
101.9
115.2
108.5
113.8
121.0
92.2
90.2
101.5
126.6
93.9
89.8
93.4
101.5
110.4
105.9
108.4
113.9
86.1
69.4
101.2
100.5
98.0
106.6
90.1
96.9
125.9
112.0
100.0
123.9
79.8
83.4
113.6
112.9
104.0
109.9
99.0
106.3
128.9
111.1
102.9
130.0
87.0
87.5
117.6
103.4
110.8
112.6
102.5
112.4
135.6
105.1
127.7
137.0
91.0
90.5
122.4
123.3
124.3
120.0
118.1
119.0
142.7
123.6
129.6
151.6
110.4
99.2
130.5
136.2
129.7
128.0
121.6
135.8
143.8
147.5
136.2
156.6
123.3
100.4


Summary of computational transaction
Raw Inputview raw input (R code)
Raw Outputview raw output of R engine
Computing time3 seconds
R Server'Herman Ole Andreas Wold' @ 193.190.124.10:1001

\begin{tabular}{lllllllll}
\hline
Summary of computational transaction \tabularnewline
Raw Input & view raw input (R code)  \tabularnewline
Raw Output & view raw output of R engine  \tabularnewline
Computing time & 3 seconds \tabularnewline
R Server & 'Herman Ole Andreas Wold' @ 193.190.124.10:1001 \tabularnewline
\hline
\end{tabular}
%Source: https://freestatistics.org/blog/index.php?pk=28162&T=0

[TABLE]
[ROW][C]Summary of computational transaction[/C][/ROW]
[ROW][C]Raw Input[/C][C]view raw input (R code) [/C][/ROW]
[ROW][C]Raw Output[/C][C]view raw output of R engine [/C][/ROW]
[ROW][C]Computing time[/C][C]3 seconds[/C][/ROW]
[ROW][C]R Server[/C][C]'Herman Ole Andreas Wold' @ 193.190.124.10:1001[/C][/ROW]
[/TABLE]
Source: https://freestatistics.org/blog/index.php?pk=28162&T=0

Globally Unique Identifier (entire table): ba.freestatistics.org/blog/index.php?pk=28162&T=0

As an alternative you can also use a QR Code:  

The GUIDs for individual cells are displayed in the table below:

Summary of computational transaction
Raw Inputview raw input (R code)
Raw Outputview raw output of R engine
Computing time3 seconds
R Server'Herman Ole Andreas Wold' @ 193.190.124.10:1001


Autocorrelation Function
Time lag kACF(k)T-STATP-value
10.1400961.1970.117594
20.3500042.99040.001898
30.3298392.81810.003106
40.2230841.9060.030291
50.2242631.91610.029634
60.3005122.56760.006144
70.1592381.36050.088924
80.1906611.6290.05381
90.3082752.63390.00515
100.1431181.22280.112668
110.2354272.01150.023983
12-0.128094-1.09440.138682
130.0431610.36880.356685
140.0026620.02270.49096
15-0.003844-0.03280.486943
16-0.009408-0.08040.468078
170.0655710.56020.288515
18-0.00946-0.08080.467902
19-0.025274-0.21590.414818
200.0730440.62410.267258
21-0.028232-0.24120.405033
22-0.109052-0.93170.177272
230.0415050.35460.361947
24-0.000616-0.00530.497909
25-0.001221-0.01040.495852
260.1366121.16720.123462
27-0.002993-0.02560.489833
28-0.024571-0.20990.417152
290.076790.65610.256913
300.0174520.14910.440938
31-0.030316-0.2590.398176
320.0148190.12660.449798
33-0.066827-0.5710.284888
340.0835760.71410.238729
350.0171290.14640.442023
36-0.104345-0.89150.187789

\begin{tabular}{lllllllll}
\hline
Autocorrelation Function \tabularnewline
Time lag k & ACF(k) & T-STAT & P-value \tabularnewline
1 & 0.140096 & 1.197 & 0.117594 \tabularnewline
2 & 0.350004 & 2.9904 & 0.001898 \tabularnewline
3 & 0.329839 & 2.8181 & 0.003106 \tabularnewline
4 & 0.223084 & 1.906 & 0.030291 \tabularnewline
5 & 0.224263 & 1.9161 & 0.029634 \tabularnewline
6 & 0.300512 & 2.5676 & 0.006144 \tabularnewline
7 & 0.159238 & 1.3605 & 0.088924 \tabularnewline
8 & 0.190661 & 1.629 & 0.05381 \tabularnewline
9 & 0.308275 & 2.6339 & 0.00515 \tabularnewline
10 & 0.143118 & 1.2228 & 0.112668 \tabularnewline
11 & 0.235427 & 2.0115 & 0.023983 \tabularnewline
12 & -0.128094 & -1.0944 & 0.138682 \tabularnewline
13 & 0.043161 & 0.3688 & 0.356685 \tabularnewline
14 & 0.002662 & 0.0227 & 0.49096 \tabularnewline
15 & -0.003844 & -0.0328 & 0.486943 \tabularnewline
16 & -0.009408 & -0.0804 & 0.468078 \tabularnewline
17 & 0.065571 & 0.5602 & 0.288515 \tabularnewline
18 & -0.00946 & -0.0808 & 0.467902 \tabularnewline
19 & -0.025274 & -0.2159 & 0.414818 \tabularnewline
20 & 0.073044 & 0.6241 & 0.267258 \tabularnewline
21 & -0.028232 & -0.2412 & 0.405033 \tabularnewline
22 & -0.109052 & -0.9317 & 0.177272 \tabularnewline
23 & 0.041505 & 0.3546 & 0.361947 \tabularnewline
24 & -0.000616 & -0.0053 & 0.497909 \tabularnewline
25 & -0.001221 & -0.0104 & 0.495852 \tabularnewline
26 & 0.136612 & 1.1672 & 0.123462 \tabularnewline
27 & -0.002993 & -0.0256 & 0.489833 \tabularnewline
28 & -0.024571 & -0.2099 & 0.417152 \tabularnewline
29 & 0.07679 & 0.6561 & 0.256913 \tabularnewline
30 & 0.017452 & 0.1491 & 0.440938 \tabularnewline
31 & -0.030316 & -0.259 & 0.398176 \tabularnewline
32 & 0.014819 & 0.1266 & 0.449798 \tabularnewline
33 & -0.066827 & -0.571 & 0.284888 \tabularnewline
34 & 0.083576 & 0.7141 & 0.238729 \tabularnewline
35 & 0.017129 & 0.1464 & 0.442023 \tabularnewline
36 & -0.104345 & -0.8915 & 0.187789 \tabularnewline
\hline
\end{tabular}
%Source: https://freestatistics.org/blog/index.php?pk=28162&T=1

[TABLE]
[ROW][C]Autocorrelation Function[/C][/ROW]
[ROW][C]Time lag k[/C][C]ACF(k)[/C][C]T-STAT[/C][C]P-value[/C][/ROW]
[ROW][C]1[/C][C]0.140096[/C][C]1.197[/C][C]0.117594[/C][/ROW]
[ROW][C]2[/C][C]0.350004[/C][C]2.9904[/C][C]0.001898[/C][/ROW]
[ROW][C]3[/C][C]0.329839[/C][C]2.8181[/C][C]0.003106[/C][/ROW]
[ROW][C]4[/C][C]0.223084[/C][C]1.906[/C][C]0.030291[/C][/ROW]
[ROW][C]5[/C][C]0.224263[/C][C]1.9161[/C][C]0.029634[/C][/ROW]
[ROW][C]6[/C][C]0.300512[/C][C]2.5676[/C][C]0.006144[/C][/ROW]
[ROW][C]7[/C][C]0.159238[/C][C]1.3605[/C][C]0.088924[/C][/ROW]
[ROW][C]8[/C][C]0.190661[/C][C]1.629[/C][C]0.05381[/C][/ROW]
[ROW][C]9[/C][C]0.308275[/C][C]2.6339[/C][C]0.00515[/C][/ROW]
[ROW][C]10[/C][C]0.143118[/C][C]1.2228[/C][C]0.112668[/C][/ROW]
[ROW][C]11[/C][C]0.235427[/C][C]2.0115[/C][C]0.023983[/C][/ROW]
[ROW][C]12[/C][C]-0.128094[/C][C]-1.0944[/C][C]0.138682[/C][/ROW]
[ROW][C]13[/C][C]0.043161[/C][C]0.3688[/C][C]0.356685[/C][/ROW]
[ROW][C]14[/C][C]0.002662[/C][C]0.0227[/C][C]0.49096[/C][/ROW]
[ROW][C]15[/C][C]-0.003844[/C][C]-0.0328[/C][C]0.486943[/C][/ROW]
[ROW][C]16[/C][C]-0.009408[/C][C]-0.0804[/C][C]0.468078[/C][/ROW]
[ROW][C]17[/C][C]0.065571[/C][C]0.5602[/C][C]0.288515[/C][/ROW]
[ROW][C]18[/C][C]-0.00946[/C][C]-0.0808[/C][C]0.467902[/C][/ROW]
[ROW][C]19[/C][C]-0.025274[/C][C]-0.2159[/C][C]0.414818[/C][/ROW]
[ROW][C]20[/C][C]0.073044[/C][C]0.6241[/C][C]0.267258[/C][/ROW]
[ROW][C]21[/C][C]-0.028232[/C][C]-0.2412[/C][C]0.405033[/C][/ROW]
[ROW][C]22[/C][C]-0.109052[/C][C]-0.9317[/C][C]0.177272[/C][/ROW]
[ROW][C]23[/C][C]0.041505[/C][C]0.3546[/C][C]0.361947[/C][/ROW]
[ROW][C]24[/C][C]-0.000616[/C][C]-0.0053[/C][C]0.497909[/C][/ROW]
[ROW][C]25[/C][C]-0.001221[/C][C]-0.0104[/C][C]0.495852[/C][/ROW]
[ROW][C]26[/C][C]0.136612[/C][C]1.1672[/C][C]0.123462[/C][/ROW]
[ROW][C]27[/C][C]-0.002993[/C][C]-0.0256[/C][C]0.489833[/C][/ROW]
[ROW][C]28[/C][C]-0.024571[/C][C]-0.2099[/C][C]0.417152[/C][/ROW]
[ROW][C]29[/C][C]0.07679[/C][C]0.6561[/C][C]0.256913[/C][/ROW]
[ROW][C]30[/C][C]0.017452[/C][C]0.1491[/C][C]0.440938[/C][/ROW]
[ROW][C]31[/C][C]-0.030316[/C][C]-0.259[/C][C]0.398176[/C][/ROW]
[ROW][C]32[/C][C]0.014819[/C][C]0.1266[/C][C]0.449798[/C][/ROW]
[ROW][C]33[/C][C]-0.066827[/C][C]-0.571[/C][C]0.284888[/C][/ROW]
[ROW][C]34[/C][C]0.083576[/C][C]0.7141[/C][C]0.238729[/C][/ROW]
[ROW][C]35[/C][C]0.017129[/C][C]0.1464[/C][C]0.442023[/C][/ROW]
[ROW][C]36[/C][C]-0.104345[/C][C]-0.8915[/C][C]0.187789[/C][/ROW]
[/TABLE]
Source: https://freestatistics.org/blog/index.php?pk=28162&T=1

Globally Unique Identifier (entire table): ba.freestatistics.org/blog/index.php?pk=28162&T=1

As an alternative you can also use a QR Code:  

The GUIDs for individual cells are displayed in the table below:

Autocorrelation Function
Time lag kACF(k)T-STATP-value
10.1400961.1970.117594
20.3500042.99040.001898
30.3298392.81810.003106
40.2230841.9060.030291
50.2242631.91610.029634
60.3005122.56760.006144
70.1592381.36050.088924
80.1906611.6290.05381
90.3082752.63390.00515
100.1431181.22280.112668
110.2354272.01150.023983
12-0.128094-1.09440.138682
130.0431610.36880.356685
140.0026620.02270.49096
15-0.003844-0.03280.486943
16-0.009408-0.08040.468078
170.0655710.56020.288515
18-0.00946-0.08080.467902
19-0.025274-0.21590.414818
200.0730440.62410.267258
21-0.028232-0.24120.405033
22-0.109052-0.93170.177272
230.0415050.35460.361947
24-0.000616-0.00530.497909
25-0.001221-0.01040.495852
260.1366121.16720.123462
27-0.002993-0.02560.489833
28-0.024571-0.20990.417152
290.076790.65610.256913
300.0174520.14910.440938
31-0.030316-0.2590.398176
320.0148190.12660.449798
33-0.066827-0.5710.284888
340.0835760.71410.238729
350.0171290.14640.442023
36-0.104345-0.89150.187789


Partial Autocorrelation Function
Time lag kPACF(k)T-STATP-value
10.1400961.1970.117594
20.3369912.87930.002614
30.287812.45910.00815
40.0947560.80960.210401
50.0309890.26480.395967
60.1489081.27230.103657
70.0108440.09270.463216
8-0.012869-0.110.456374
90.1698691.45140.075481
100.0215920.18450.427073
110.0413830.35360.362338
12-0.425653-3.63680.000256
13-0.223938-1.91330.029814
14-0.03655-0.31230.377857
150.0574350.49070.312548
160.0460910.39380.347437
170.116280.99350.161876
180.1143090.97670.165983
19-0.068983-0.58940.278709
200.0172330.14720.441674
210.1919571.64010.052646
220.0019950.0170.493225
230.1503281.28440.101532
24-0.026447-0.2260.410931
25-0.075652-0.64640.260034
260.01610.13760.445484
27-0.109588-0.93630.176097
28-0.169848-1.45120.075506
29-0.023292-0.1990.421406
300.0604830.51680.30344
31-0.089369-0.76360.223791
32-0.107695-0.92010.180264
33-0.048783-0.41680.339025
340.0750480.64120.261698
350.1106910.94570.1737
36-0.127264-1.08730.14023

\begin{tabular}{lllllllll}
\hline
Partial Autocorrelation Function \tabularnewline
Time lag k & PACF(k) & T-STAT & P-value \tabularnewline
1 & 0.140096 & 1.197 & 0.117594 \tabularnewline
2 & 0.336991 & 2.8793 & 0.002614 \tabularnewline
3 & 0.28781 & 2.4591 & 0.00815 \tabularnewline
4 & 0.094756 & 0.8096 & 0.210401 \tabularnewline
5 & 0.030989 & 0.2648 & 0.395967 \tabularnewline
6 & 0.148908 & 1.2723 & 0.103657 \tabularnewline
7 & 0.010844 & 0.0927 & 0.463216 \tabularnewline
8 & -0.012869 & -0.11 & 0.456374 \tabularnewline
9 & 0.169869 & 1.4514 & 0.075481 \tabularnewline
10 & 0.021592 & 0.1845 & 0.427073 \tabularnewline
11 & 0.041383 & 0.3536 & 0.362338 \tabularnewline
12 & -0.425653 & -3.6368 & 0.000256 \tabularnewline
13 & -0.223938 & -1.9133 & 0.029814 \tabularnewline
14 & -0.03655 & -0.3123 & 0.377857 \tabularnewline
15 & 0.057435 & 0.4907 & 0.312548 \tabularnewline
16 & 0.046091 & 0.3938 & 0.347437 \tabularnewline
17 & 0.11628 & 0.9935 & 0.161876 \tabularnewline
18 & 0.114309 & 0.9767 & 0.165983 \tabularnewline
19 & -0.068983 & -0.5894 & 0.278709 \tabularnewline
20 & 0.017233 & 0.1472 & 0.441674 \tabularnewline
21 & 0.191957 & 1.6401 & 0.052646 \tabularnewline
22 & 0.001995 & 0.017 & 0.493225 \tabularnewline
23 & 0.150328 & 1.2844 & 0.101532 \tabularnewline
24 & -0.026447 & -0.226 & 0.410931 \tabularnewline
25 & -0.075652 & -0.6464 & 0.260034 \tabularnewline
26 & 0.0161 & 0.1376 & 0.445484 \tabularnewline
27 & -0.109588 & -0.9363 & 0.176097 \tabularnewline
28 & -0.169848 & -1.4512 & 0.075506 \tabularnewline
29 & -0.023292 & -0.199 & 0.421406 \tabularnewline
30 & 0.060483 & 0.5168 & 0.30344 \tabularnewline
31 & -0.089369 & -0.7636 & 0.223791 \tabularnewline
32 & -0.107695 & -0.9201 & 0.180264 \tabularnewline
33 & -0.048783 & -0.4168 & 0.339025 \tabularnewline
34 & 0.075048 & 0.6412 & 0.261698 \tabularnewline
35 & 0.110691 & 0.9457 & 0.1737 \tabularnewline
36 & -0.127264 & -1.0873 & 0.14023 \tabularnewline
\hline
\end{tabular}
%Source: https://freestatistics.org/blog/index.php?pk=28162&T=2

[TABLE]
[ROW][C]Partial Autocorrelation Function[/C][/ROW]
[ROW][C]Time lag k[/C][C]PACF(k)[/C][C]T-STAT[/C][C]P-value[/C][/ROW]
[ROW][C]1[/C][C]0.140096[/C][C]1.197[/C][C]0.117594[/C][/ROW]
[ROW][C]2[/C][C]0.336991[/C][C]2.8793[/C][C]0.002614[/C][/ROW]
[ROW][C]3[/C][C]0.28781[/C][C]2.4591[/C][C]0.00815[/C][/ROW]
[ROW][C]4[/C][C]0.094756[/C][C]0.8096[/C][C]0.210401[/C][/ROW]
[ROW][C]5[/C][C]0.030989[/C][C]0.2648[/C][C]0.395967[/C][/ROW]
[ROW][C]6[/C][C]0.148908[/C][C]1.2723[/C][C]0.103657[/C][/ROW]
[ROW][C]7[/C][C]0.010844[/C][C]0.0927[/C][C]0.463216[/C][/ROW]
[ROW][C]8[/C][C]-0.012869[/C][C]-0.11[/C][C]0.456374[/C][/ROW]
[ROW][C]9[/C][C]0.169869[/C][C]1.4514[/C][C]0.075481[/C][/ROW]
[ROW][C]10[/C][C]0.021592[/C][C]0.1845[/C][C]0.427073[/C][/ROW]
[ROW][C]11[/C][C]0.041383[/C][C]0.3536[/C][C]0.362338[/C][/ROW]
[ROW][C]12[/C][C]-0.425653[/C][C]-3.6368[/C][C]0.000256[/C][/ROW]
[ROW][C]13[/C][C]-0.223938[/C][C]-1.9133[/C][C]0.029814[/C][/ROW]
[ROW][C]14[/C][C]-0.03655[/C][C]-0.3123[/C][C]0.377857[/C][/ROW]
[ROW][C]15[/C][C]0.057435[/C][C]0.4907[/C][C]0.312548[/C][/ROW]
[ROW][C]16[/C][C]0.046091[/C][C]0.3938[/C][C]0.347437[/C][/ROW]
[ROW][C]17[/C][C]0.11628[/C][C]0.9935[/C][C]0.161876[/C][/ROW]
[ROW][C]18[/C][C]0.114309[/C][C]0.9767[/C][C]0.165983[/C][/ROW]
[ROW][C]19[/C][C]-0.068983[/C][C]-0.5894[/C][C]0.278709[/C][/ROW]
[ROW][C]20[/C][C]0.017233[/C][C]0.1472[/C][C]0.441674[/C][/ROW]
[ROW][C]21[/C][C]0.191957[/C][C]1.6401[/C][C]0.052646[/C][/ROW]
[ROW][C]22[/C][C]0.001995[/C][C]0.017[/C][C]0.493225[/C][/ROW]
[ROW][C]23[/C][C]0.150328[/C][C]1.2844[/C][C]0.101532[/C][/ROW]
[ROW][C]24[/C][C]-0.026447[/C][C]-0.226[/C][C]0.410931[/C][/ROW]
[ROW][C]25[/C][C]-0.075652[/C][C]-0.6464[/C][C]0.260034[/C][/ROW]
[ROW][C]26[/C][C]0.0161[/C][C]0.1376[/C][C]0.445484[/C][/ROW]
[ROW][C]27[/C][C]-0.109588[/C][C]-0.9363[/C][C]0.176097[/C][/ROW]
[ROW][C]28[/C][C]-0.169848[/C][C]-1.4512[/C][C]0.075506[/C][/ROW]
[ROW][C]29[/C][C]-0.023292[/C][C]-0.199[/C][C]0.421406[/C][/ROW]
[ROW][C]30[/C][C]0.060483[/C][C]0.5168[/C][C]0.30344[/C][/ROW]
[ROW][C]31[/C][C]-0.089369[/C][C]-0.7636[/C][C]0.223791[/C][/ROW]
[ROW][C]32[/C][C]-0.107695[/C][C]-0.9201[/C][C]0.180264[/C][/ROW]
[ROW][C]33[/C][C]-0.048783[/C][C]-0.4168[/C][C]0.339025[/C][/ROW]
[ROW][C]34[/C][C]0.075048[/C][C]0.6412[/C][C]0.261698[/C][/ROW]
[ROW][C]35[/C][C]0.110691[/C][C]0.9457[/C][C]0.1737[/C][/ROW]
[ROW][C]36[/C][C]-0.127264[/C][C]-1.0873[/C][C]0.14023[/C][/ROW]
[/TABLE]
Source: https://freestatistics.org/blog/index.php?pk=28162&T=2

Globally Unique Identifier (entire table): ba.freestatistics.org/blog/index.php?pk=28162&T=2

As an alternative you can also use a QR Code:  

The GUIDs for individual cells are displayed in the table below:

Partial Autocorrelation Function
Time lag kPACF(k)T-STATP-value
10.1400961.1970.117594
20.3369912.87930.002614
30.287812.45910.00815
40.0947560.80960.210401
50.0309890.26480.395967
60.1489081.27230.103657
70.0108440.09270.463216
8-0.012869-0.110.456374
90.1698691.45140.075481
100.0215920.18450.427073
110.0413830.35360.362338
12-0.425653-3.63680.000256
13-0.223938-1.91330.029814
14-0.03655-0.31230.377857
150.0574350.49070.312548
160.0460910.39380.347437
170.116280.99350.161876
180.1143090.97670.165983
19-0.068983-0.58940.278709
200.0172330.14720.441674
210.1919571.64010.052646
220.0019950.0170.493225
230.1503281.28440.101532
24-0.026447-0.2260.410931
25-0.075652-0.64640.260034
260.01610.13760.445484
27-0.109588-0.93630.176097
28-0.169848-1.45120.075506
29-0.023292-0.1990.421406
300.0604830.51680.30344
31-0.089369-0.76360.223791
32-0.107695-0.92010.180264
33-0.048783-0.41680.339025
340.0750480.64120.261698
350.1106910.94570.1737
36-0.127264-1.08730.14023


Parameters (Session):
par1 = 36 ; par2 = 1 ; par3 = 0 ; par4 = 1 ; par5 = 12 ;
Parameters (R input):
par1 = 36 ; par2 = 1 ; par3 = 0 ; par4 = 1 ; par5 = 12 ;
R code (references can be found in the software module):
if (par1 == 'Default') {
par1 = 10*log10(length(x))
} else {
par1 <- as.numeric(par1)
}
par2 <- as.numeric(par2)
par3 <- as.numeric(par3)
par4 <- as.numeric(par4)
par5 <- as.numeric(par5)
if (par2 == 0) {
x <- log(x)
} else {
x <- (x ^ par2 - 1) / par2
}
if (par3 > 0) x <- diff(x,lag=1,difference=par3)
if (par4 > 0) x <- diff(x,lag=par5,difference=par4)
bitmap(file='pic1.png')
racf <- acf(x,par1,main='Autocorrelation',xlab='lags',ylab='ACF')
dev.off()
bitmap(file='pic2.png')
rpacf <- pacf(x,par1,main='Partial Autocorrelation',xlab='lags',ylab='PACF')
dev.off()
(myacf <- c(racf$acf))
(mypacf <- c(rpacf$acf))
lengthx <- length(x)
sqrtn <- sqrt(lengthx)
load(file='createtable')
a<-table.start()
a<-table.row.start(a)
a<-table.element(a,'Autocorrelation Function',4,TRUE)
a<-table.row.end(a)
a<-table.row.start(a)
a<-table.element(a,'Time lag k',header=TRUE)
a<-table.element(a,hyperlink('basics.htm','ACF(k)','click here for more information about the Autocorrelation Function'),header=TRUE)
a<-table.element(a,'T-STAT',header=TRUE)
a<-table.element(a,'P-value',header=TRUE)
a<-table.row.end(a)
for (i in 2:(par1+1)) {
a<-table.row.start(a)
a<-table.element(a,i-1,header=TRUE)
a<-table.element(a,round(myacf[i],6))
mytstat <- myacf[i]*sqrtn
a<-table.element(a,round(mytstat,4))
a<-table.element(a,round(1-pt(abs(mytstat),lengthx),6))
a<-table.row.end(a)
}
a<-table.end(a)
table.save(a,file='mytable.tab')
a<-table.start()
a<-table.row.start(a)
a<-table.element(a,'Partial Autocorrelation Function',4,TRUE)
a<-table.row.end(a)
a<-table.row.start(a)
a<-table.element(a,'Time lag k',header=TRUE)
a<-table.element(a,hyperlink('basics.htm','PACF(k)','click here for more information about the Partial Autocorrelation Function'),header=TRUE)
a<-table.element(a,'T-STAT',header=TRUE)
a<-table.element(a,'P-value',header=TRUE)
a<-table.row.end(a)
for (i in 1:par1) {
a<-table.row.start(a)
a<-table.element(a,i,header=TRUE)
a<-table.element(a,round(mypacf[i],6))
mytstat <- mypacf[i]*sqrtn
a<-table.element(a,round(mytstat,4))
a<-table.element(a,round(1-pt(abs(mytstat),lengthx),6))
a<-table.row.end(a)
}
a<-table.end(a)
table.save(a,file='mytable1.tab')